| Param | Original file | Final file |
|---|---|---|
| Filename | modeM0/AS1G05_240T01_9000000536_04267cztM0_level2.evt | modeM0/AS1G05_240T01_9000000536_04267cztM0_level2_quad_clean.evt |
| Size (bytes) | 524,243,520 | 81,601,920 |
| Size | 500.0 MB | 77.8 MB |
| Events in quadrant A | 3,264,657 | 513,040 |
| Events in quadrant B | 5,151,980 | 505,855 |
| Events in quadrant C | 3,150,937 | 496,432 |
| Events in quadrant D | 3,854,334 | 487,947 |
| Mode SS | |||
|---|---|---|---|
| Quadrant | BADHDUFLAG | Total packets | Discarded packets |
| A | 0 | 136 | 0 |
| B | 0 | 136 | 0 |
| C | 0 | 136 | 0 |
| D | 0 | 136 | 0 |
| Mode M9 | |||
|---|---|---|---|
| Quadrant | BADHDUFLAG | Total packets | Discarded packets |
| A | 0 | 13 | 0 |
| B | 0 | 13 | 0 |
| C | 0 | 13 | 0 |
| D | 0 | 14 | 0 |
| Mode M0 | |||
|---|---|---|---|
| Quadrant | BADHDUFLAG | Total packets | Discarded packets |
| A | 0 | 14039 | 3 |
| B | 0 | 20167 | 2 |
| C | 0 | 14086 | 2 |
| D | 0 | 16012 | 2 |
| Quadrant | Total seconds | Saturated seconds | Saturation percentage |
|---|---|---|---|
| A | 6709 | 71 | 1.058280% |
| B | 6709 | 95 | 1.416008% |
| C | 6709 | 95 | 1.416008% |
| D | 6709 | 144 | 2.146371% |
Noise dominated data is calculated using 1-second bins in cleaned event files. If a bin has >2000 counts, and if more than 50% of those come from <1% of pixels, then it is considered to be noise-dominated and hence unusable.
| Quadrant | # 1 sec bins | Bins with >0 counts | Bins with >2000 counts | High rate bins dominated by noise | Noise dominated (total time) | Noise dominated (detector-on time) | Marked lightcurve |
|---|---|---|---|---|---|---|---|
| A | 7809 | 6709 | 2 | 2 | 0.03% | 0.03% | 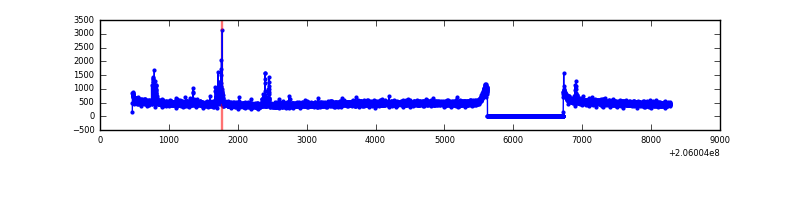 |
| B | 7809 | 6709 | 4 | 4 | 0.05% | 0.06% | 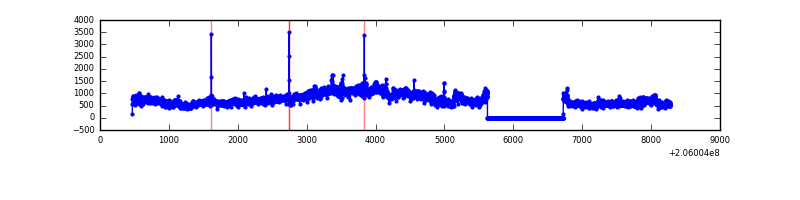 |
| C | 7809 | 6709 | 38 | 38 | 0.49% | 0.57% | 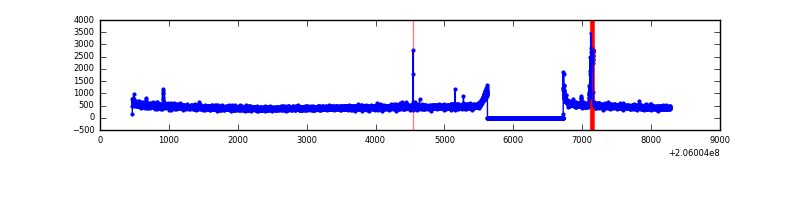 |
| D | 7809 | 6709 | 85 | 85 | 1.09% | 1.27% | 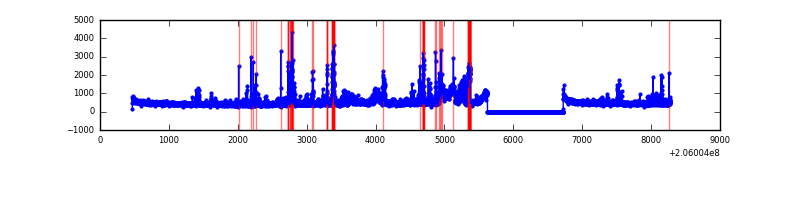 |
Top three noisy pixels from each quadrant. If the there are fewer than three noisy pixels in the level2.evt file, extra rows are filled as -1
| Pixel properties | Quadrant properties | ||||||
|---|---|---|---|---|---|---|---|
| Quadrant | DetID | PixID | Counts | Sigma | Mean | Median | Sigma |
| A | 0 | 50 | 84026 | 507.96 | 801 | 783 | 163.9 |
| A | 8 | 15 | 72766 | 439.25 | 801 | 783 | 163.9 |
| A | 0 | 199 | 12158 | 69.41 | 801 | 783 | 163.9 |
| B | 3 | 0 | 1923285 | 12633.67 | 798 | 783 | 152.2 |
| B | 15 | 204 | 55420 | 359.05 | 798 | 783 | 152.2 |
| B | 8 | 3 | 30013 | 192.08 | 798 | 783 | 152.2 |
| C | 9 | 144 | 120328 | 654.1 | 770 | 773 | 182.8 |
| C | 8 | 128 | 7722 | 38.02 | 770 | 773 | 182.8 |
| C | 9 | 54 | 7113 | 34.69 | 770 | 773 | 182.8 |
| D | 2 | 232 | 412249 | 2161.76 | 778 | 756 | 190.4 |
| D | 13 | 239 | 180515 | 944.36 | 778 | 756 | 190.4 |
| D | 2 | 136 | 113684 | 593.26 | 778 | 756 | 190.4 |
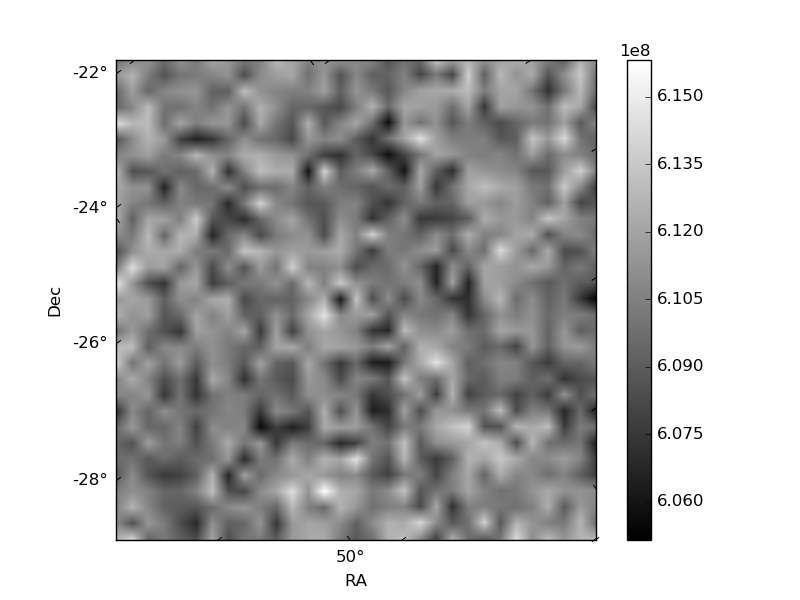
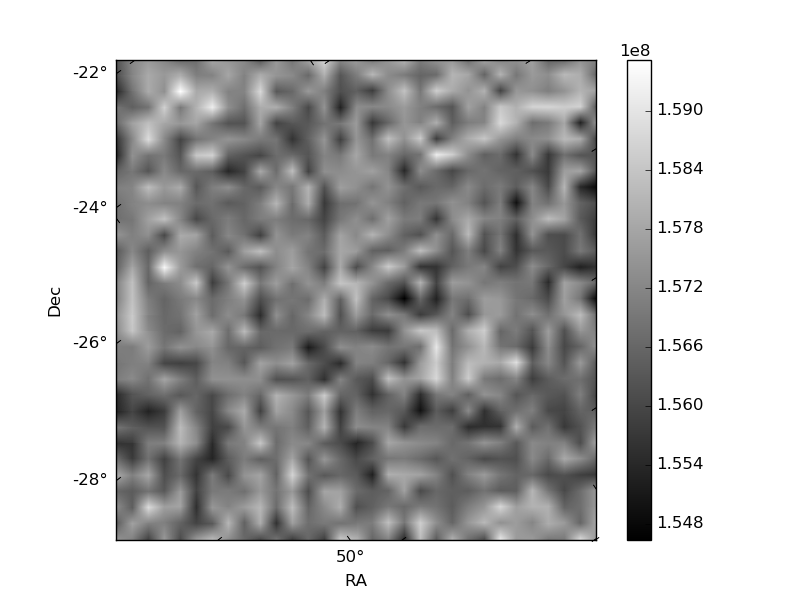
Histogram calculated using DETX and DETY for each event in the final _common_clean file
| Quadrant A | 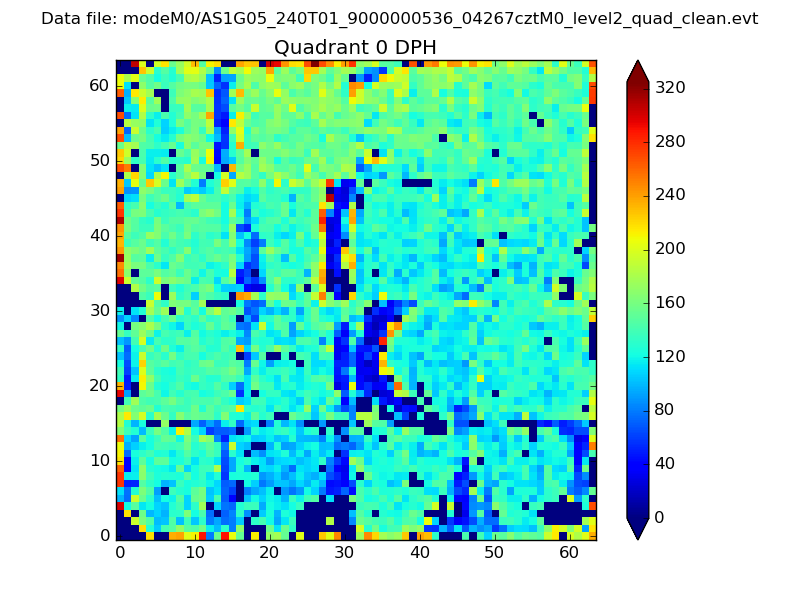 |
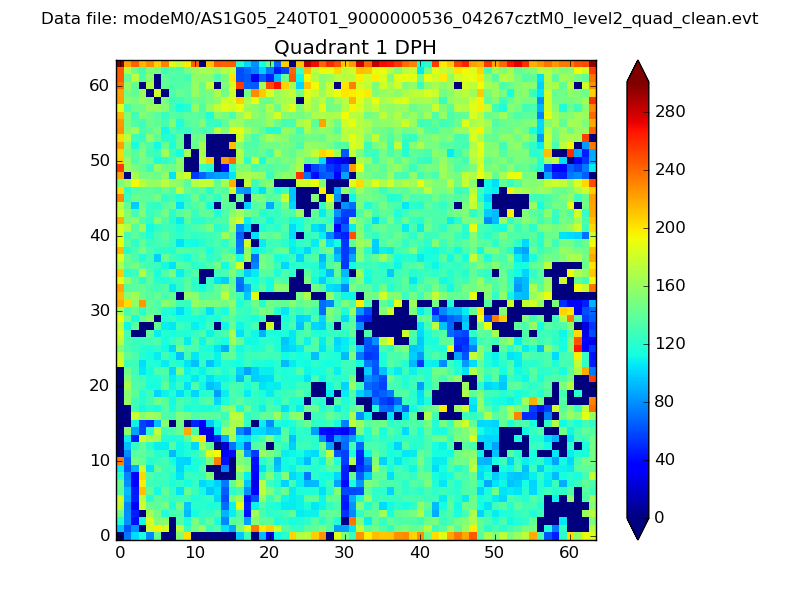 |
Quadrant B |
|---|---|---|---|
| Quadrant D | 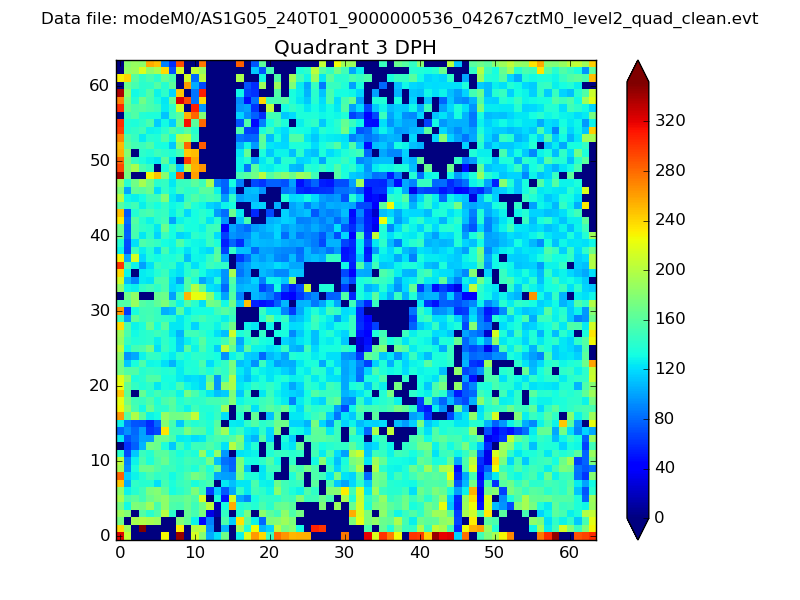 |
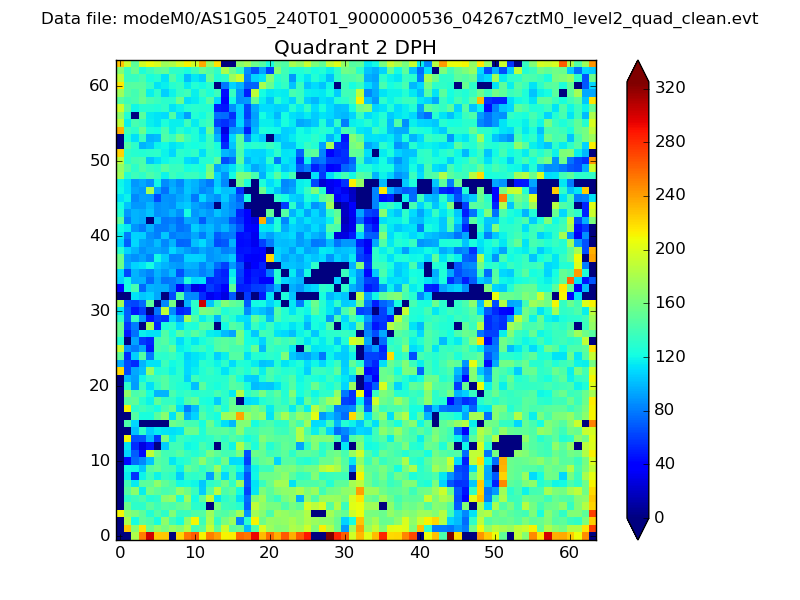 |
Quadrant C |
| Plot type | Count rate plots | Images |
|---|---|---|
| Comparison with Poisson distribution Blue bars denote a histogram of data divided into 1 sec bins. Red curve is a Poisson curve with rate = median count rate of data. |
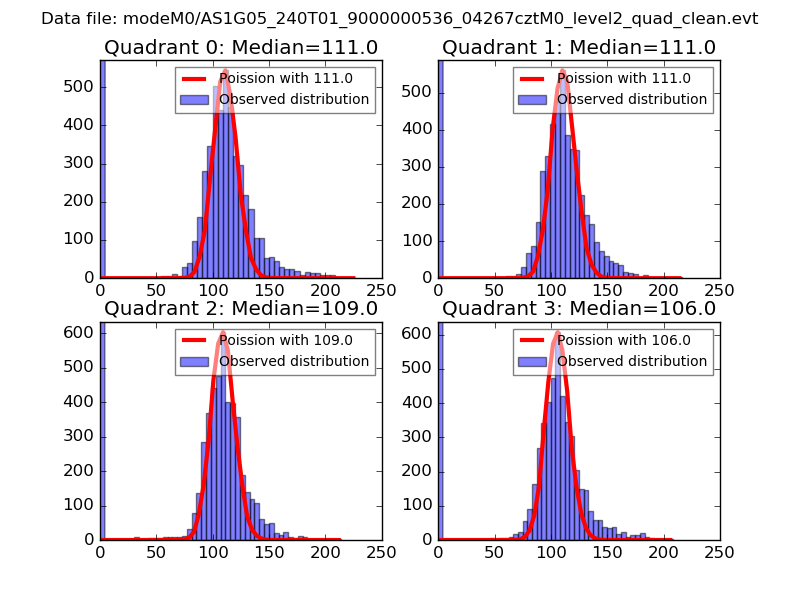 |
 |
| Quadrant-wise count rates Data is divided into 100 sec bins |
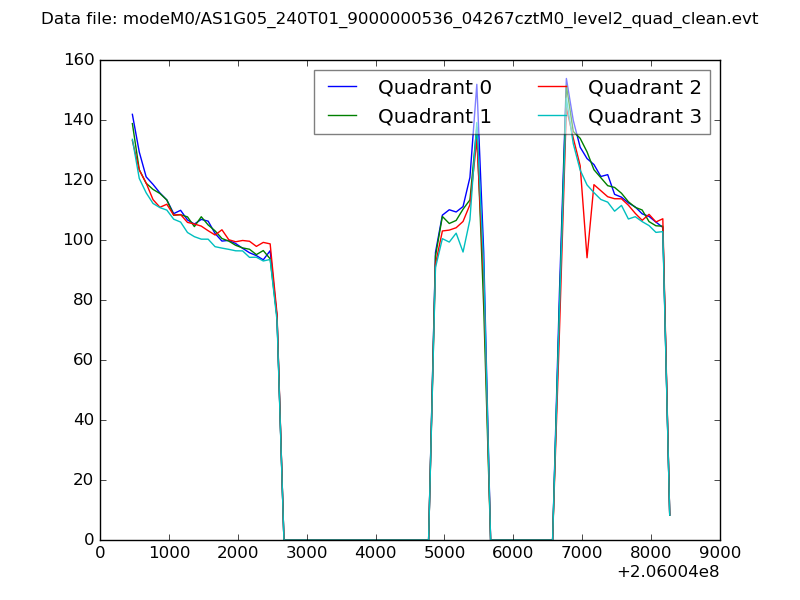 |
|
| Module-wise count rates for Quadrant A Data is divided into 100 sec bins |
 |
 |
| Module-wise count rates for Quadrant B Data is divided into 100 sec bins |
 |
 |
| Module-wise count rates for Quadrant C Data is divided into 100 sec bins |
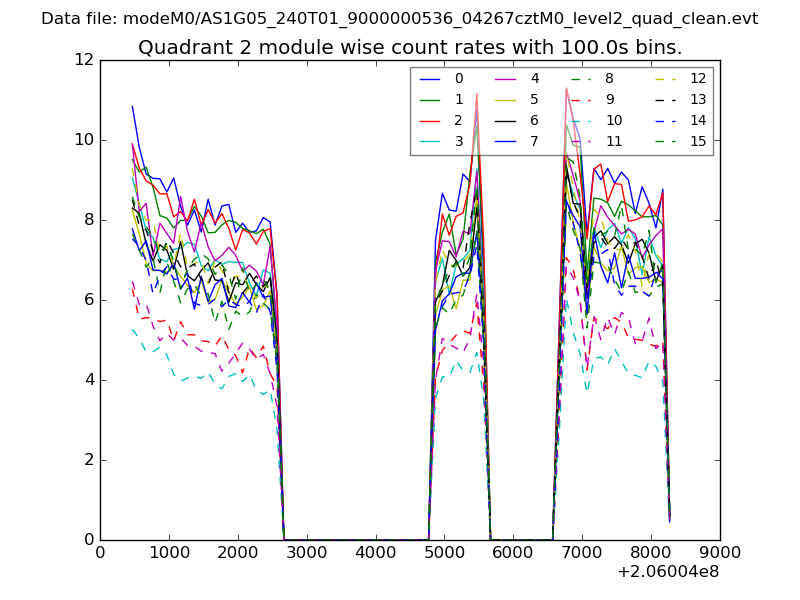 |
 |
| Module-wise count rates for Quadrant D Data is divided into 100 sec bins |
 |
 |
| Parameter | Plot |
|---|---|
| CZT HV Monitor | 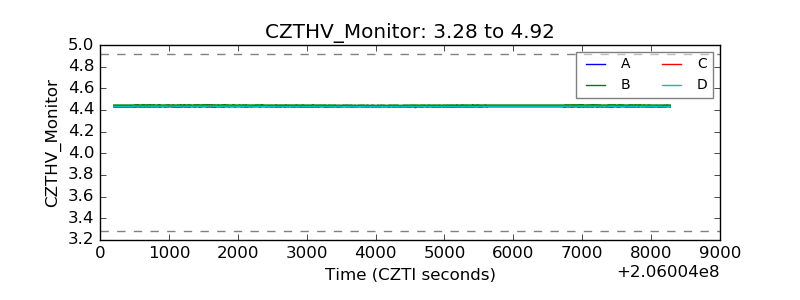 |
| D_VDD | 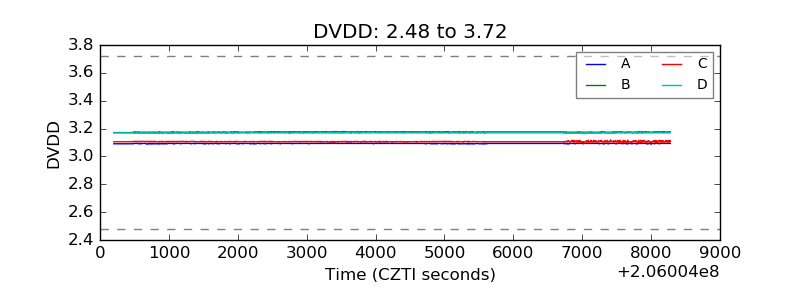 |
| Temperature 1 |  |
| Veto HV Monitor | 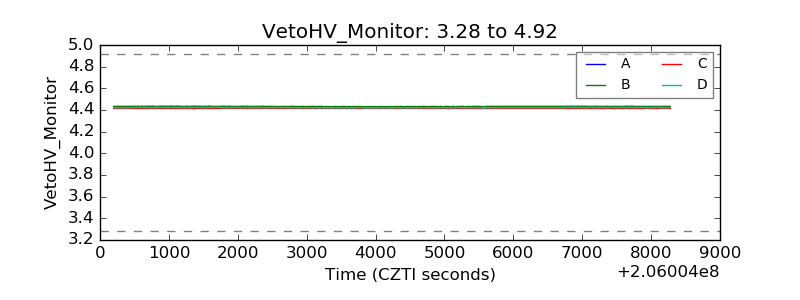 |
| Veto LLD | 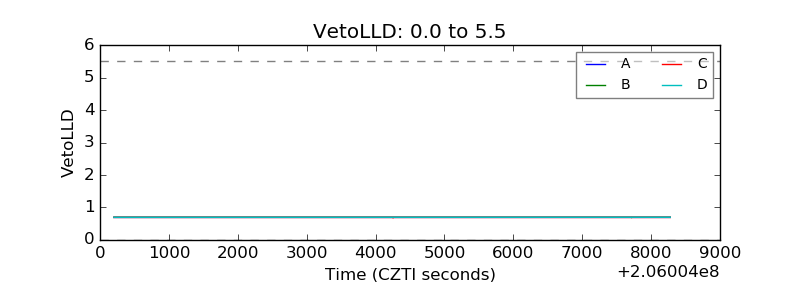 |
| Alpha Counter | 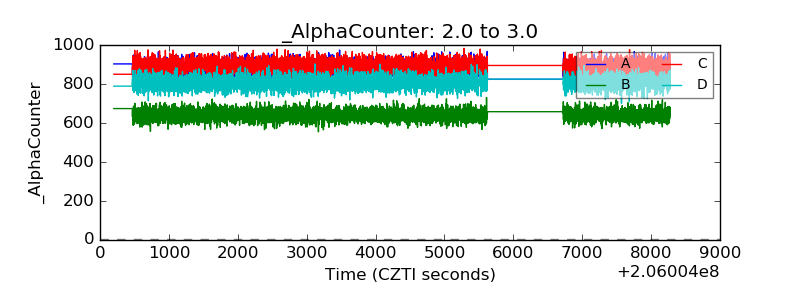 |
| _CPM_Rate | 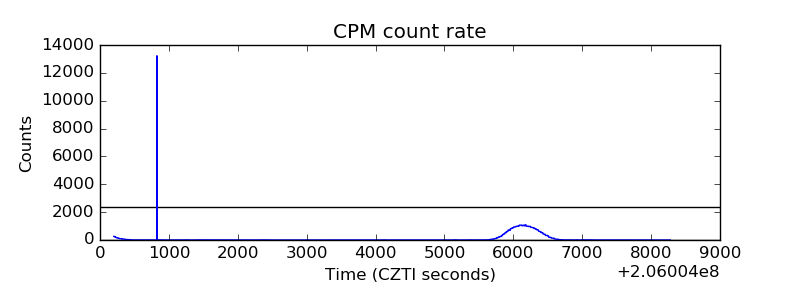 |
| CZT Counter | 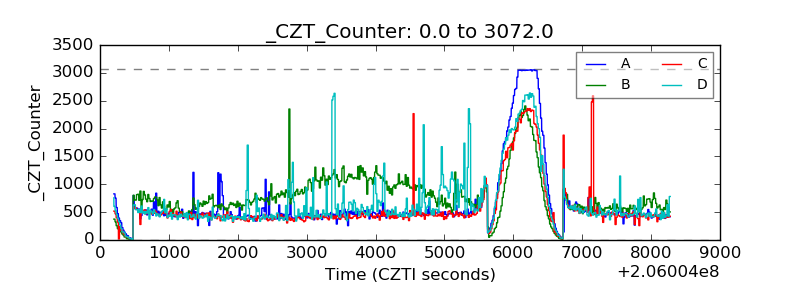 |
| +2.5 Volts monitor |  |
| +5 Volts monitor |  |
| _ROLL_ROT | 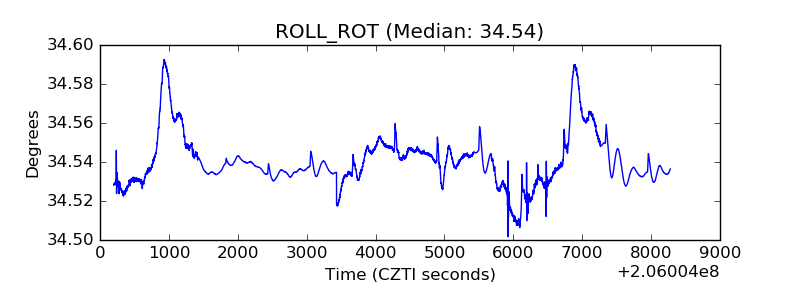 |
| _Roll_DEC | 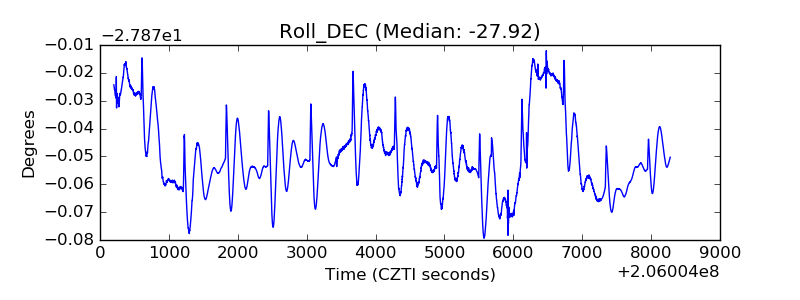 |
| _Roll_RA | 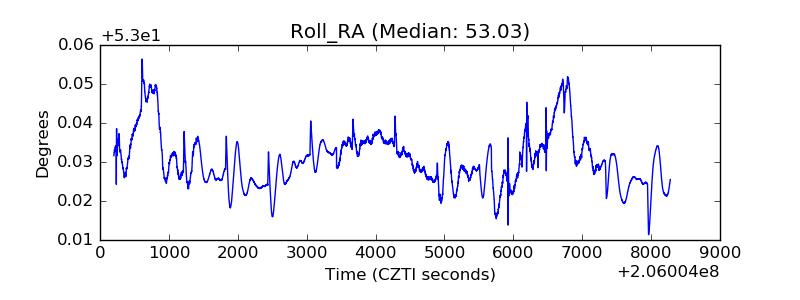 |
| Veto Counter | 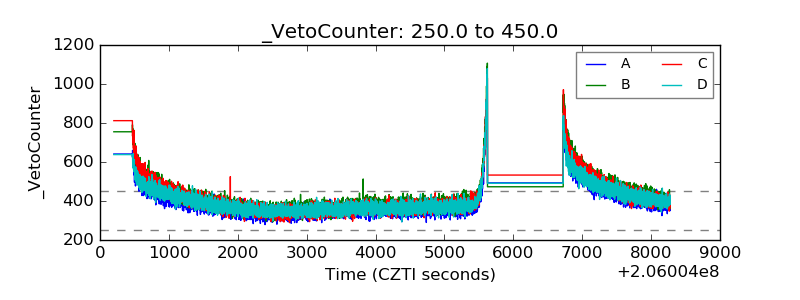 |