| Param | Original file | Final file |
|---|---|---|
| Filename | modeM0/AS1G05_240T01_9000000536_04268cztM0_level2.evt | modeM0/AS1G05_240T01_9000000536_04268cztM0_level2_quad_clean.evt |
| Size (bytes) | 1,315,091,520 | 178,813,440 |
| Size | 1.2 GB | 170.5 MB |
| Events in quadrant A | 8,093,405 | 1,092,758 |
| Events in quadrant B | 13,355,167 | 1,077,790 |
| Events in quadrant C | 7,671,580 | 1,062,611 |
| Events in quadrant D | 9,586,068 | 1,035,462 |
| Mode SS | |||
|---|---|---|---|
| Quadrant | BADHDUFLAG | Total packets | Discarded packets |
| A | 0 | 338 | 0 |
| B | 0 | 338 | 0 |
| C | 0 | 338 | 0 |
| D | 0 | 338 | 0 |
| Mode M9 | |||
|---|---|---|---|
| Quadrant | BADHDUFLAG | Total packets | Discarded packets |
| A | 0 | 34 | 0 |
| B | 0 | 34 | 0 |
| C | 0 | 34 | 0 |
| D | 0 | 34 | 0 |
| Mode M0 | |||
|---|---|---|---|
| Quadrant | BADHDUFLAG | Total packets | Discarded packets |
| A | 0 | 34816 | 4 |
| B | 0 | 51463 | 6 |
| C | 0 | 34563 | 3 |
| D | 0 | 39866 | 3 |
| Quadrant | Total seconds | Saturated seconds | Saturation percentage |
|---|---|---|---|
| A | 16629 | 137 | 0.823862% |
| B | 16628 | 273 | 1.641809% |
| C | 16629 | 140 | 0.841903% |
| D | 16629 | 357 | 2.146852% |
Noise dominated data is calculated using 1-second bins in cleaned event files. If a bin has >2000 counts, and if more than 50% of those come from <1% of pixels, then it is considered to be noise-dominated and hence unusable.
| Quadrant | # 1 sec bins | Bins with >0 counts | Bins with >2000 counts | High rate bins dominated by noise | Noise dominated (total time) | Noise dominated (detector-on time) | Marked lightcurve |
|---|---|---|---|---|---|---|---|
| A | 19994 | 16631 | 8 | 8 | 0.04% | 0.05% | 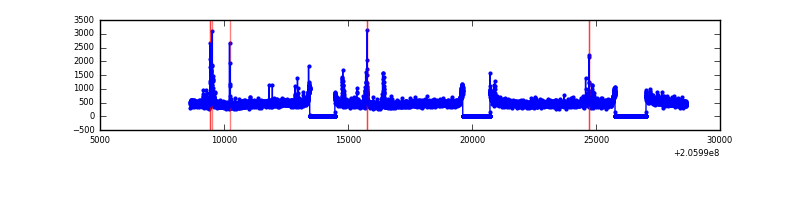 |
| B | 19994 | 16630 | 16 | 16 | 0.08% | 0.10% | 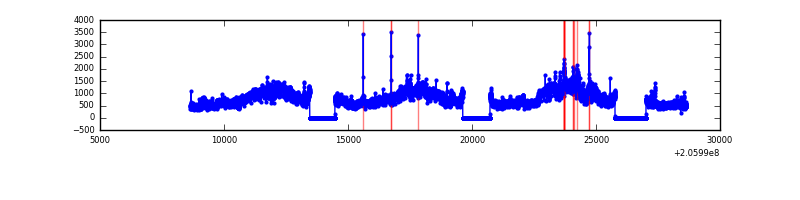 |
| C | 19994 | 16631 | 47 | 47 | 0.24% | 0.28% | 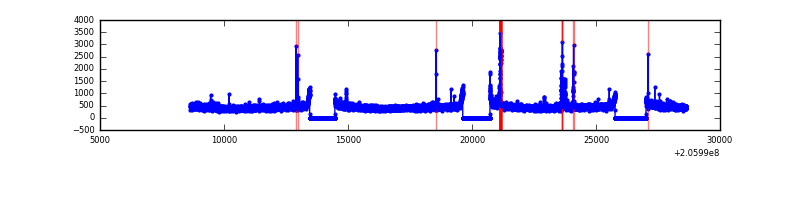 |
| D | 19994 | 16630 | 249 | 249 | 1.25% | 1.50% | 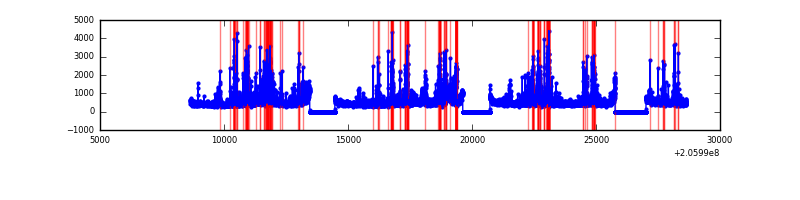 |
Top three noisy pixels from each quadrant. If the there are fewer than three noisy pixels in the level2.evt file, extra rows are filled as -1
| Pixel properties | Quadrant properties | ||||||
|---|---|---|---|---|---|---|---|
| Quadrant | DetID | PixID | Counts | Sigma | Mean | Median | Sigma |
| A | 8 | 15 | 235663 | 587.18 | 1972 | 1929 | 398.1 |
| A | 0 | 50 | 191893 | 477.22 | 1972 | 1929 | 398.1 |
| A | 0 | 199 | 58013 | 140.89 | 1972 | 1929 | 398.1 |
| B | 3 | 0 | 5318941 | 14294.17 | 1963 | 1925 | 372.0 |
| B | 5 | 184 | 138186 | 366.32 | 1963 | 1925 | 372.0 |
| B | 8 | 3 | 88336 | 232.31 | 1963 | 1925 | 372.0 |
| C | 9 | 144 | 229344 | 518.74 | 1890 | 1903 | 438.4 |
| C | 10 | 65 | 18341 | 37.49 | 1890 | 1903 | 438.4 |
| C | 13 | 61 | 15533 | 31.09 | 1890 | 1903 | 438.4 |
| D | 2 | 232 | 788869 | 1709.24 | 1900 | 1852 | 460.4 |
| D | 13 | 239 | 652685 | 1413.47 | 1900 | 1852 | 460.4 |
| D | 2 | 136 | 322239 | 695.81 | 1900 | 1852 | 460.4 |
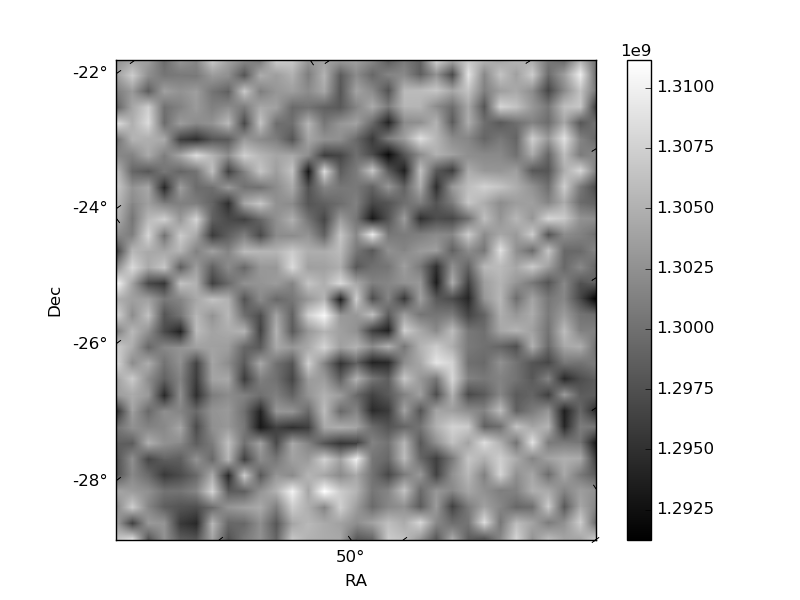
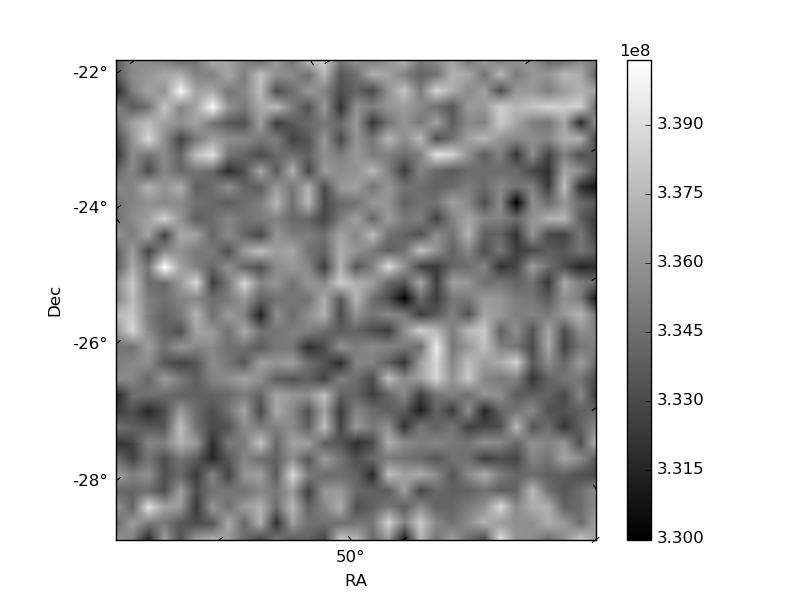
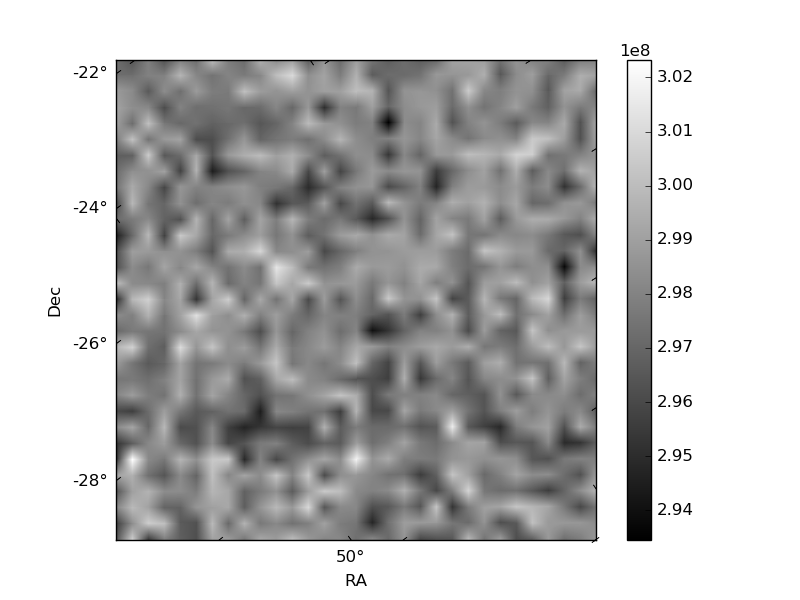
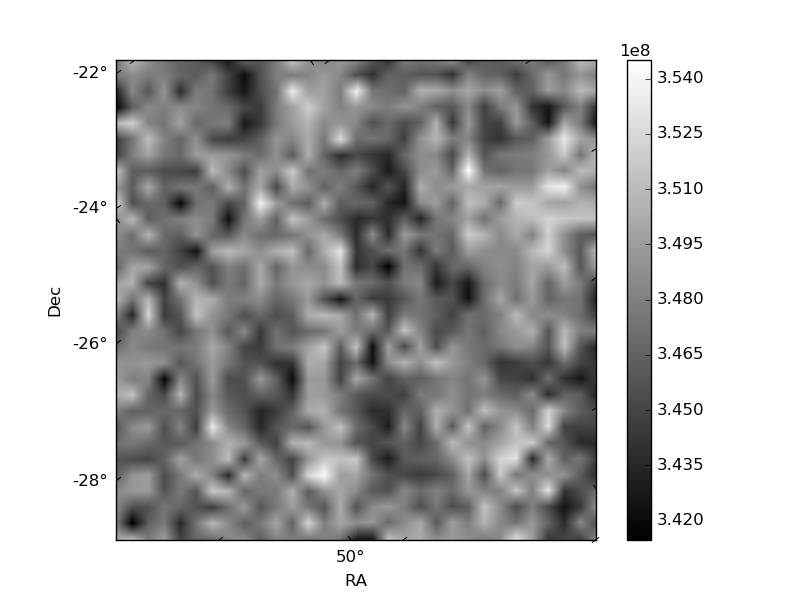
Histogram calculated using DETX and DETY for each event in the final _common_clean file
| Quadrant A | 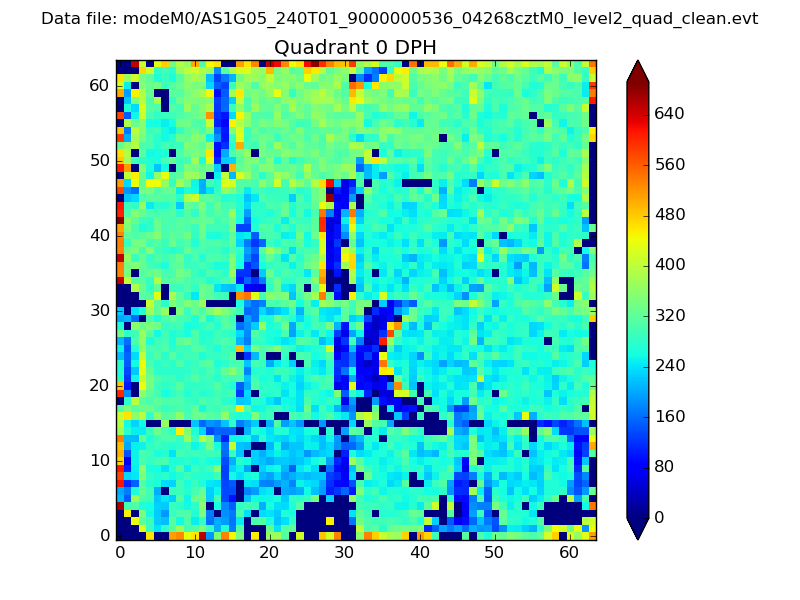 |
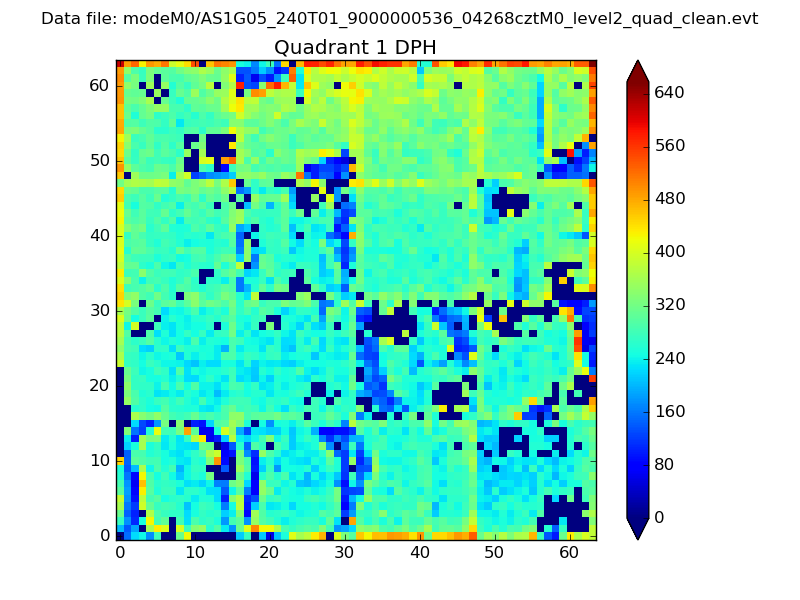 |
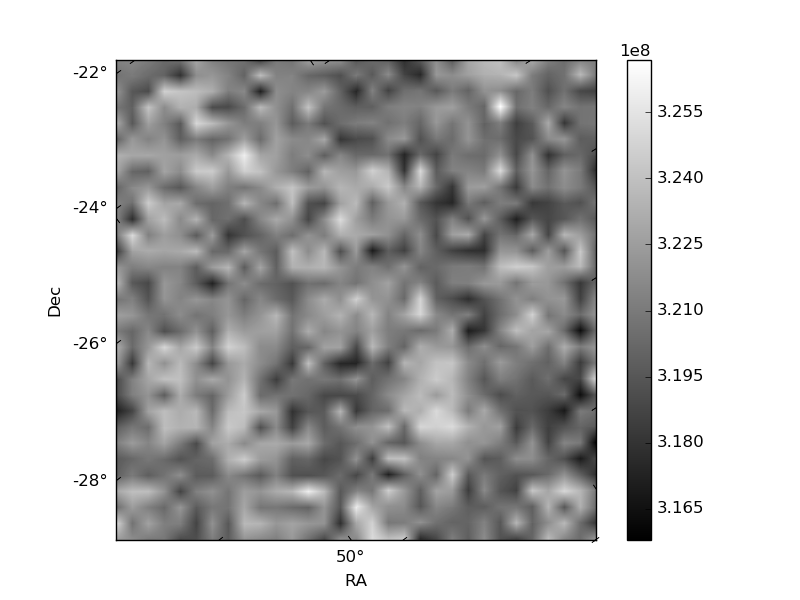
Quadrant B |
|---|---|---|---|
| Quadrant D | 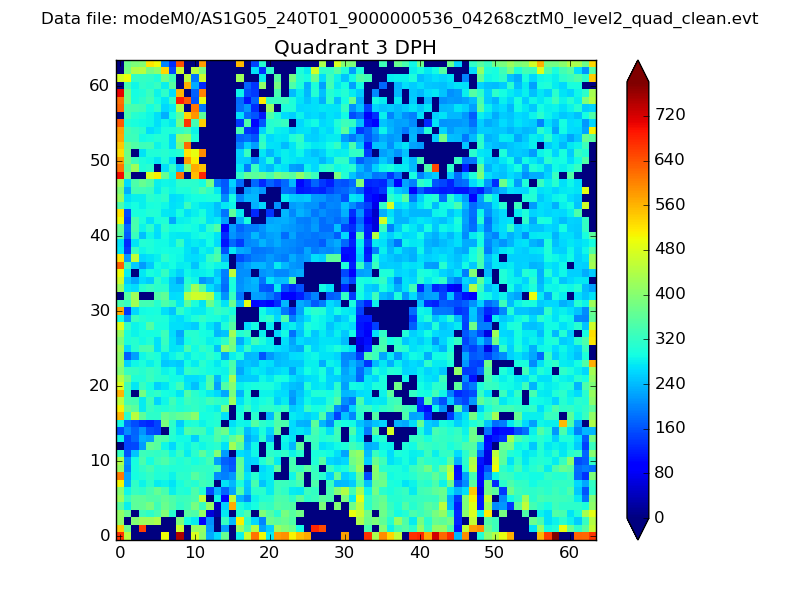 |
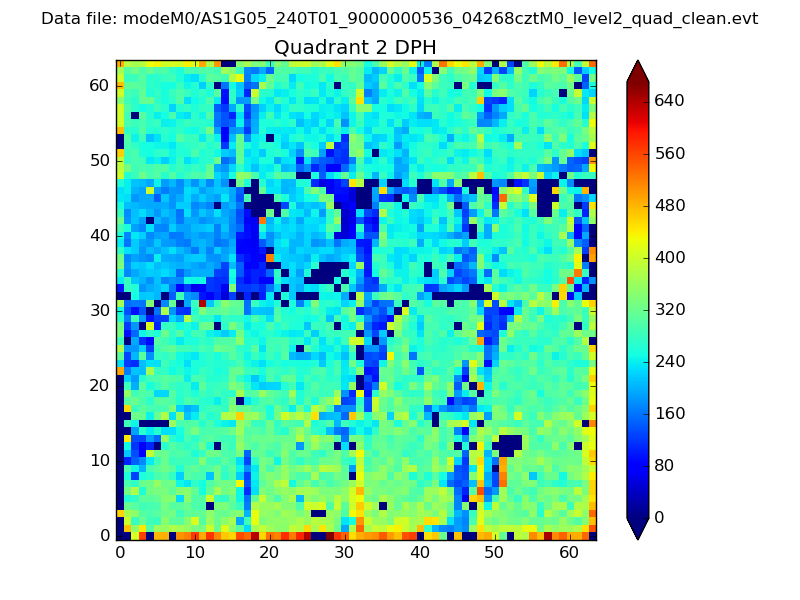 |
Quadrant C |
| Plot type | Count rate plots | Images |
|---|---|---|
| Comparison with Poisson distribution Blue bars denote a histogram of data divided into 1 sec bins. Red curve is a Poisson curve with rate = median count rate of data. |
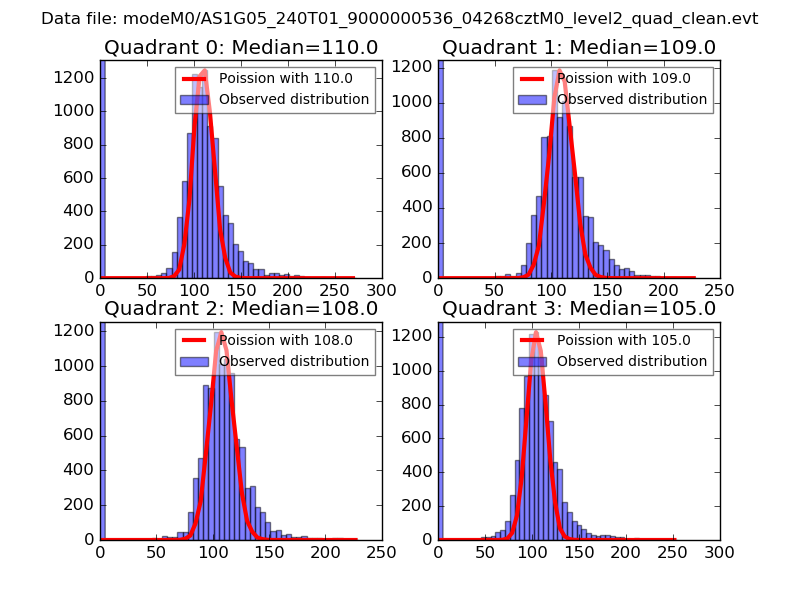 |
 |
| Quadrant-wise count rates Data is divided into 100 sec bins |
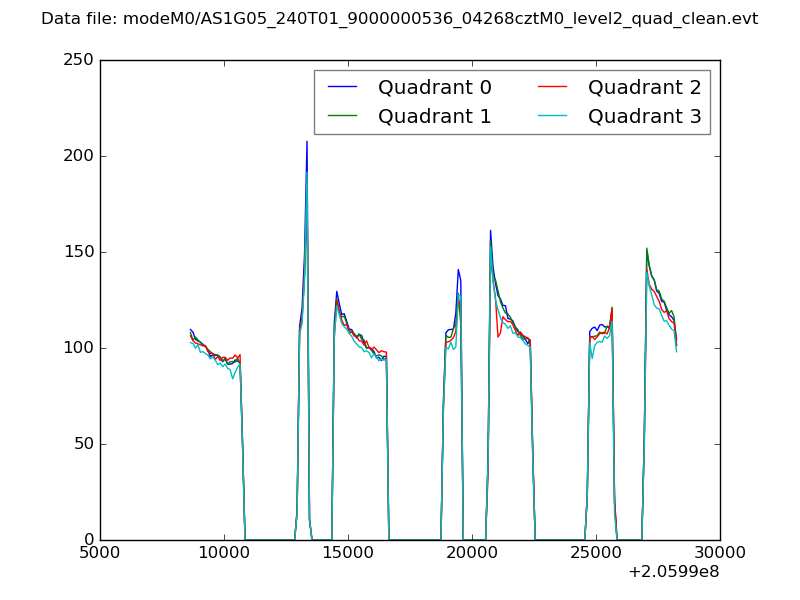 |
|
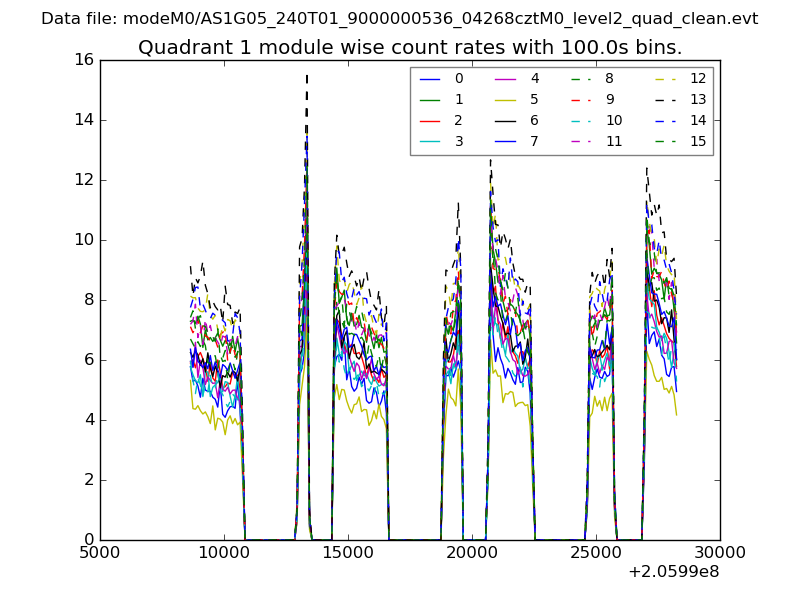
| Module-wise count rates for Quadrant A Data is divided into 100 sec bins |
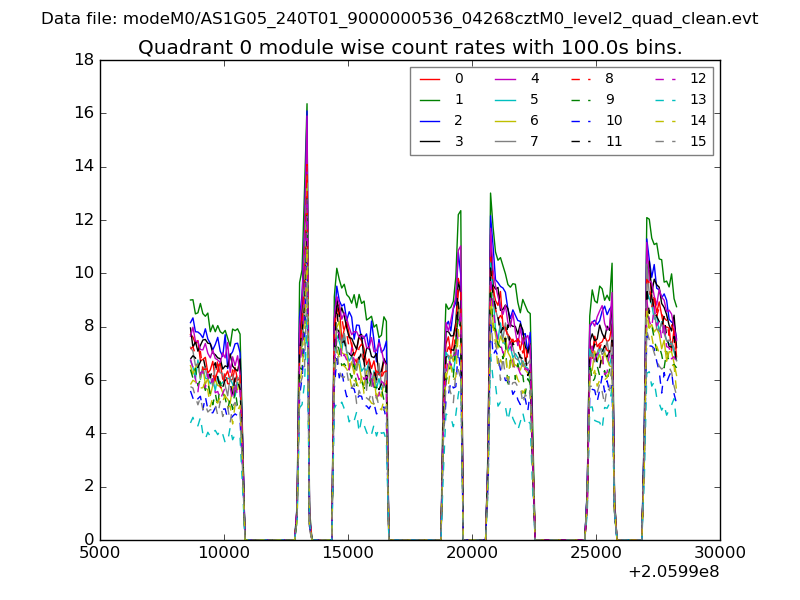 |
 |
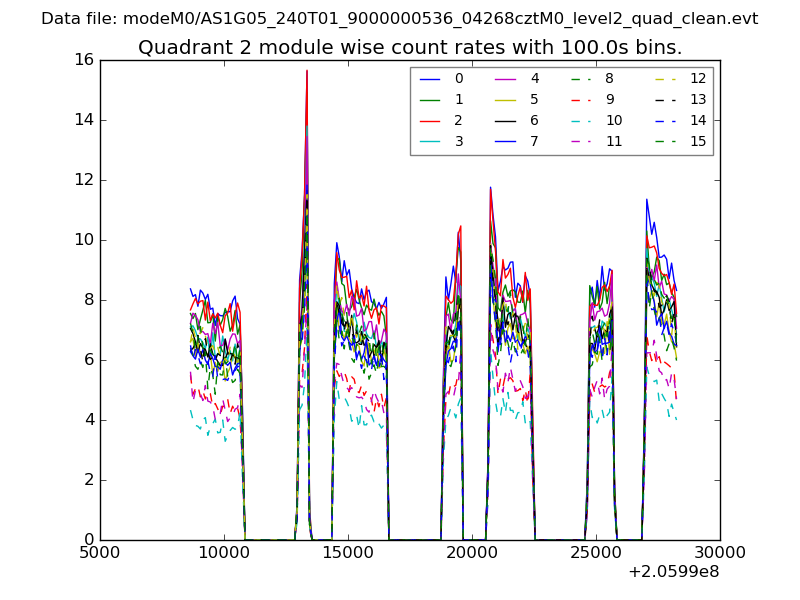
| Module-wise count rates for Quadrant B Data is divided into 100 sec bins |
 |
 |
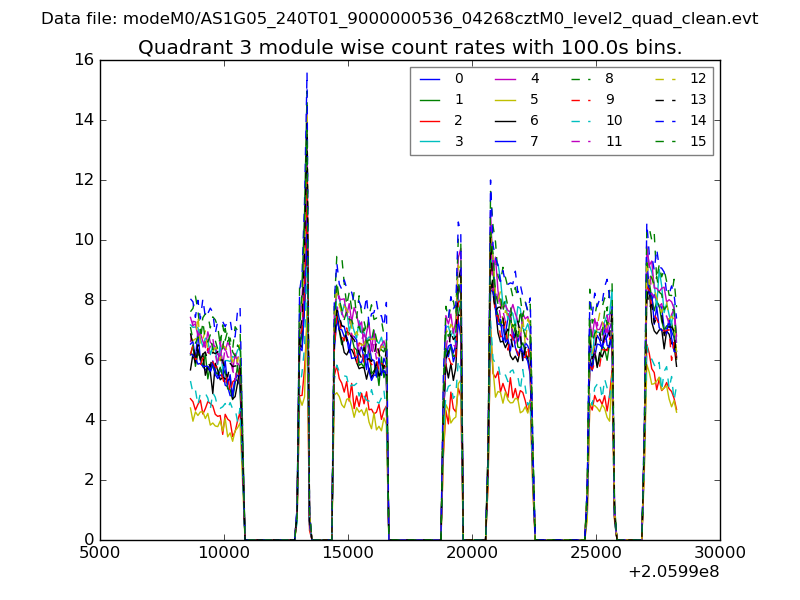
| Module-wise count rates for Quadrant C Data is divided into 100 sec bins |
 |
 |
| Module-wise count rates for Quadrant D Data is divided into 100 sec bins |
 |
 |
| Parameter | Plot |
|---|---|
| CZT HV Monitor | 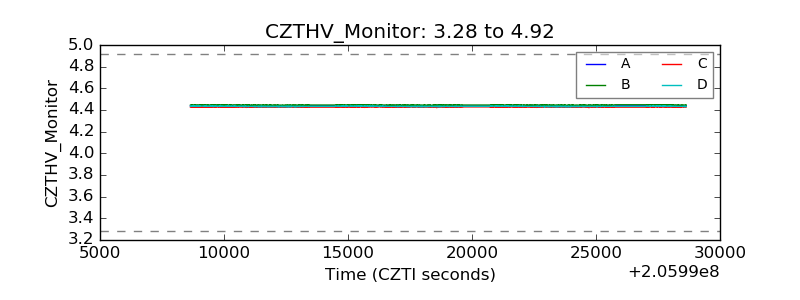 |
| D_VDD | 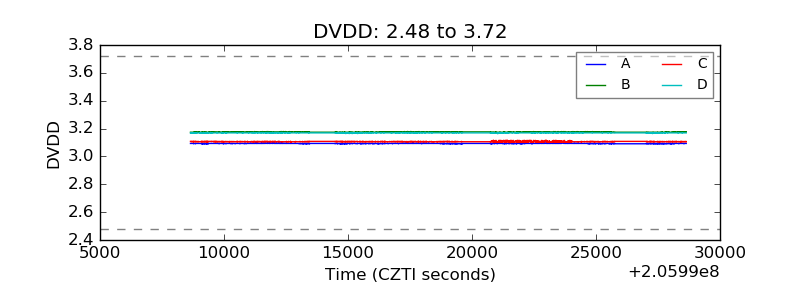 |
| Temperature 1 | 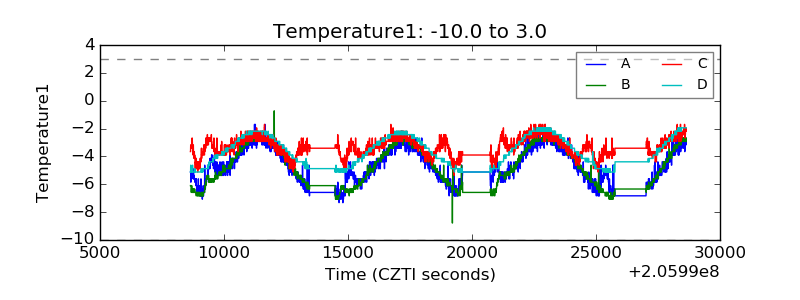 |
| Veto HV Monitor | 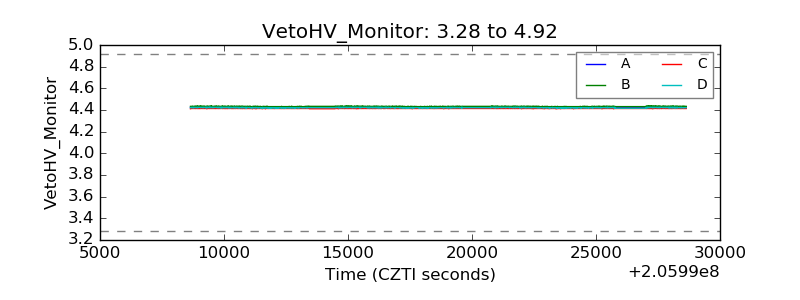 |
| Veto LLD | 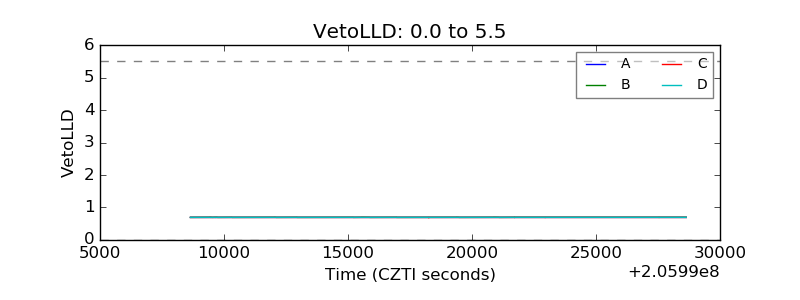 |
| Alpha Counter | 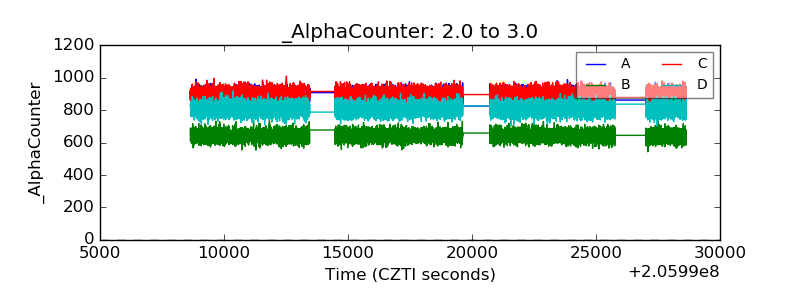 |
| _CPM_Rate | 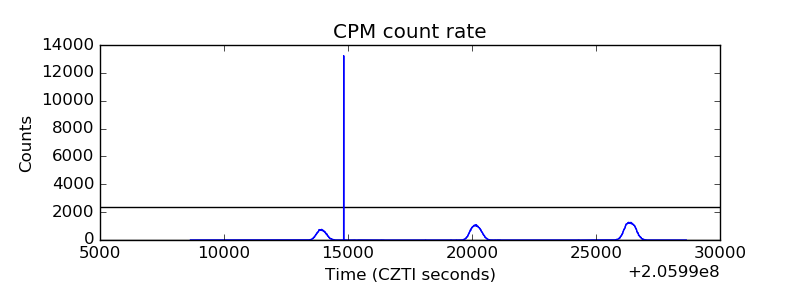 |
| CZT Counter | 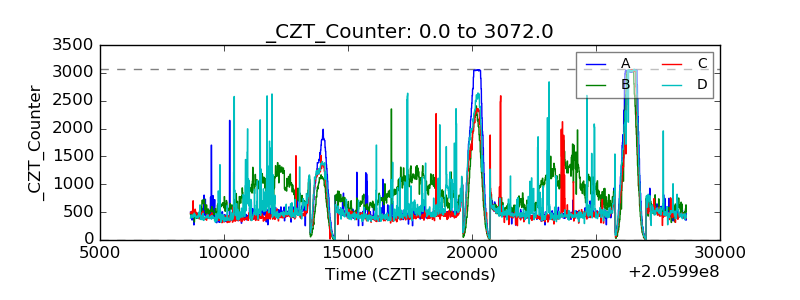 |
| +2.5 Volts monitor |  |
| +5 Volts monitor | 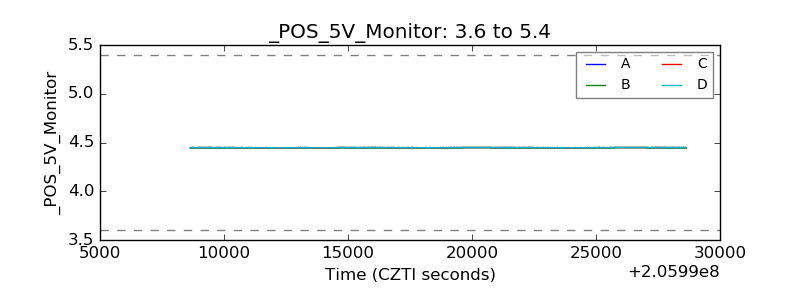 |
| _ROLL_ROT | 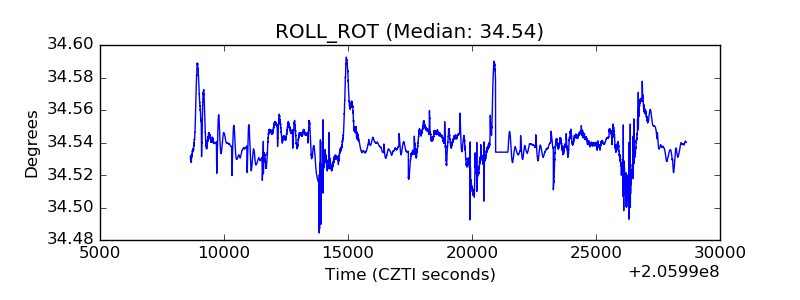 |
| _Roll_DEC | 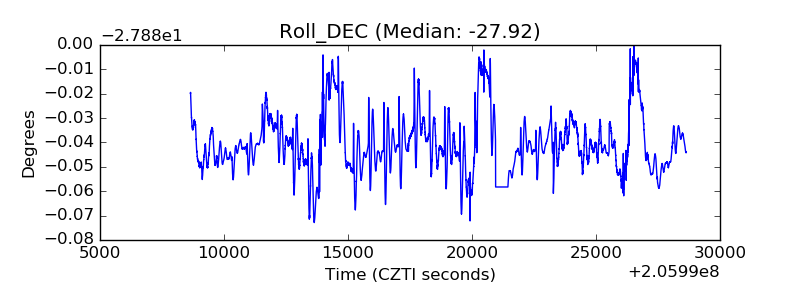 |
| _Roll_RA | 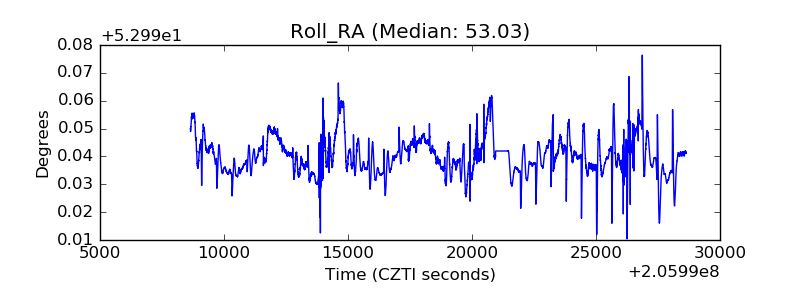 |
| Veto Counter | 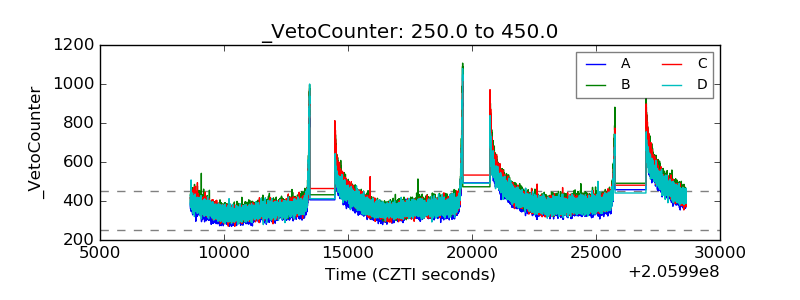 |