| Param | Original file | Final file |
|---|---|---|
| Filename | modeM0/AS1G05_240T01_9000000536_04270cztM0_level2.evt | modeM0/AS1G05_240T01_9000000536_04270cztM0_level2_quad_clean.evt |
| Size (bytes) | 520,695,360 | 55,955,520 |
| Size | 496.6 MB | 53.4 MB |
| Events in quadrant A | 3,072,275 | 331,021 |
| Events in quadrant B | 4,412,966 | 329,863 |
| Events in quadrant C | 2,811,602 | 322,238 |
| Events in quadrant D | 5,062,259 | 288,232 |
| Mode SS | |||
|---|---|---|---|
| Quadrant | BADHDUFLAG | Total packets | Discarded packets |
| A | 0 | 124 | 0 |
| B | 0 | 124 | 0 |
| C | 0 | 124 | 0 |
| D | 0 | 124 | 0 |
| Mode M9 | |||
|---|---|---|---|
| Quadrant | BADHDUFLAG | Total packets | Discarded packets |
| A | 0 | 12 | 0 |
| B | 0 | 12 | 0 |
| C | 0 | 12 | 0 |
| D | 0 | 12 | 0 |
| Mode M0 | |||
|---|---|---|---|
| Quadrant | BADHDUFLAG | Total packets | Discarded packets |
| A | 0 | 12662 | 2 |
| B | 0 | 17102 | 1 |
| C | 0 | 12410 | 1 |
| D | 0 | 19114 | 1 |
| Quadrant | Total seconds | Saturated seconds | Saturation percentage |
|---|---|---|---|
| A | 6045 | 114 | 1.885856% |
| B | 6045 | 174 | 2.878412% |
| C | 6045 | 61 | 1.009098% |
| D | 6045 | 569 | 9.412738% |
Noise dominated data is calculated using 1-second bins in cleaned event files. If a bin has >2000 counts, and if more than 50% of those come from <1% of pixels, then it is considered to be noise-dominated and hence unusable.
| Quadrant | # 1 sec bins | Bins with >0 counts | Bins with >2000 counts | High rate bins dominated by noise | Noise dominated (total time) | Noise dominated (detector-on time) | Marked lightcurve |
|---|---|---|---|---|---|---|---|
| A | 7315 | 6045 | 1 | 1 | 0.01% | 0.02% | 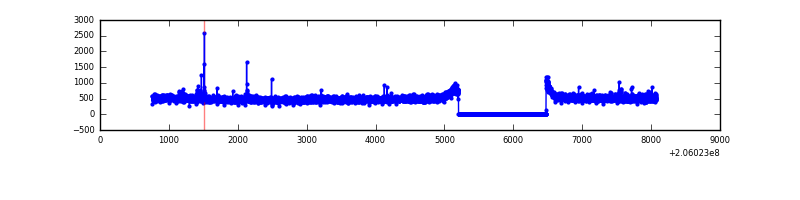 |
| B | 7315 | 6045 | 51 | 51 | 0.70% | 0.84% | 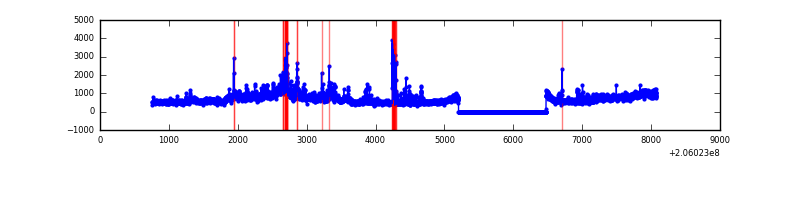 |
| C | 7315 | 6046 | 0 | 0 | 0.00% | 0.00% | 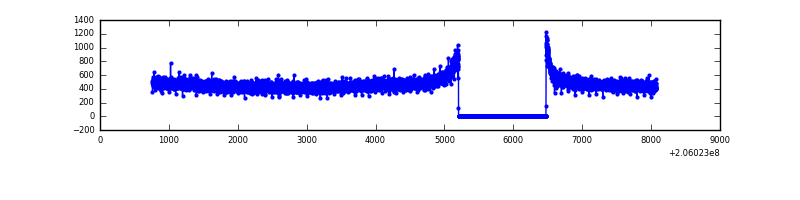 |
| D | 7315 | 6045 | 392 | 392 | 5.36% | 6.48% |  |
Top three noisy pixels from each quadrant. If the there are fewer than three noisy pixels in the level2.evt file, extra rows are filled as -1
| Pixel properties | Quadrant properties | ||||||
|---|---|---|---|---|---|---|---|
| Quadrant | DetID | PixID | Counts | Sigma | Mean | Median | Sigma |
| A | 8 | 15 | 133838 | 863.99 | 758 | 742 | 154.0 |
| A | 0 | 50 | 15521 | 95.94 | 758 | 742 | 154.0 |
| A | 12 | 194 | 8008 | 47.17 | 758 | 742 | 154.0 |
| B | 3 | 0 | 923853 | 6451.49 | 753 | 739 | 143.1 |
| B | 5 | 184 | 132551 | 921.21 | 753 | 739 | 143.1 |
| B | 8 | 3 | 103595 | 718.84 | 753 | 739 | 143.1 |
| C | 13 | 61 | 5911 | 31.17 | 718 | 721 | 166.5 |
| C | 9 | 144 | 5785 | 30.41 | 718 | 721 | 166.5 |
| C | 10 | 65 | 1994 | 7.65 | 718 | 721 | 166.5 |
| D | 1 | 52 | 1083587 | 6319.0 | 702 | 681 | 171.4 |
| D | 11 | 132 | 785543 | 4579.85 | 702 | 681 | 171.4 |
| D | 2 | 232 | 310644 | 1808.7 | 702 | 681 | 171.4 |
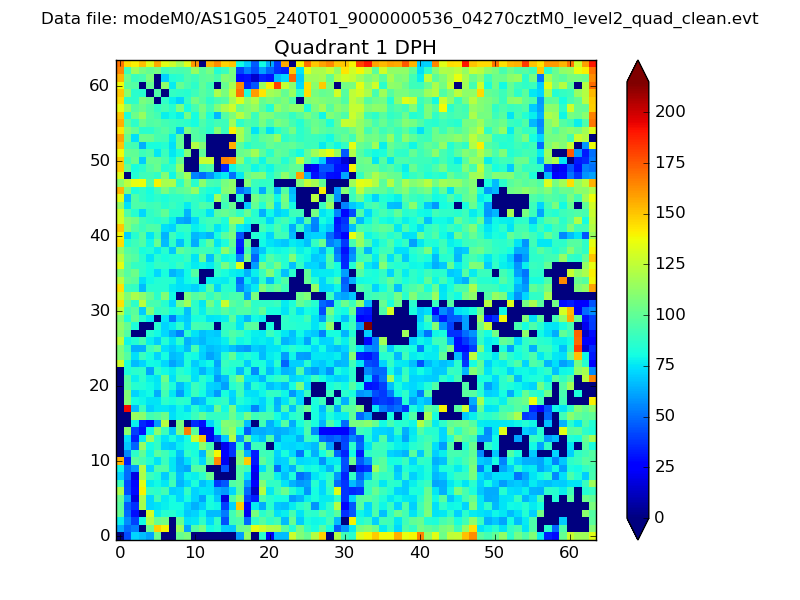
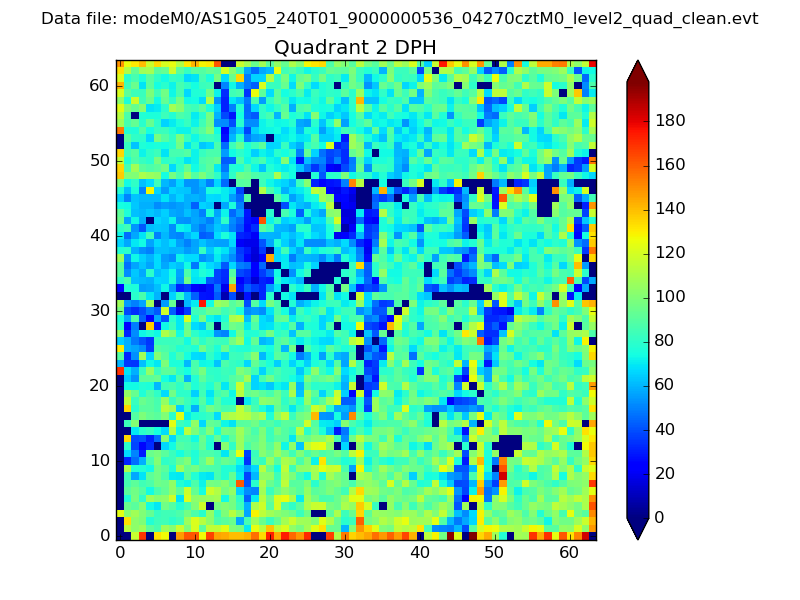
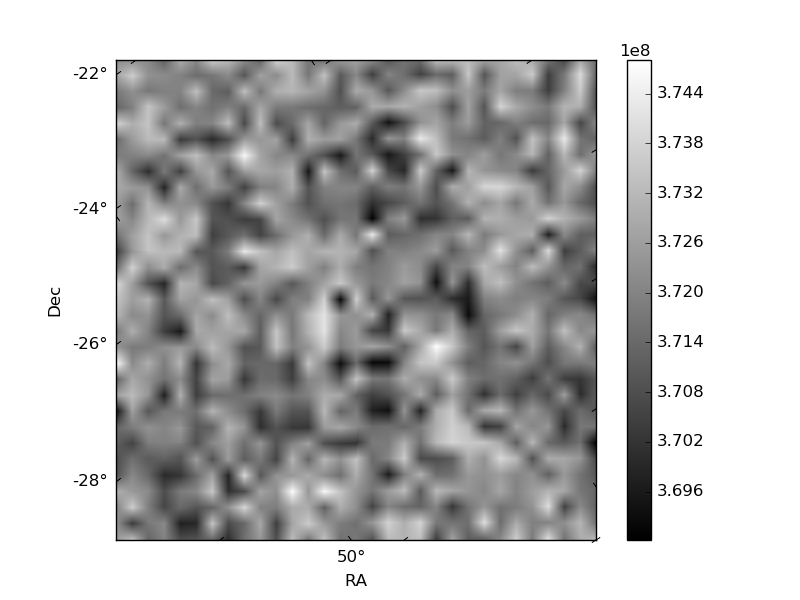
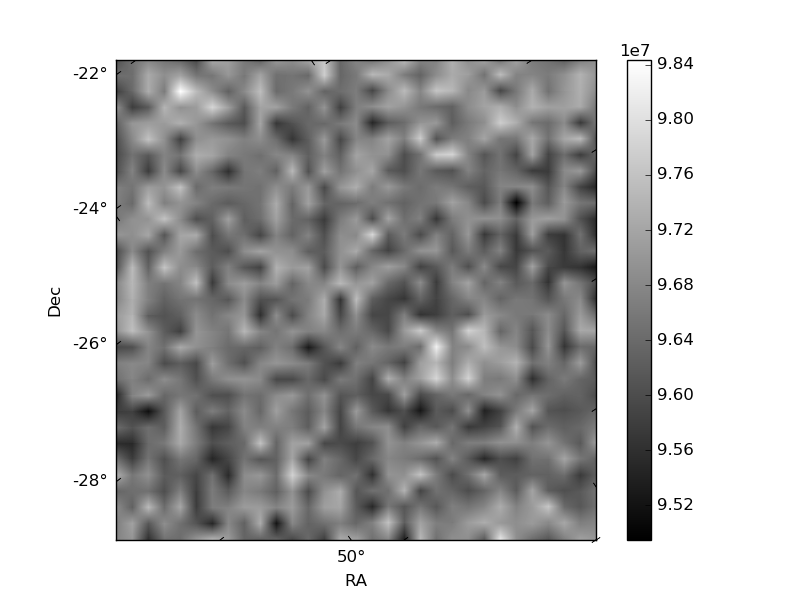
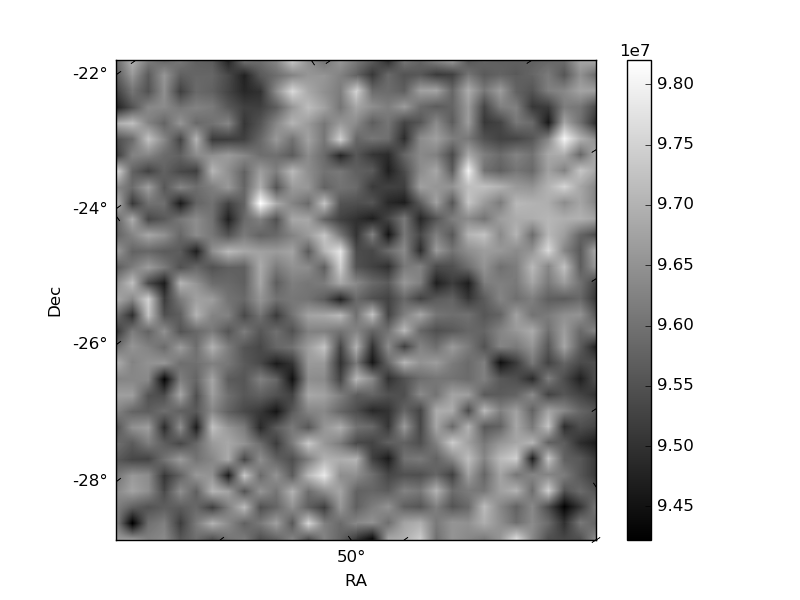
Histogram calculated using DETX and DETY for each event in the final _common_clean file
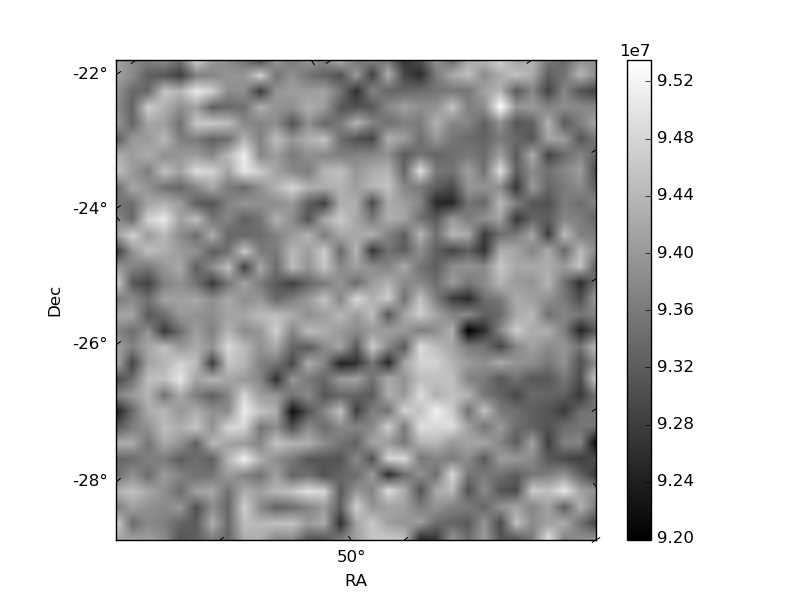
| Quadrant A | 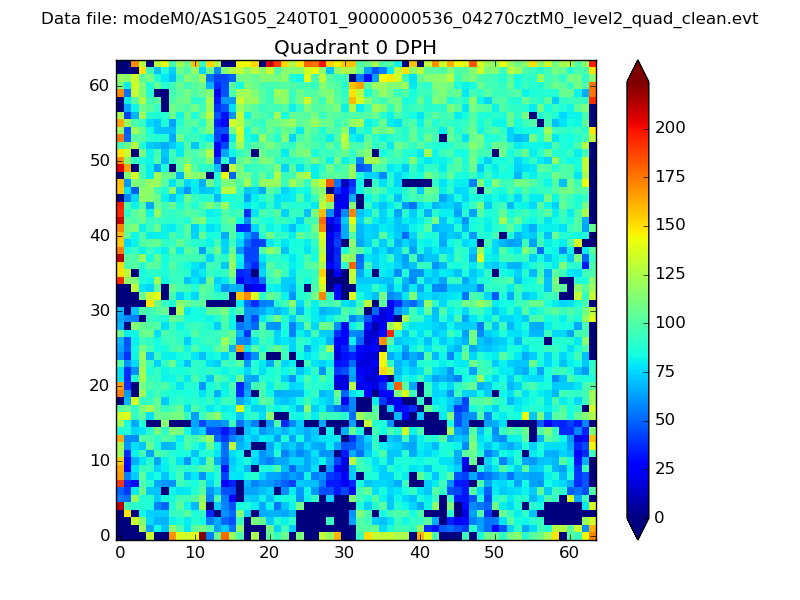 |
 |
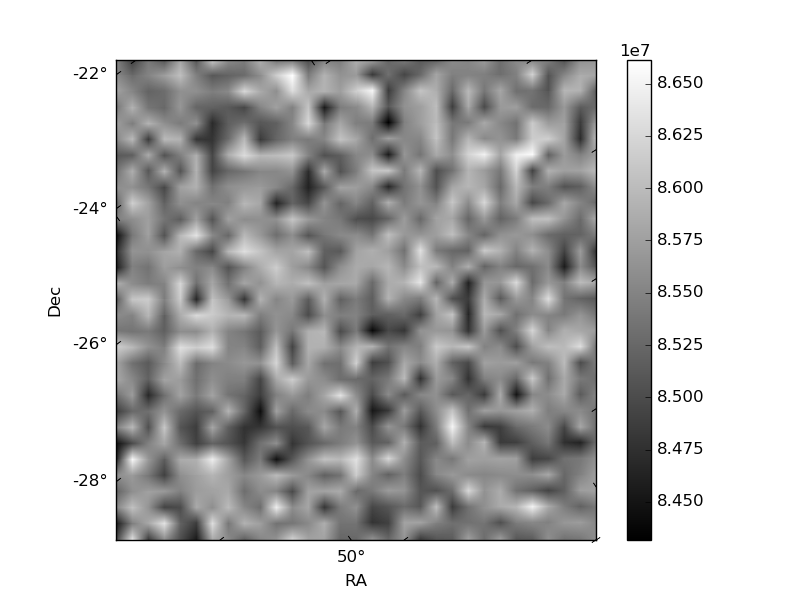
Quadrant B |
|---|---|---|---|
| Quadrant D | 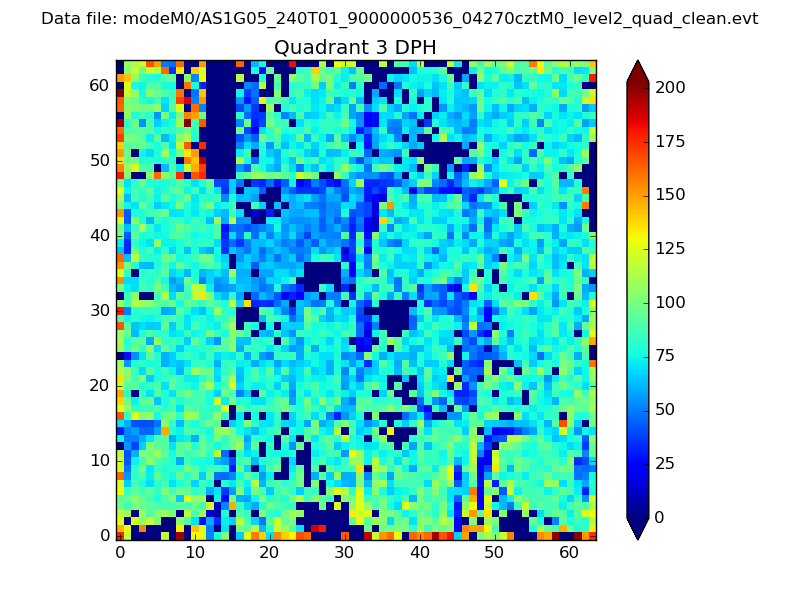 |
 |
Quadrant C |
| Plot type | Count rate plots | Images |
|---|---|---|
| Comparison with Poisson distribution Blue bars denote a histogram of data divided into 1 sec bins. Red curve is a Poisson curve with rate = median count rate of data. |
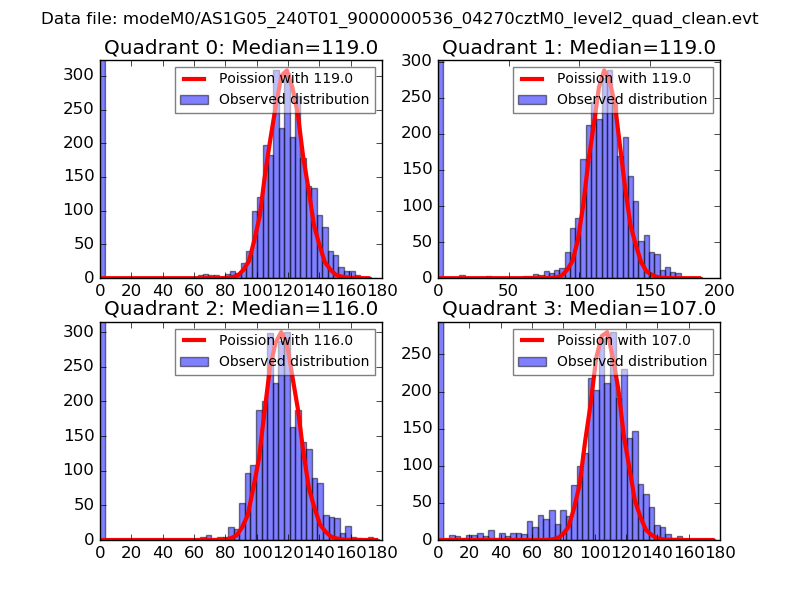 |
 |
| Quadrant-wise count rates Data is divided into 100 sec bins |
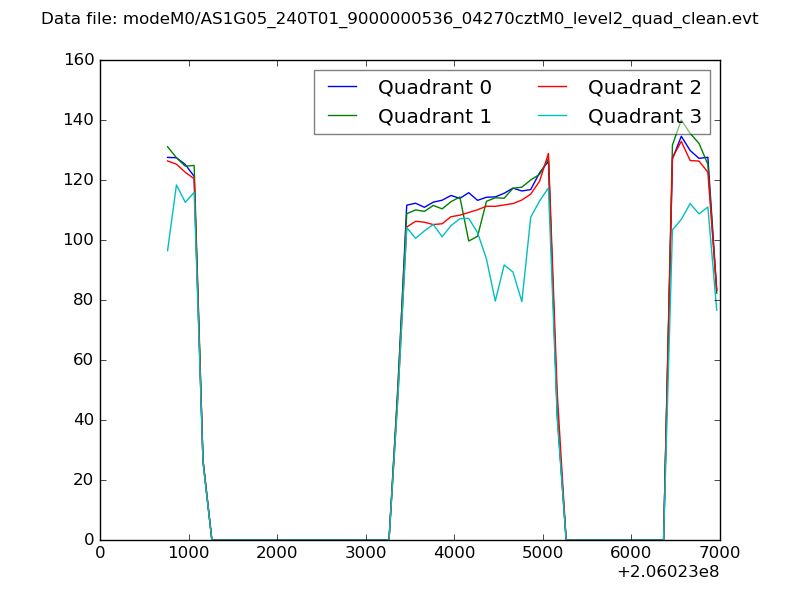 |
|
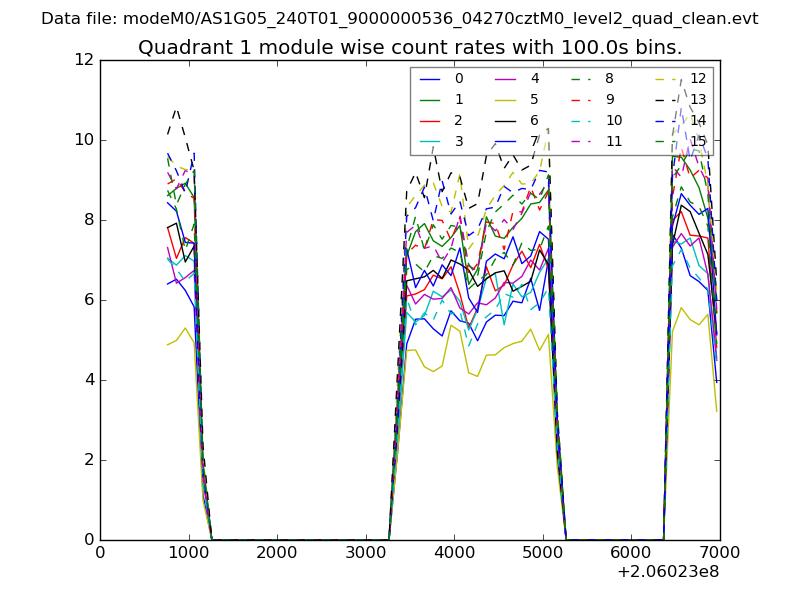
| Module-wise count rates for Quadrant A Data is divided into 100 sec bins |
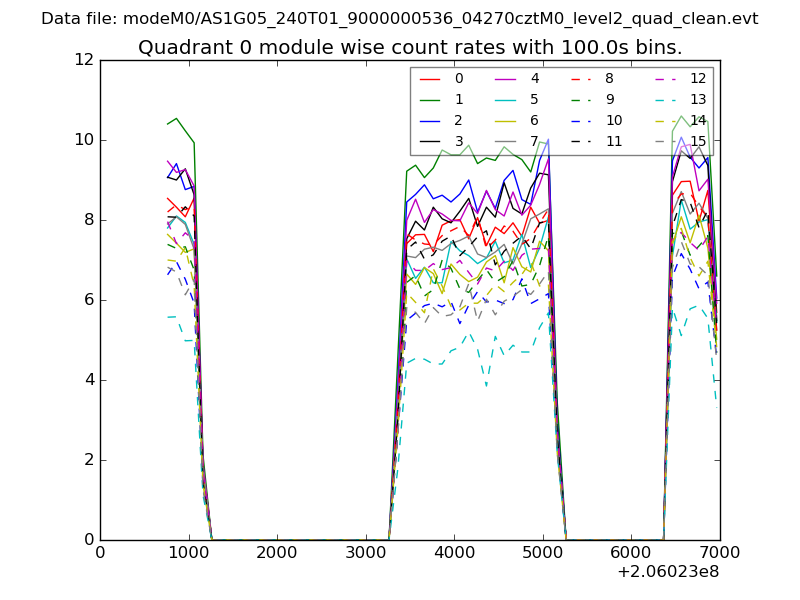 |
 |
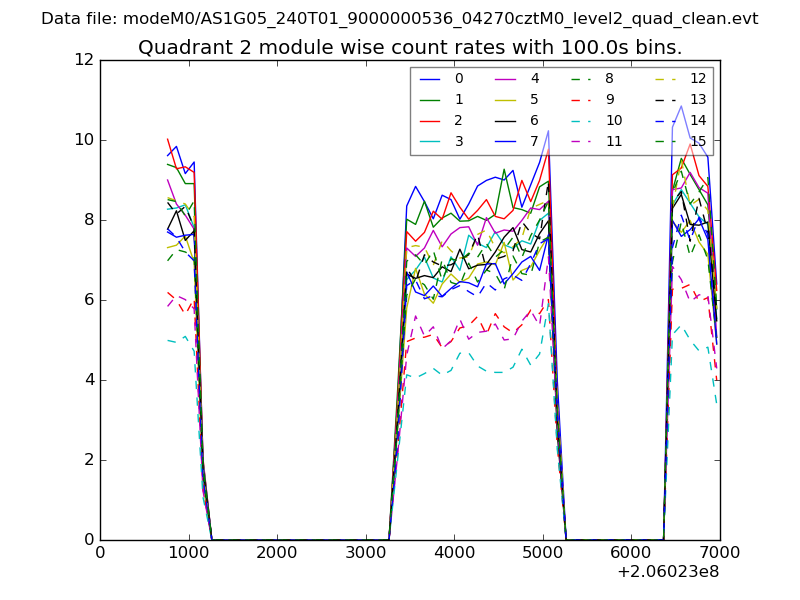
| Module-wise count rates for Quadrant B Data is divided into 100 sec bins |
 |
 |
| Module-wise count rates for Quadrant C Data is divided into 100 sec bins |
 |
 |
| Module-wise count rates for Quadrant D Data is divided into 100 sec bins |
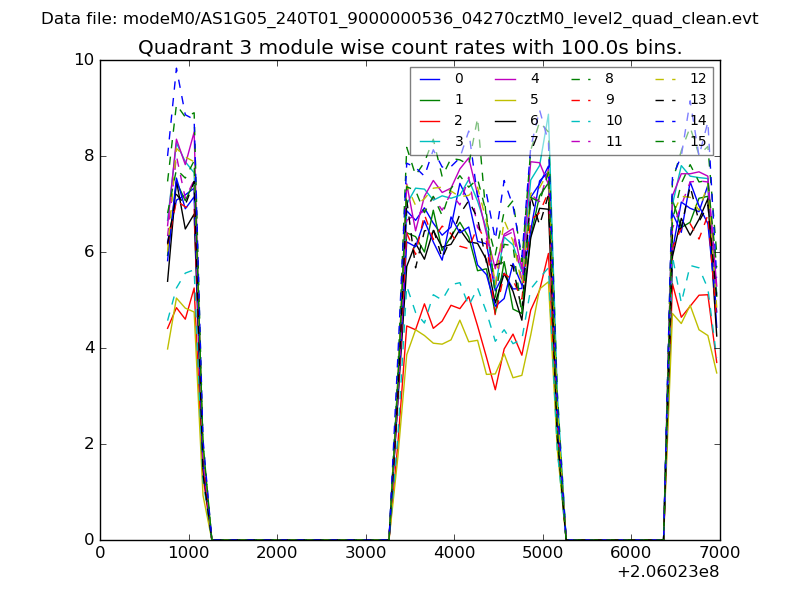 |
 |
| Parameter | Plot |
|---|---|
| CZT HV Monitor | 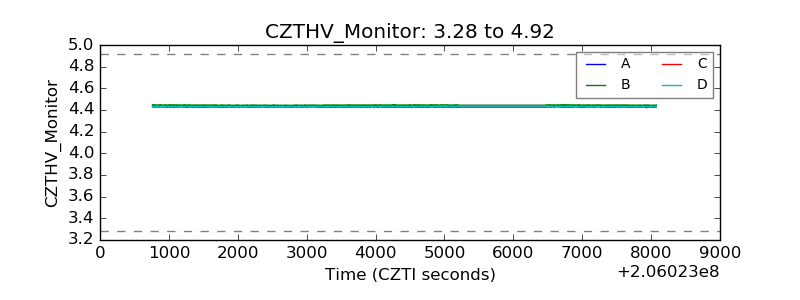 |
| D_VDD | 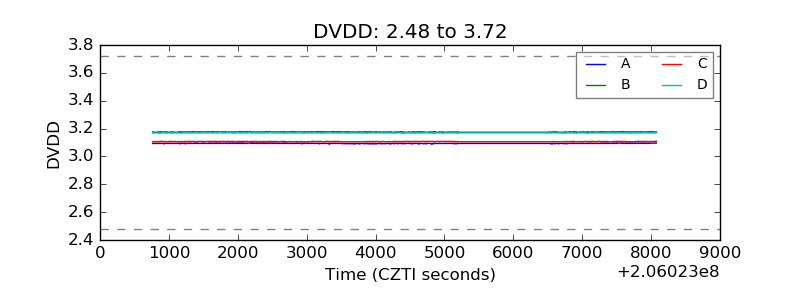 |
| Temperature 1 | 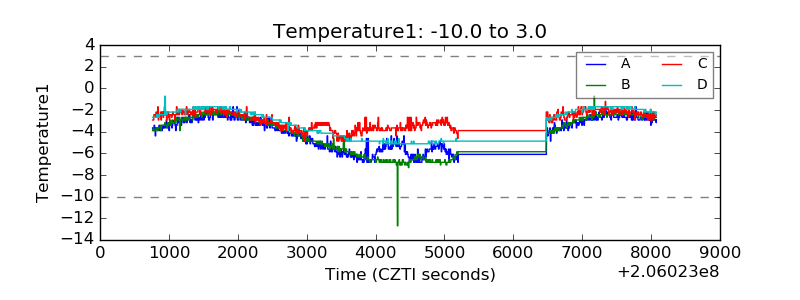 |
| Veto HV Monitor | 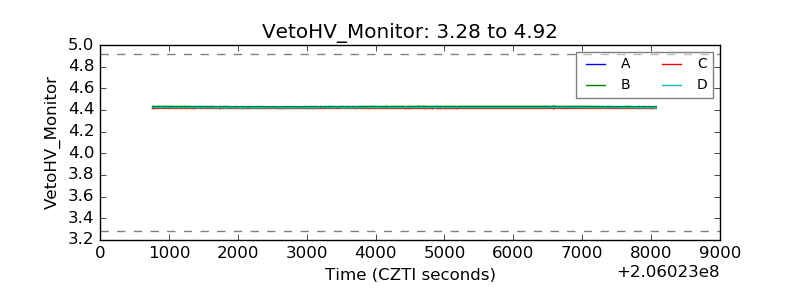 |
| Veto LLD | 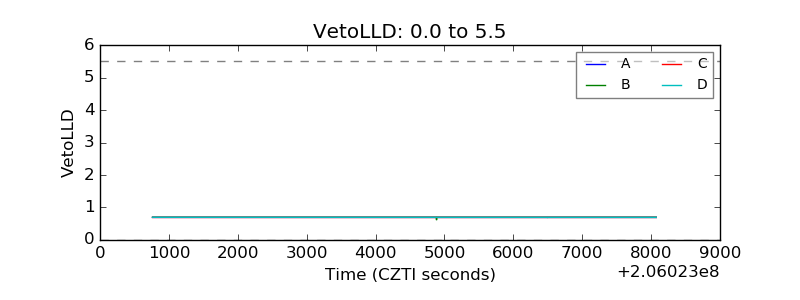 |
| Alpha Counter | 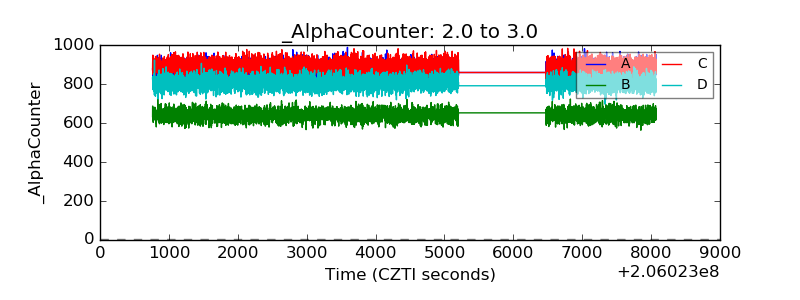 |
| _CPM_Rate | 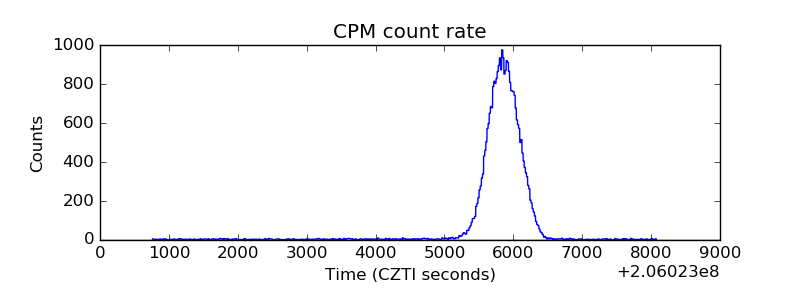 |
| CZT Counter | 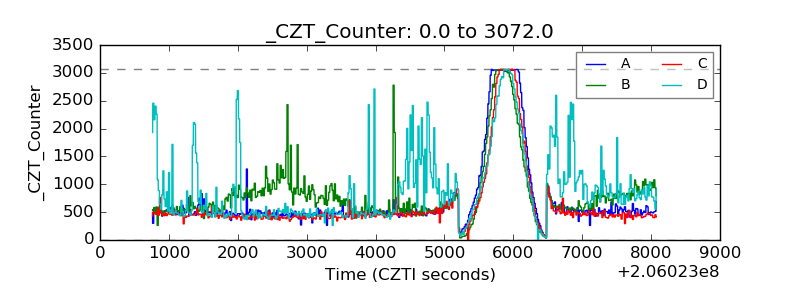 |
| +2.5 Volts monitor |  |
| +5 Volts monitor |  |
| _ROLL_ROT | 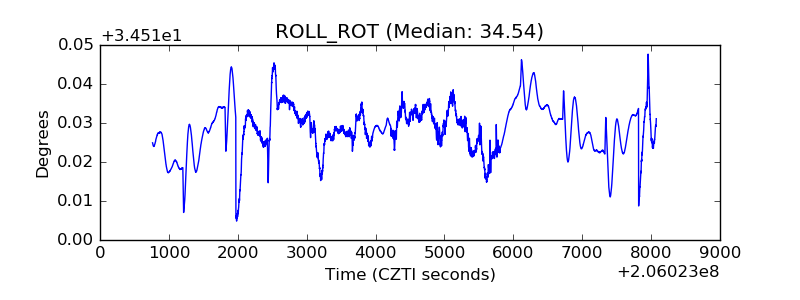 |
| _Roll_DEC | 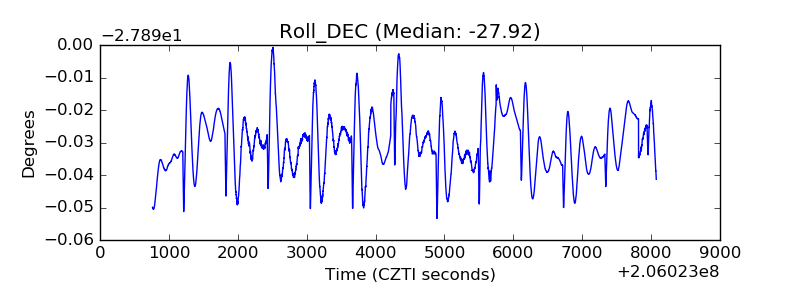 |
| _Roll_RA | 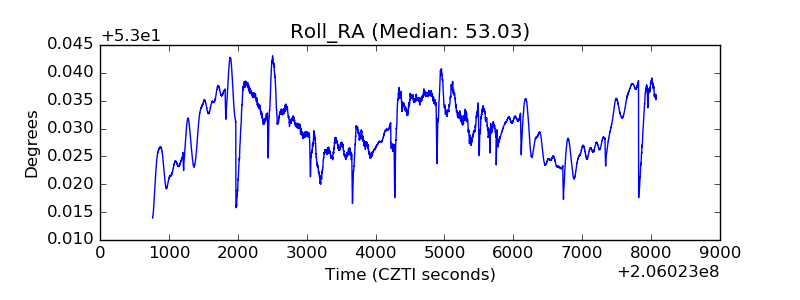 |
| Veto Counter | 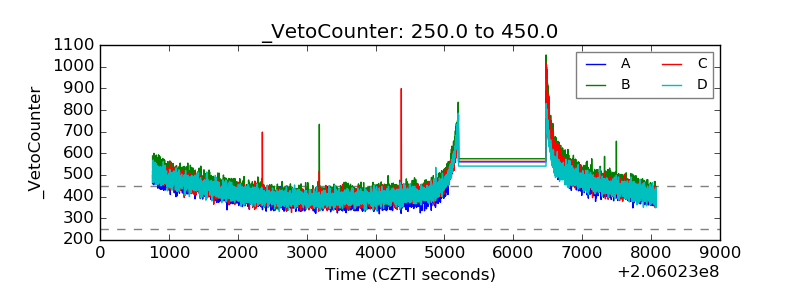 |