| Param | Original file | Final file |
|---|---|---|
| Filename | modeM0/AS1G05_240T01_9000000536_04273cztM0_level2.evt | modeM0/AS1G05_240T01_9000000536_04273cztM0_level2_quad_clean.evt |
| Size (bytes) | 647,732,160 | 65,563,200 |
| Size | 617.7 MB | 62.5 MB |
| Events in quadrant A | 3,854,629 | 379,813 |
| Events in quadrant B | 5,596,433 | 374,896 |
| Events in quadrant C | 3,288,577 | 368,052 |
| Events in quadrant D | 6,382,898 | 353,267 |
| Mode SS | |||
|---|---|---|---|
| Quadrant | BADHDUFLAG | Total packets | Discarded packets |
| A | 0 | 148 | 0 |
| B | 0 | 148 | 0 |
| C | 0 | 148 | 0 |
| D | 0 | 148 | 0 |
| Mode M9 | |||
|---|---|---|---|
| Quadrant | BADHDUFLAG | Total packets | Discarded packets |
| A | 0 | 7 | 0 |
| B | 0 | 7 | 0 |
| C | 0 | 7 | 0 |
| D | 0 | 8 | 0 |
| Mode M0 | |||
|---|---|---|---|
| Quadrant | BADHDUFLAG | Total packets | Discarded packets |
| A | 0 | 16216 | 3 |
| B | 0 | 21528 | 2 |
| C | 0 | 15126 | 2 |
| D | 0 | 24182 | 2 |
| Quadrant | Total seconds | Saturated seconds | Saturation percentage |
|---|---|---|---|
| A | 7311 | 222 | 3.036520% |
| B | 7311 | 275 | 3.761455% |
| C | 7311 | 98 | 1.340446% |
| D | 7311 | 240 | 3.282725% |
Noise dominated data is calculated using 1-second bins in cleaned event files. If a bin has >2000 counts, and if more than 50% of those come from <1% of pixels, then it is considered to be noise-dominated and hence unusable.
| Quadrant | # 1 sec bins | Bins with >0 counts | Bins with >2000 counts | High rate bins dominated by noise | Noise dominated (total time) | Noise dominated (detector-on time) | Marked lightcurve |
|---|---|---|---|---|---|---|---|
| A | 7786 | 7313 | 61 | 61 | 0.78% | 0.83% | 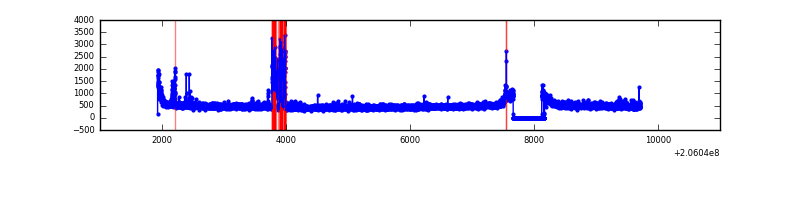 |
| B | 7786 | 7312 | 30 | 30 | 0.39% | 0.41% | 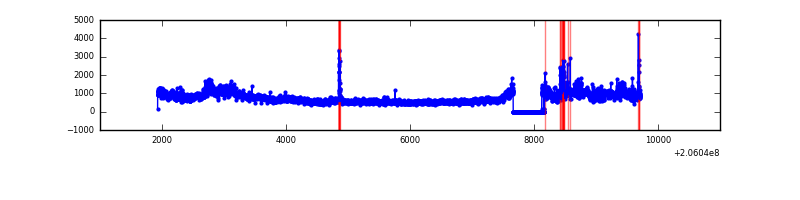 |
| C | 7786 | 7313 | 2 | 2 | 0.03% | 0.03% |  |
| D | 7786 | 7313 | 50 | 50 | 0.64% | 0.68% | 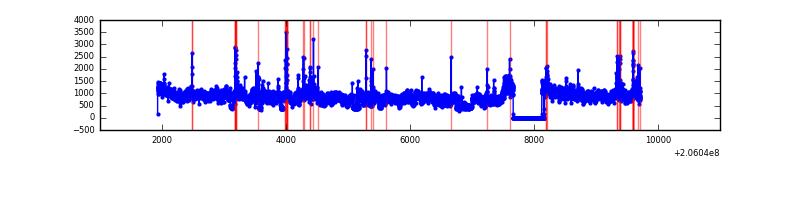 |
Top three noisy pixels from each quadrant. If the there are fewer than three noisy pixels in the level2.evt file, extra rows are filled as -1
| Pixel properties | Quadrant properties | ||||||
|---|---|---|---|---|---|---|---|
| Quadrant | DetID | PixID | Counts | Sigma | Mean | Median | Sigma |
| A | 0 | 50 | 276970 | 1536.87 | 868 | 846 | 179.7 |
| A | 8 | 15 | 185476 | 1027.62 | 868 | 846 | 179.7 |
| A | 0 | 199 | 36732 | 199.74 | 868 | 846 | 179.7 |
| B | 3 | 0 | 1868854 | 11015.96 | 870 | 851 | 169.6 |
| B | 10 | 16 | 104932 | 613.79 | 870 | 851 | 169.6 |
| B | 8 | 3 | 99989 | 584.64 | 870 | 851 | 169.6 |
| C | 10 | 65 | 12676 | 60.15 | 837 | 842 | 196.7 |
| C | 13 | 61 | 6753 | 30.05 | 837 | 842 | 196.7 |
| C | 7 | 247 | 4515 | 18.67 | 837 | 842 | 196.7 |
| D | 11 | 132 | 2856092 | 13642.65 | 834 | 808 | 209.3 |
| D | 2 | 232 | 150065 | 713.16 | 834 | 808 | 209.3 |
| D | 1 | 52 | 82140 | 388.61 | 834 | 808 | 209.3 |
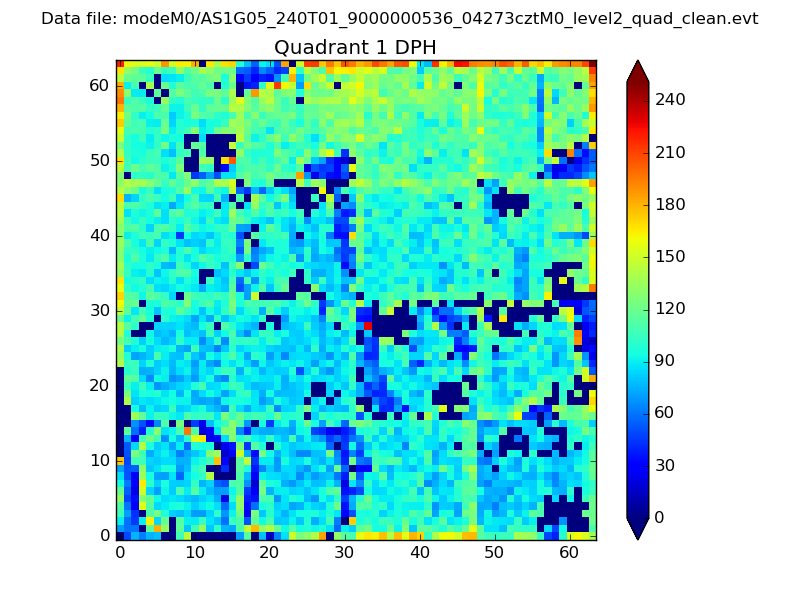
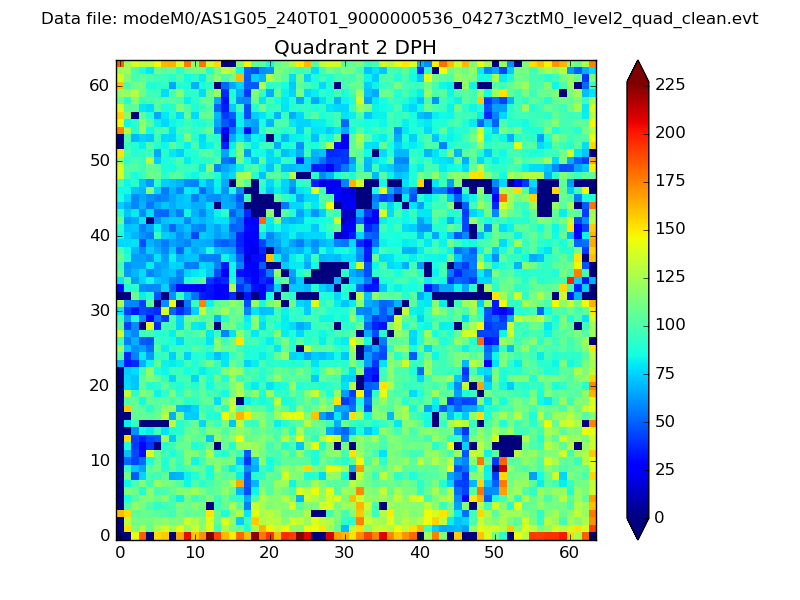
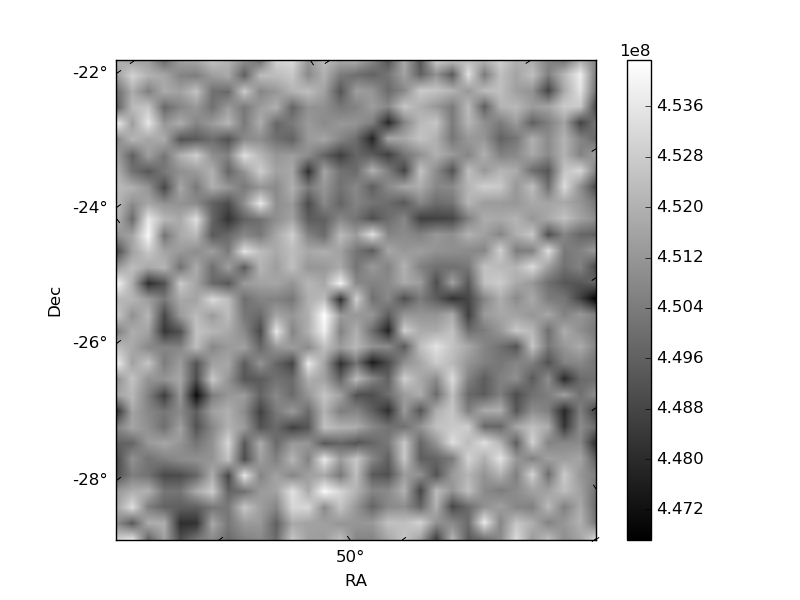
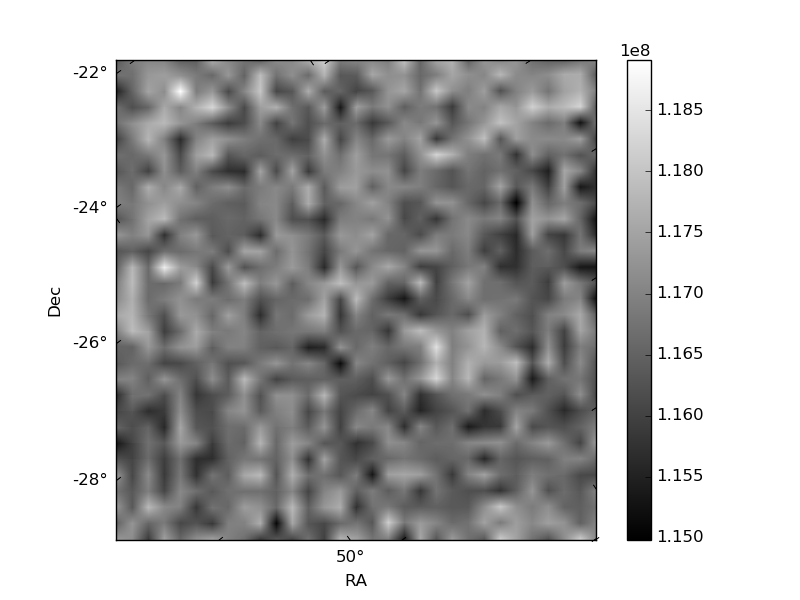
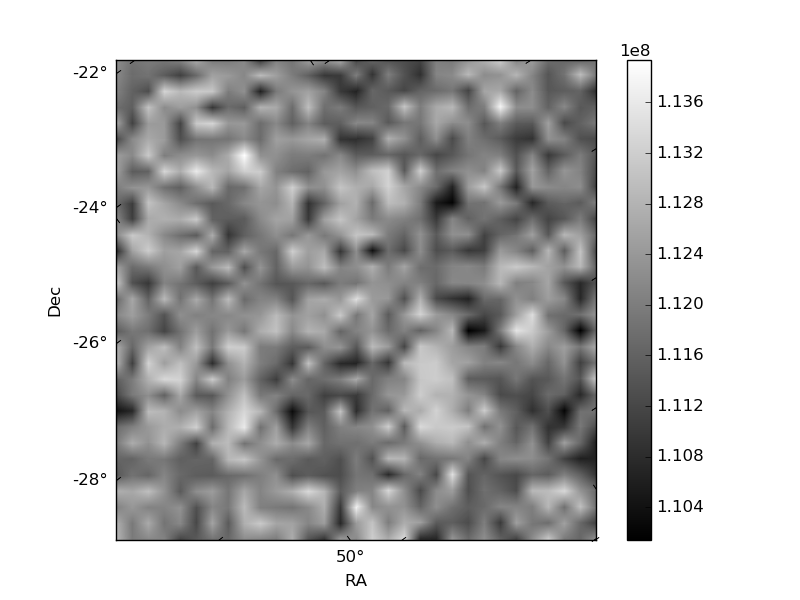
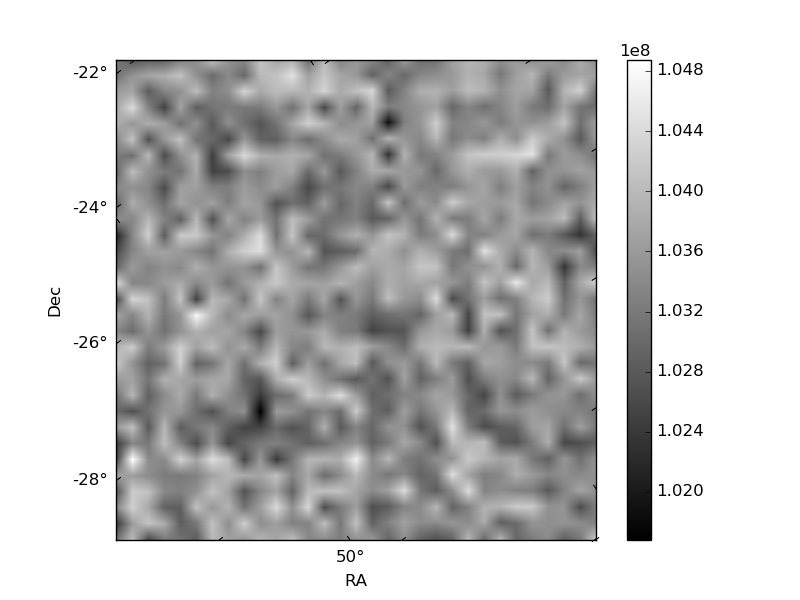
Histogram calculated using DETX and DETY for each event in the final _common_clean file
| Quadrant A | 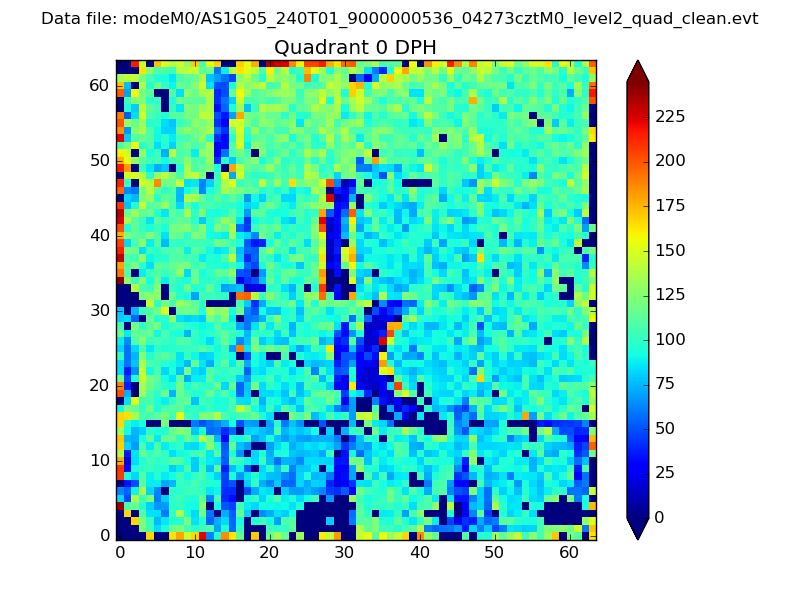 |
 |
Quadrant B |
|---|---|---|---|
| Quadrant D | 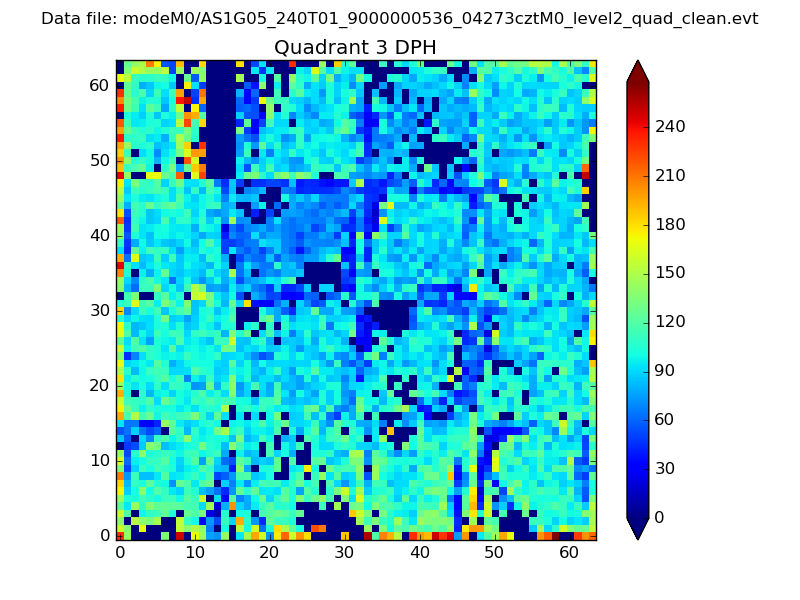 |
 |
Quadrant C |
| Plot type | Count rate plots | Images |
|---|---|---|
| Comparison with Poisson distribution Blue bars denote a histogram of data divided into 1 sec bins. Red curve is a Poisson curve with rate = median count rate of data. |
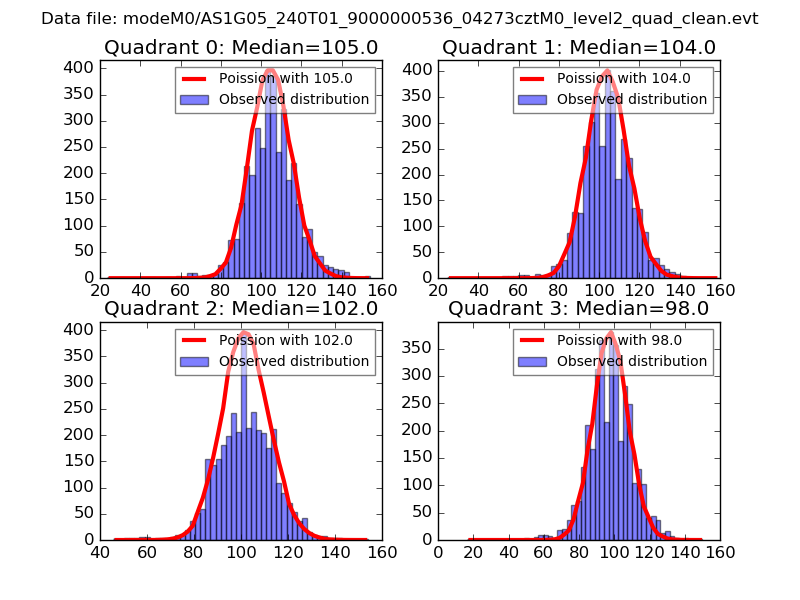 |
 |
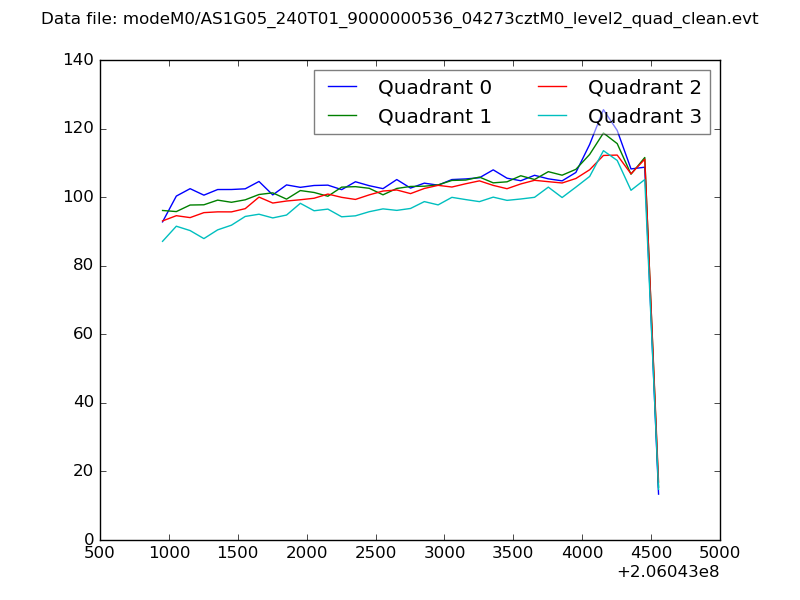
| Quadrant-wise count rates Data is divided into 100 sec bins |
 |
|
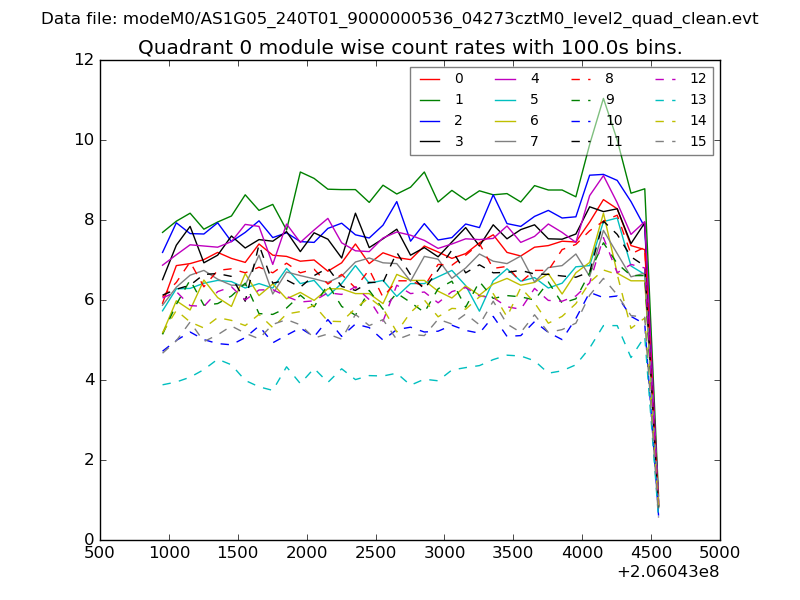
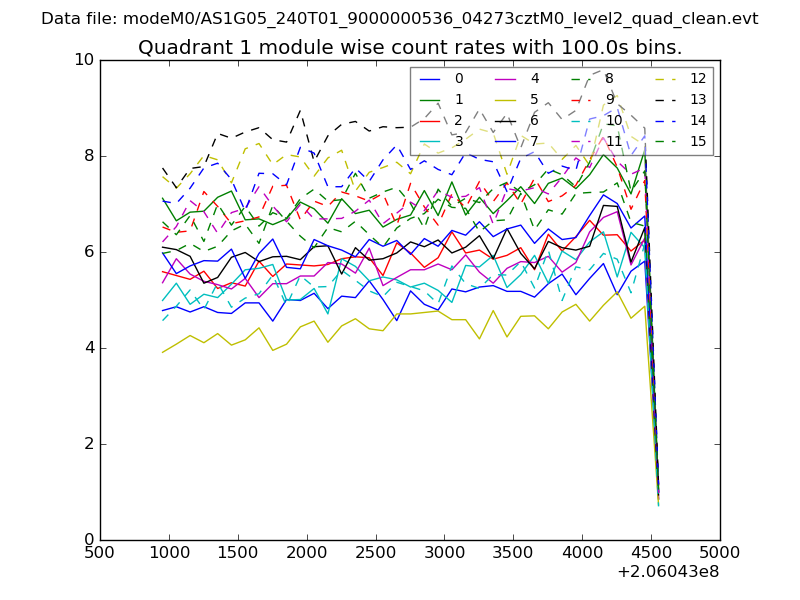
| Module-wise count rates for Quadrant A Data is divided into 100 sec bins |
 |
 |
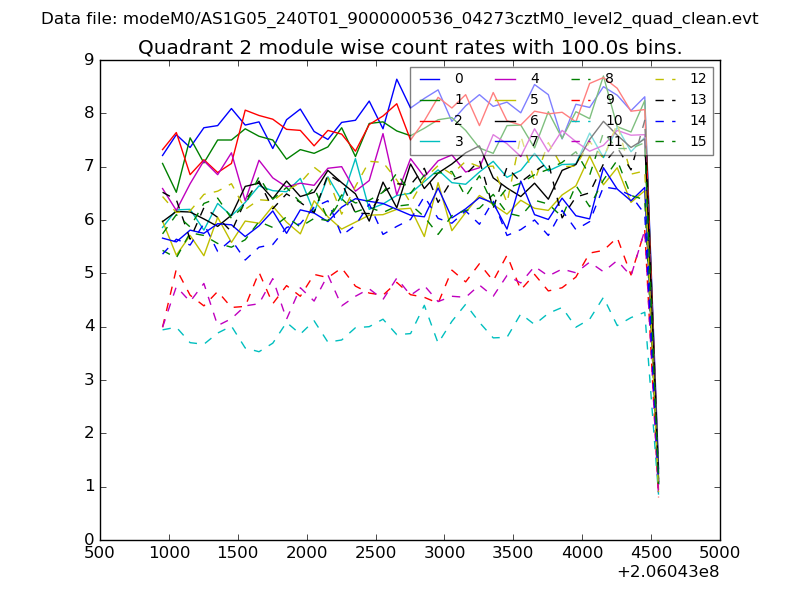
| Module-wise count rates for Quadrant B Data is divided into 100 sec bins |
 |
 |
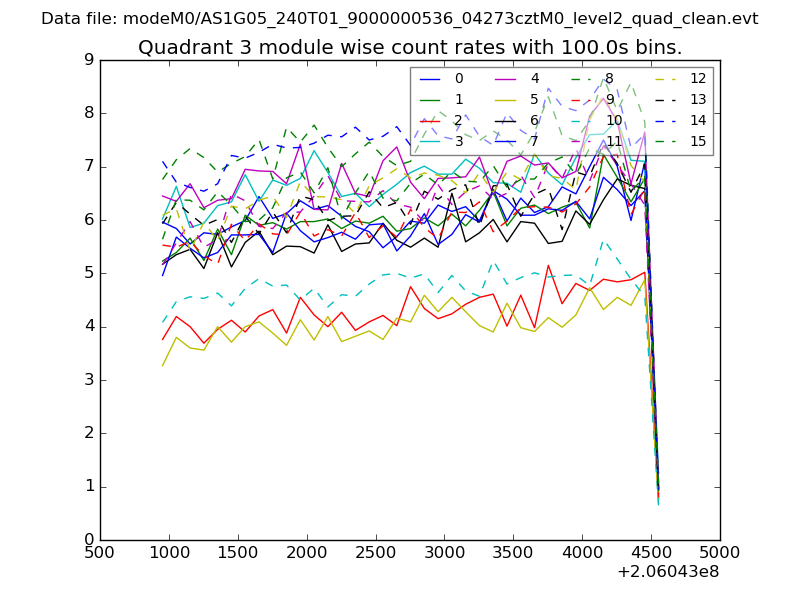
| Module-wise count rates for Quadrant C Data is divided into 100 sec bins |
 |
 |
| Module-wise count rates for Quadrant D Data is divided into 100 sec bins |
 |
 |
| Parameter | Plot |
|---|---|
| CZT HV Monitor | 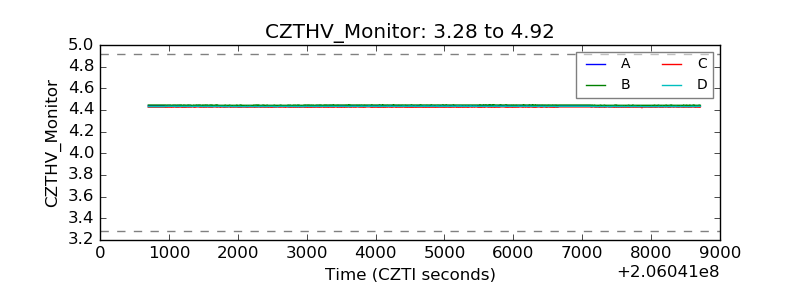 |
| D_VDD | 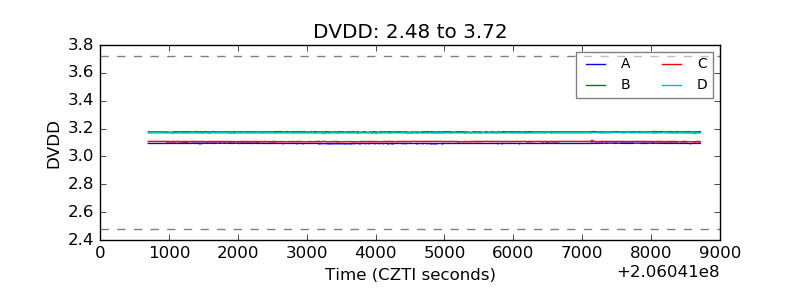 |
| Temperature 1 | 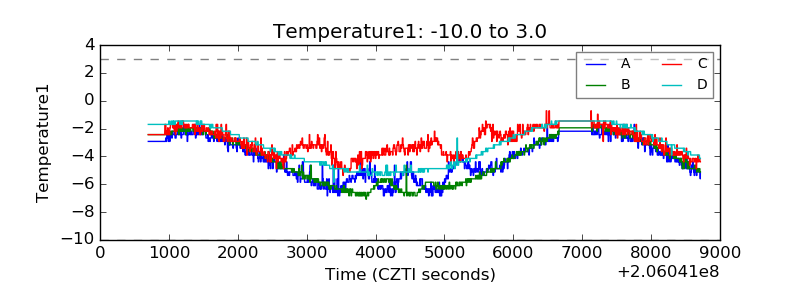 |
| Veto HV Monitor | 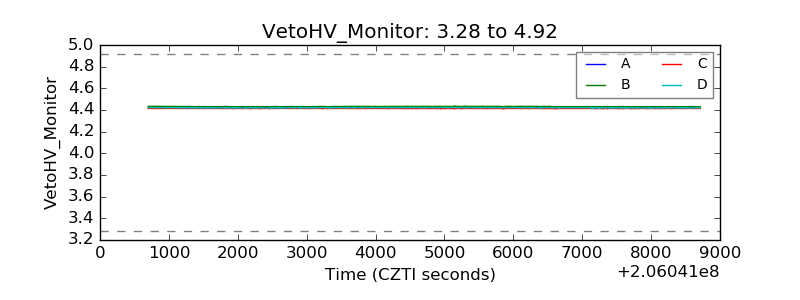 |
| Veto LLD | 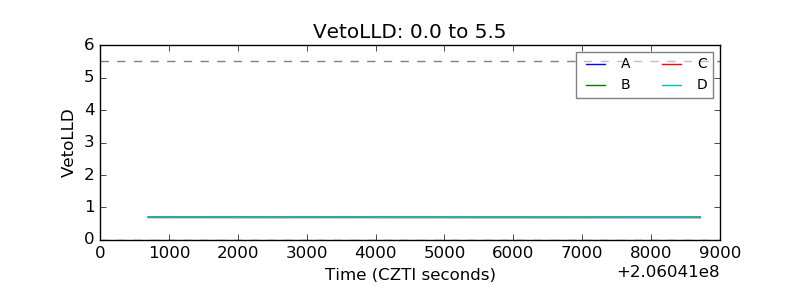 |
| Alpha Counter | 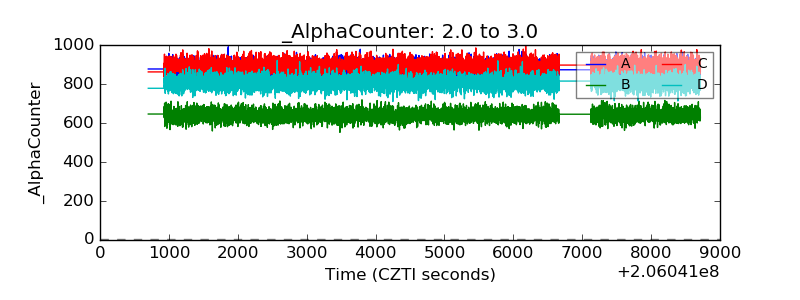 |
| _CPM_Rate | 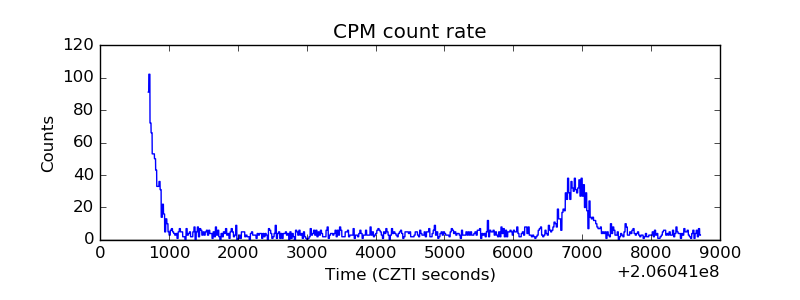 |
| CZT Counter | 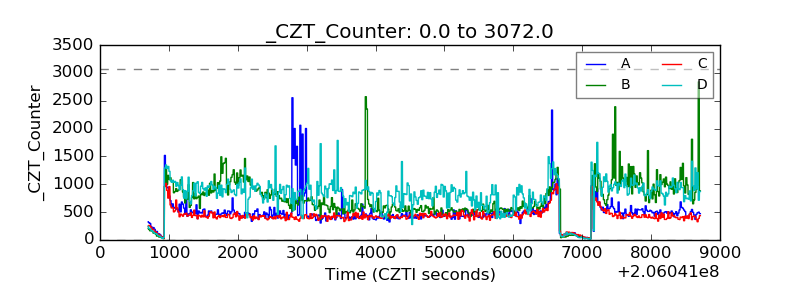 |
| +2.5 Volts monitor |  |
| +5 Volts monitor |  |
| _ROLL_ROT | 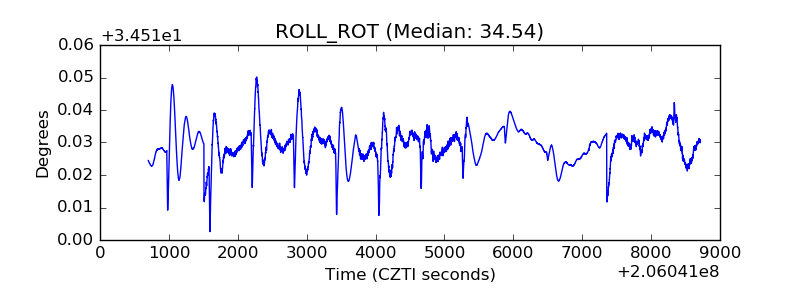 |
| _Roll_DEC | 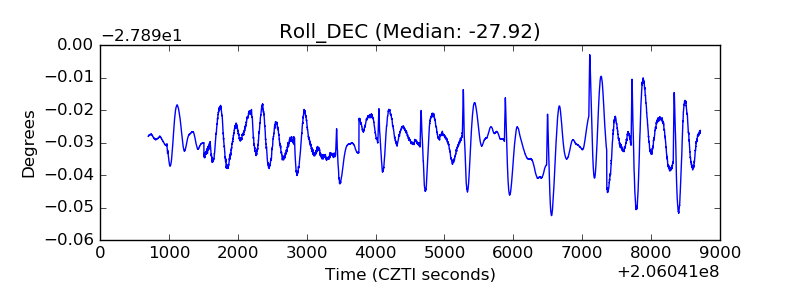 |
| _Roll_RA | 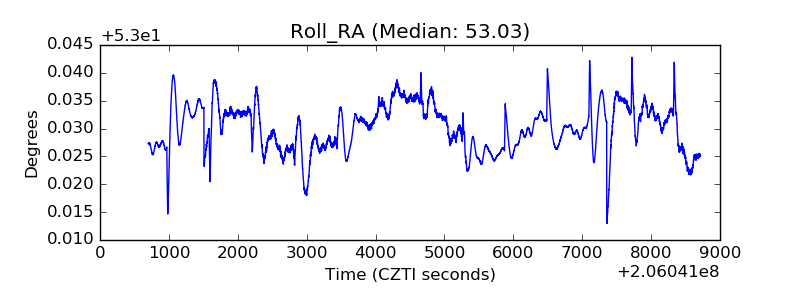 |
| Veto Counter | 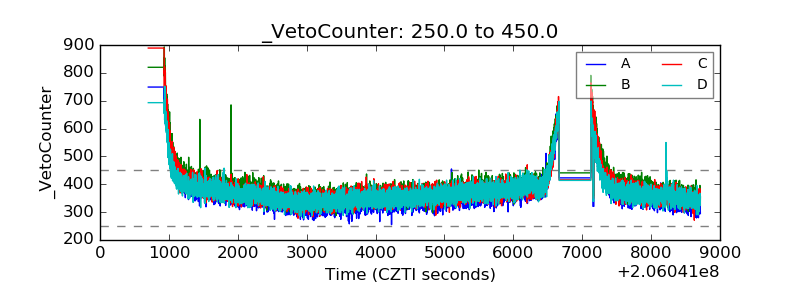 |