| Param | Original file | Final file |
|---|---|---|
| Filename | modeM0/AS1G05_240T01_9000000536_04274cztM0_level2.evt | modeM0/AS1G05_240T01_9000000536_04274cztM0_level2_quad_clean.evt |
| Size (bytes) | 613,676,160 | 67,777,920 |
| Size | 585.2 MB | 64.6 MB |
| Events in quadrant A | 3,619,179 | 399,964 |
| Events in quadrant B | 5,280,468 | 394,262 |
| Events in quadrant C | 3,176,531 | 387,495 |
| Events in quadrant D | 6,018,681 | 365,985 |
| Mode SS | |||
|---|---|---|---|
| Quadrant | BADHDUFLAG | Total packets | Discarded packets |
| A | 0 | 150 | 4 |
| B | 0 | 150 | 2 |
| C | 0 | 149 | 1 |
| D | 0 | 150 | 2 |
| Mode M9 | |||
|---|---|---|---|
| Quadrant | BADHDUFLAG | Total packets | Discarded packets |
| A | 0 | 1 | 0 |
| B | 0 | 1 | 0 |
| C | 0 | 1 | 0 |
| D | 0 | 1 | 0 |
| Mode M0 | |||
|---|---|---|---|
| Quadrant | BADHDUFLAG | Total packets | Discarded packets |
| A | 0 | 15868 | 330 |
| B | 0 | 21405 | 762 |
| C | 0 | 15133 | 327 |
| D | 0 | 23544 | 672 |
| Quadrant | Total seconds | Saturated seconds | Saturation percentage |
|---|---|---|---|
| A | 7253 | 138 | 1.902661% |
| B | 7233 | 281 | 3.884972% |
| C | 7246 | 81 | 1.117858% |
| D | 7233 | 312 | 4.313563% |
Noise dominated data is calculated using 1-second bins in cleaned event files. If a bin has >2000 counts, and if more than 50% of those come from <1% of pixels, then it is considered to be noise-dominated and hence unusable.
| Quadrant | # 1 sec bins | Bins with >0 counts | Bins with >2000 counts | High rate bins dominated by noise | Noise dominated (total time) | Noise dominated (detector-on time) | Marked lightcurve |
|---|---|---|---|---|---|---|---|
| A | 7411 | 7264 | 26 | 26 | 0.35% | 0.36% |  |
| B | 7410 | 7253 | 26 | 26 | 0.35% | 0.36% | 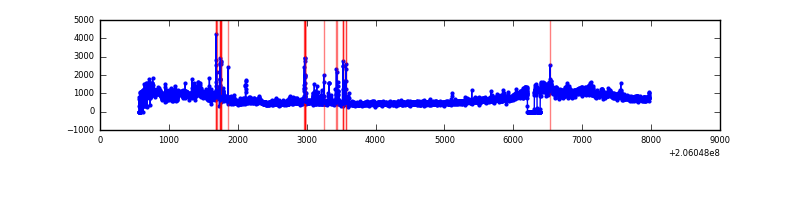 |
| C | 7422 | 7266 | 0 | 0 | 0.00% | 0.00% | 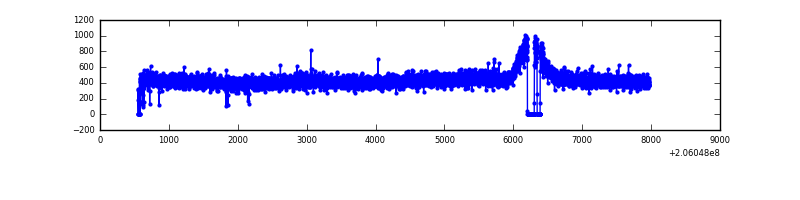 |
| D | 7418 | 7256 | 197 | 197 | 2.66% | 2.71% | 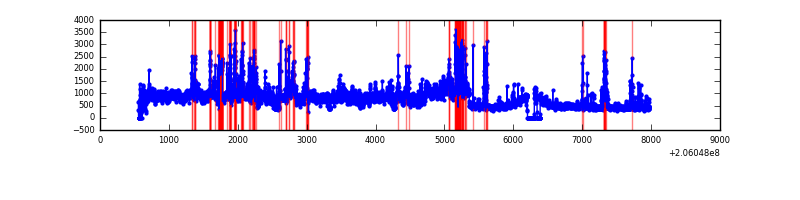 |
Top three noisy pixels from each quadrant. If the there are fewer than three noisy pixels in the level2.evt file, extra rows are filled as -1
| Pixel properties | Quadrant properties | ||||||
|---|---|---|---|---|---|---|---|
| Quadrant | DetID | PixID | Counts | Sigma | Mean | Median | Sigma |
| A | 8 | 15 | 224793 | 1279.07 | 841 | 820 | 175.1 |
| A | 0 | 50 | 125017 | 709.27 | 841 | 820 | 175.1 |
| A | 0 | 199 | 20017 | 109.63 | 841 | 820 | 175.1 |
| B | 3 | 0 | 1684376 | 10270.75 | 837 | 816 | 163.9 |
| B | 10 | 16 | 164389 | 997.9 | 837 | 816 | 163.9 |
| B | 14 | 167 | 56873 | 341.98 | 837 | 816 | 163.9 |
| C | 13 | 61 | 6796 | 31.36 | 811 | 814 | 190.7 |
| C | 10 | 65 | 6100 | 27.71 | 811 | 814 | 190.7 |
| C | 7 | 247 | 3263 | 12.84 | 811 | 814 | 190.7 |
| D | 11 | 132 | 1972237 | 10069.69 | 796 | 769 | 195.8 |
| D | 2 | 232 | 327777 | 1670.26 | 796 | 769 | 195.8 |
| D | 1 | 52 | 223363 | 1136.95 | 796 | 769 | 195.8 |
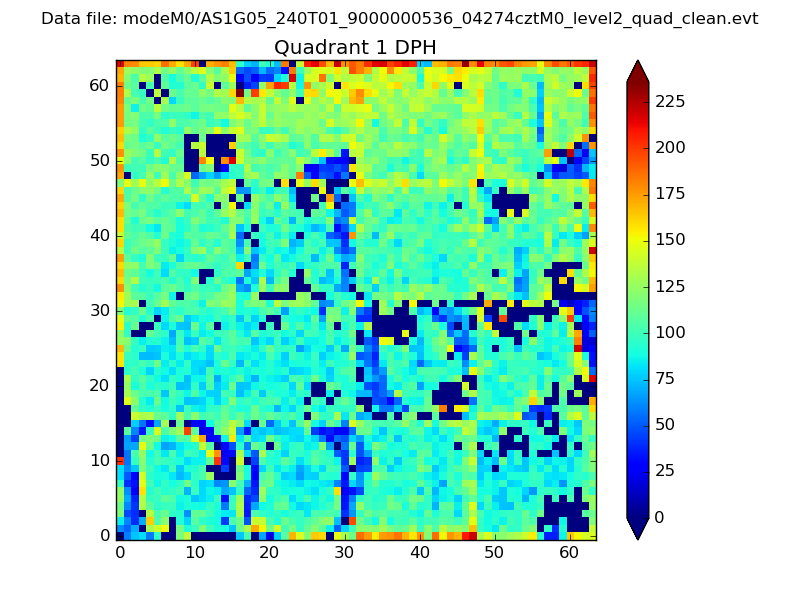
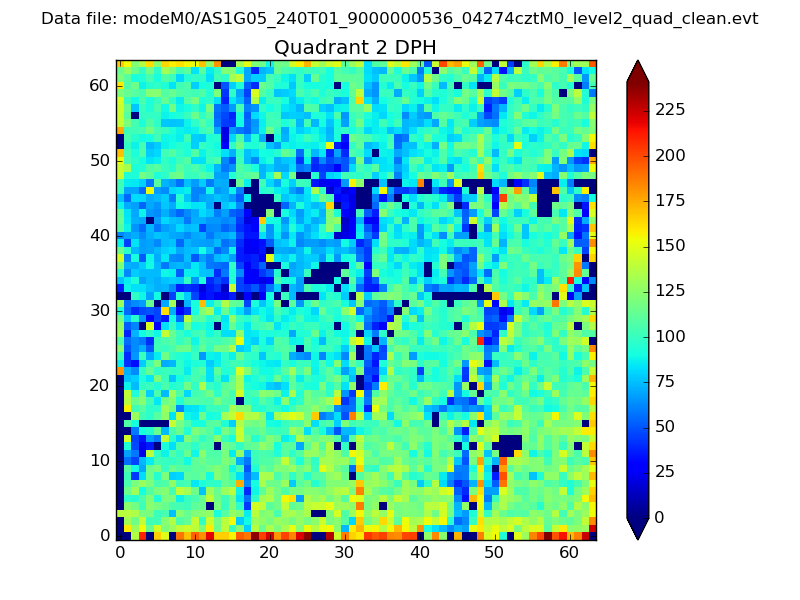
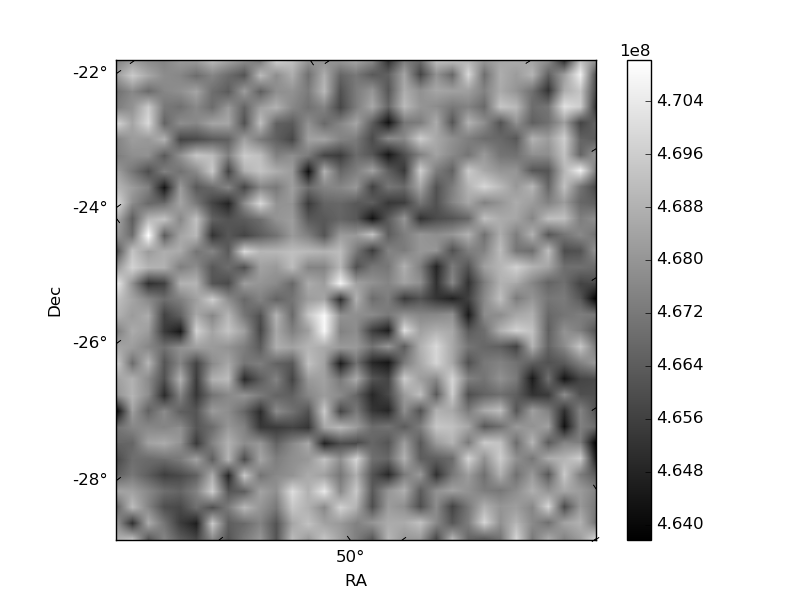
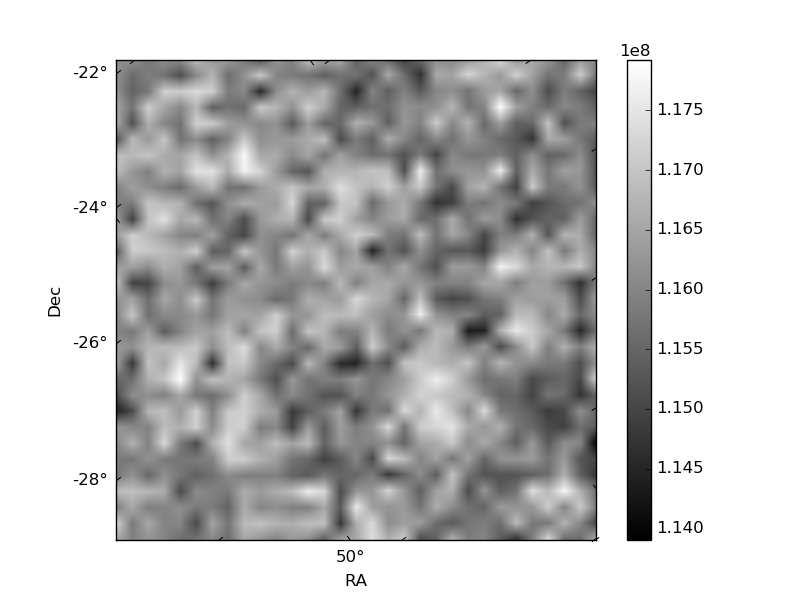
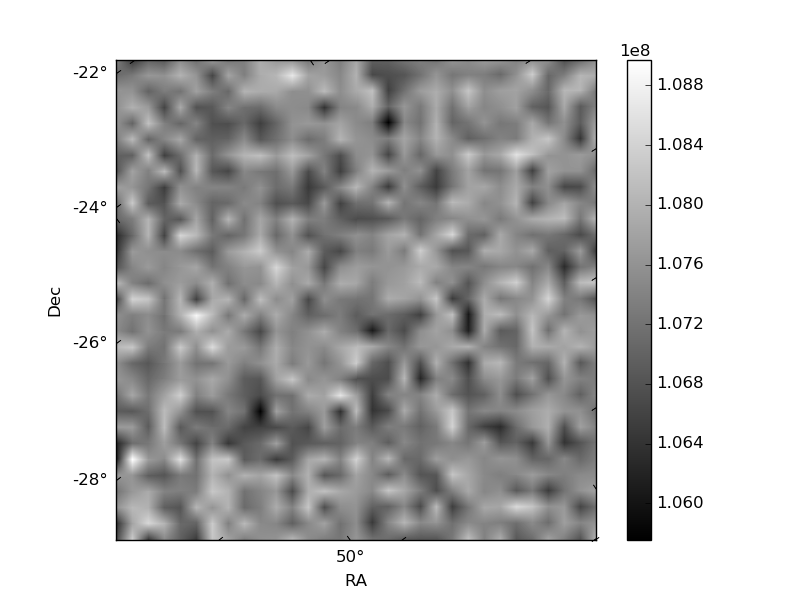
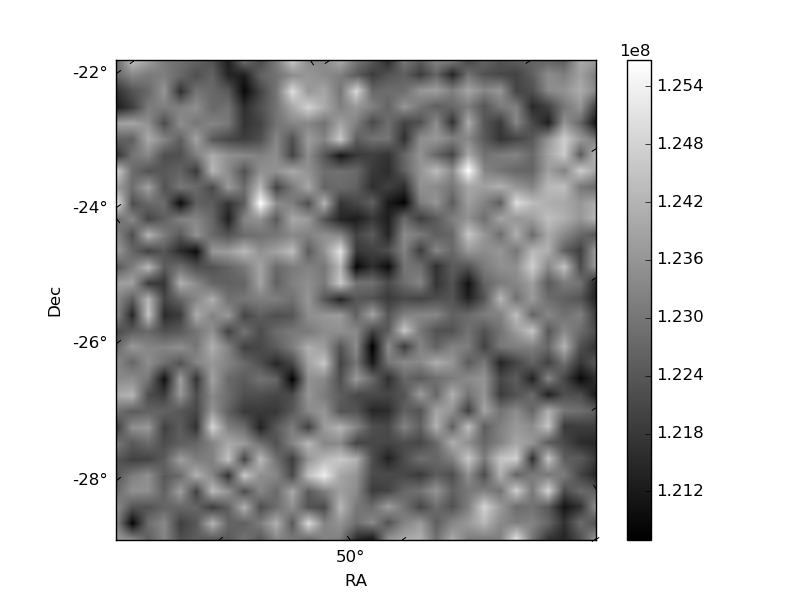
Histogram calculated using DETX and DETY for each event in the final _common_clean file
| Quadrant A | 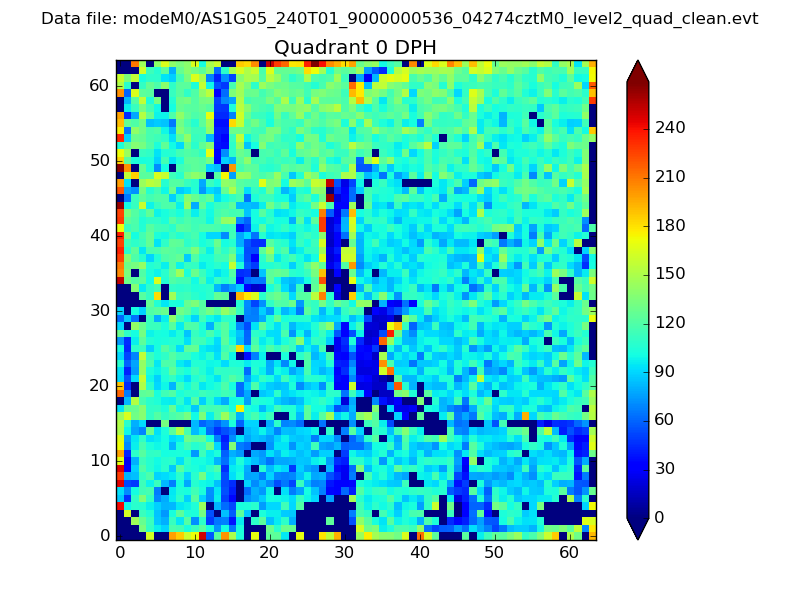 |
 |
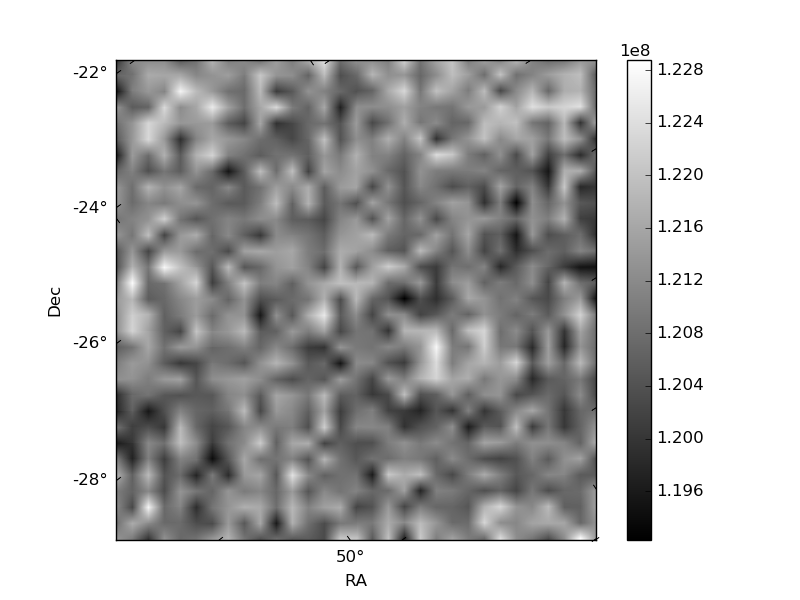
Quadrant B |
|---|---|---|---|
| Quadrant D | 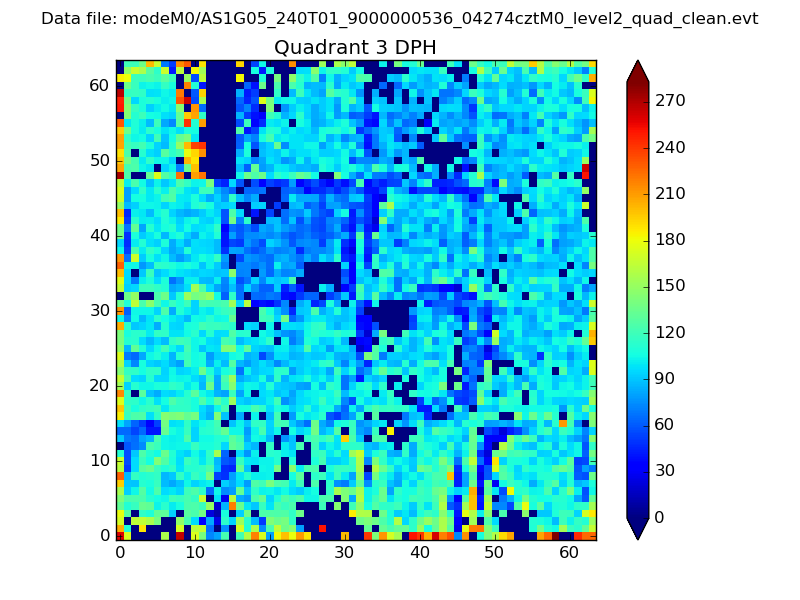 |
 |
Quadrant C |
| Plot type | Count rate plots | Images |
|---|---|---|
| Comparison with Poisson distribution Blue bars denote a histogram of data divided into 1 sec bins. Red curve is a Poisson curve with rate = median count rate of data. |
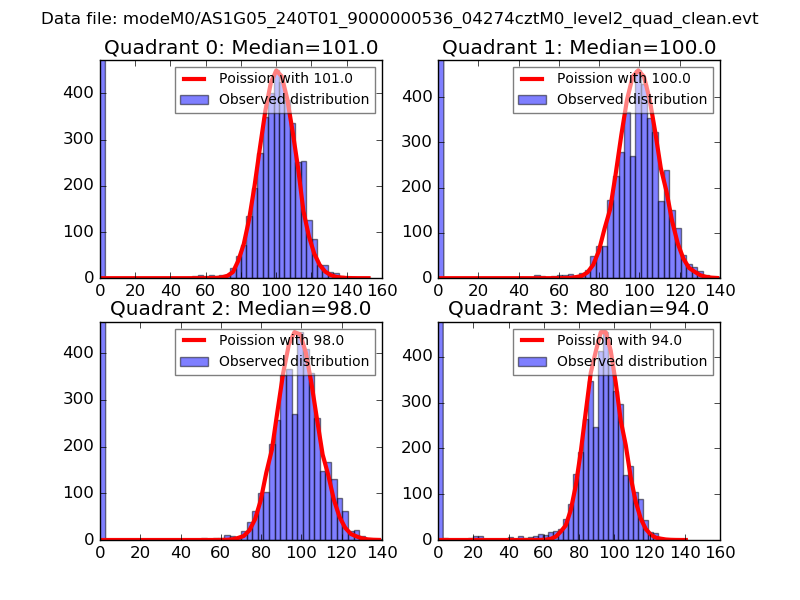 |
 |
| Quadrant-wise count rates Data is divided into 100 sec bins |
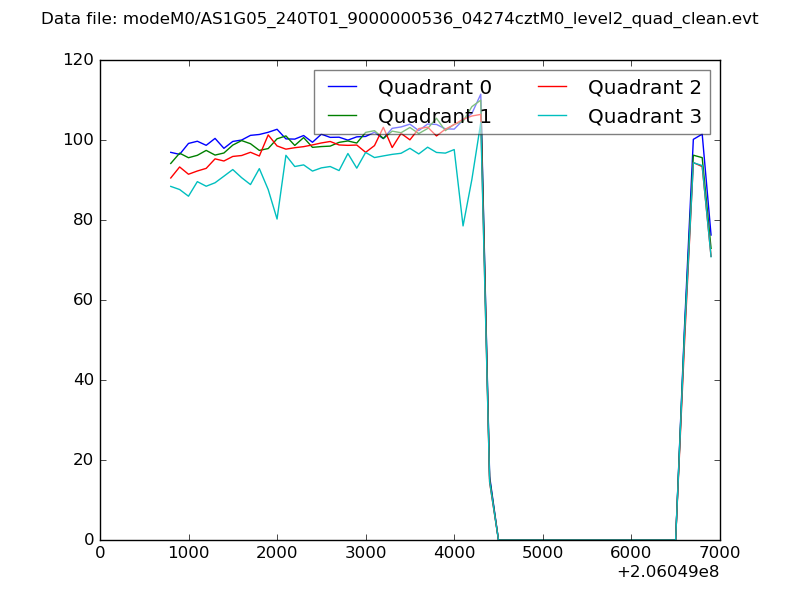 |
|
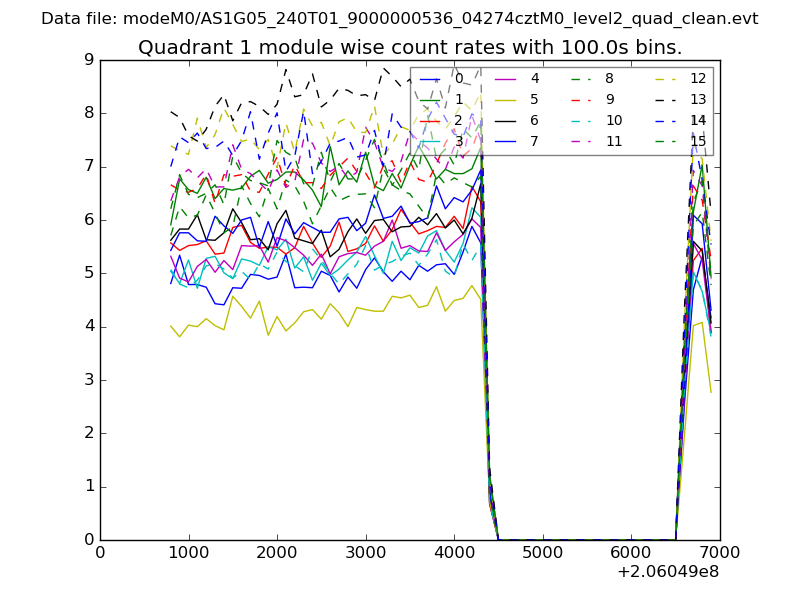
| Module-wise count rates for Quadrant A Data is divided into 100 sec bins |
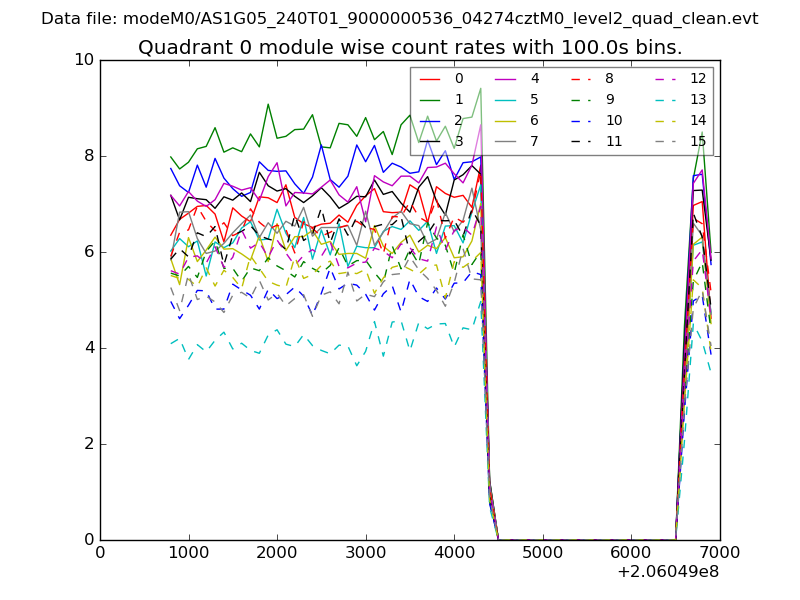 |
 |
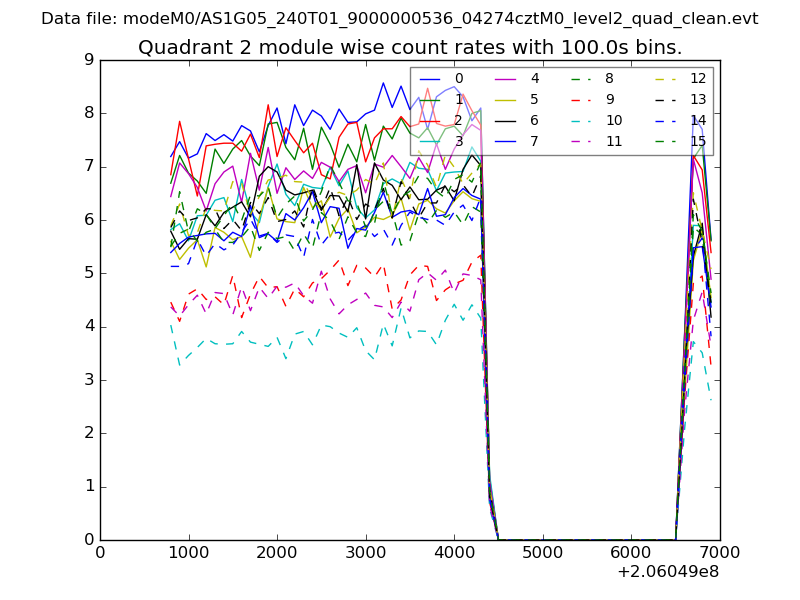
| Module-wise count rates for Quadrant B Data is divided into 100 sec bins |
 |
 |
| Module-wise count rates for Quadrant C Data is divided into 100 sec bins |
 |
 |
| Module-wise count rates for Quadrant D Data is divided into 100 sec bins |
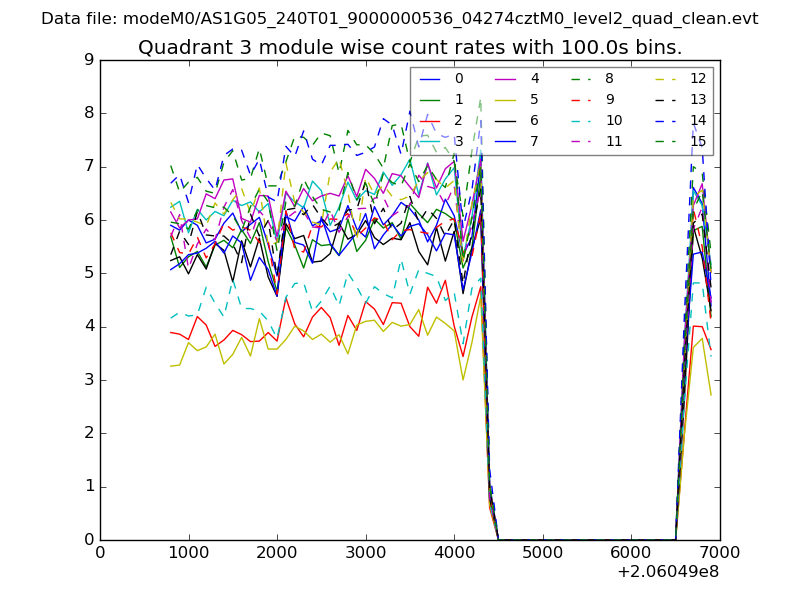 |
 |
| Parameter | Plot |
|---|---|
| CZT HV Monitor | 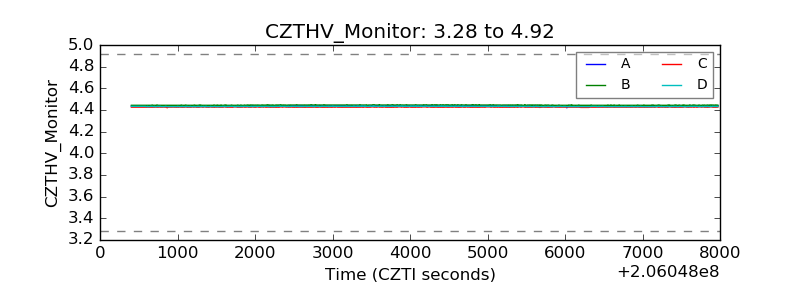 |
| D_VDD | 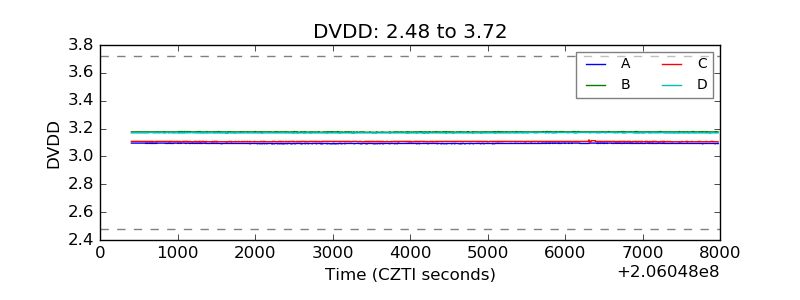 |
| Temperature 1 | 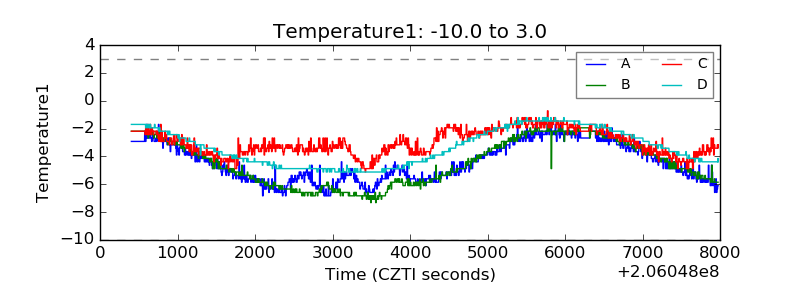 |
| Veto HV Monitor | 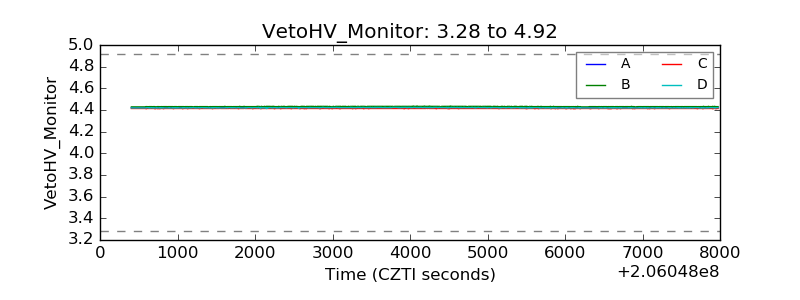 |
| Veto LLD | 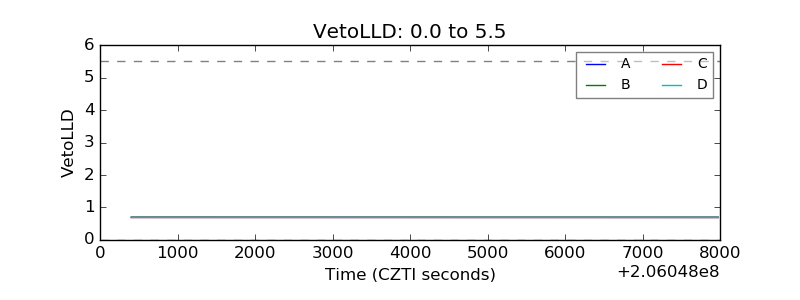 |
| Alpha Counter | 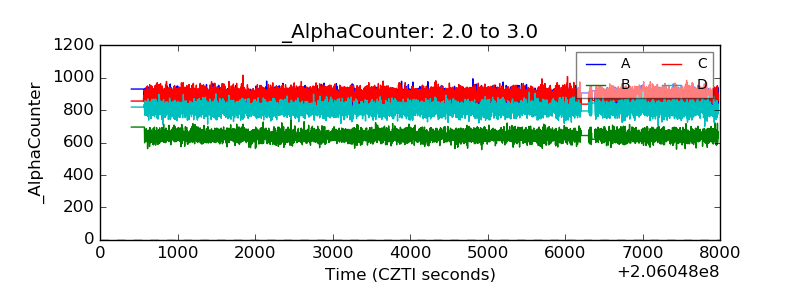 |
| _CPM_Rate | 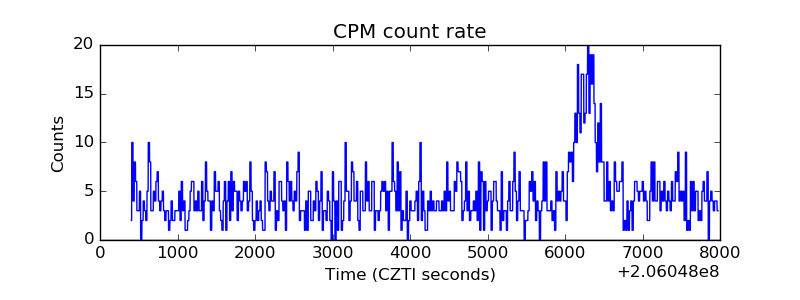 |
| CZT Counter | 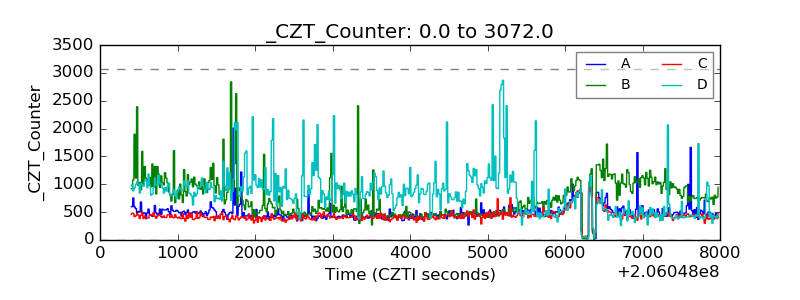 |
| +2.5 Volts monitor |  |
| +5 Volts monitor |  |
| _ROLL_ROT | 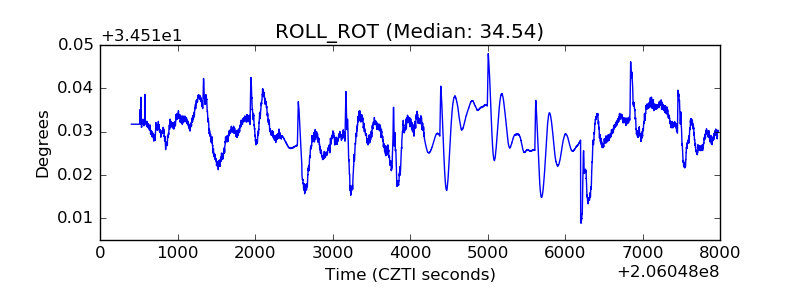 |
| _Roll_DEC | 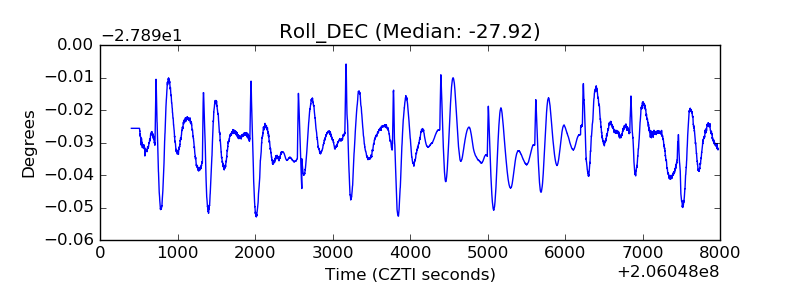 |
| _Roll_RA | 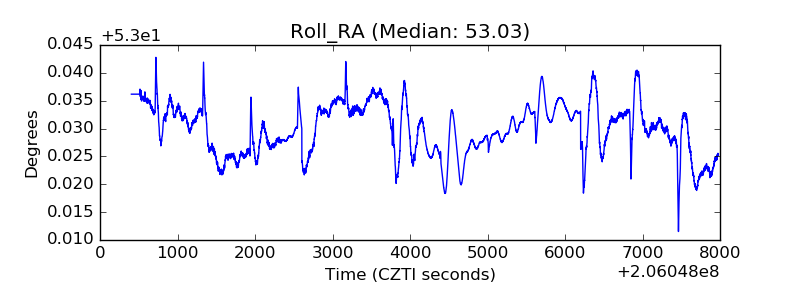 |
| Veto Counter | 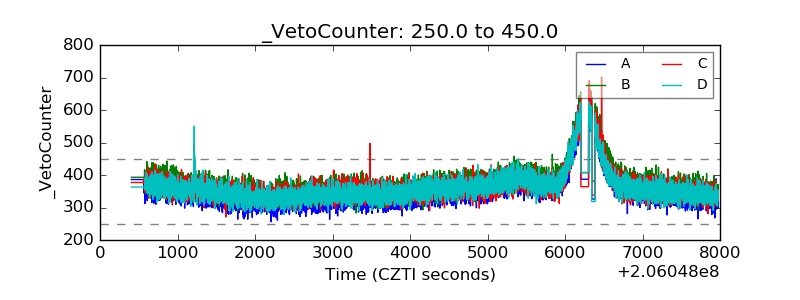 |