| Param | Original file | Final file |
|---|---|---|
| Filename | modeM0/AS1G05_240T01_9000000536_04275cztM0_level2.evt | modeM0/AS1G05_240T01_9000000536_04275cztM0_level2_quad_clean.evt |
| Size (bytes) | 1,041,284,160 | 133,824,960 |
| Size | 993.0 MB | 127.6 MB |
| Events in quadrant A | 6,735,799 | 819,611 |
| Events in quadrant B | 8,353,297 | 807,822 |
| Events in quadrant C | 5,518,701 | 798,149 |
| Events in quadrant D | 10,079,211 | 758,603 |
| Mode SS | |||
|---|---|---|---|
| Quadrant | BADHDUFLAG | Total packets | Discarded packets |
| A | 0 | 256 | 0 |
| B | 0 | 256 | 0 |
| C | 0 | 256 | 0 |
| D | 0 | 256 | 0 |
| Mode M9 | |||
|---|---|---|---|
| Quadrant | BADHDUFLAG | Total packets | Discarded packets |
| A | 0 | 3 | 0 |
| B | 0 | 3 | 0 |
| C | 0 | 3 | 0 |
| D | 0 | 3 | 0 |
| Mode M0 | |||
|---|---|---|---|
| Quadrant | BADHDUFLAG | Total packets | Discarded packets |
| A | 0 | 28518 | 5 |
| B | 0 | 33472 | 5 |
| C | 0 | 25722 | 2 |
| D | 0 | 38690 | 5 |
| Quadrant | Total seconds | Saturated seconds | Saturation percentage |
|---|---|---|---|
| A | 12561 | 509 | 4.052225% |
| B | 12560 | 472 | 3.757962% |
| C | 12562 | 131 | 1.042828% |
| D | 12561 | 528 | 4.203487% |
Noise dominated data is calculated using 1-second bins in cleaned event files. If a bin has >2000 counts, and if more than 50% of those come from <1% of pixels, then it is considered to be noise-dominated and hence unusable.
| Quadrant | # 1 sec bins | Bins with >0 counts | Bins with >2000 counts | High rate bins dominated by noise | Noise dominated (total time) | Noise dominated (detector-on time) | Marked lightcurve |
|---|---|---|---|---|---|---|---|
| A | 12912 | 12565 | 267 | 267 | 2.07% | 2.12% | 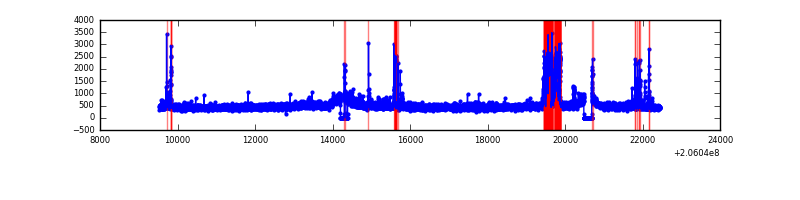 |
| B | 12912 | 12564 | 82 | 82 | 0.64% | 0.65% | 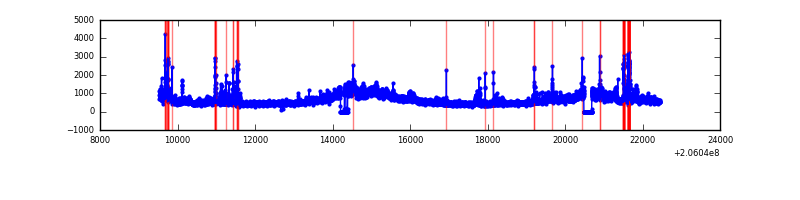 |
| C | 12912 | 12565 | 0 | 0 | 0.00% | 0.00% | 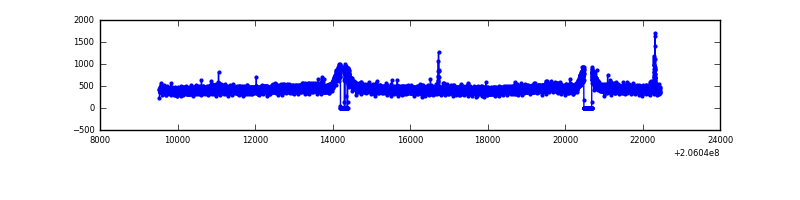 |
| D | 12912 | 12564 | 293 | 293 | 2.27% | 2.33% | 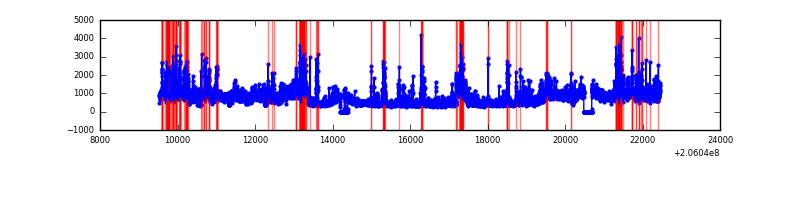 |
Top three noisy pixels from each quadrant. If the there are fewer than three noisy pixels in the level2.evt file, extra rows are filled as -1
| Pixel properties | Quadrant properties | ||||||
|---|---|---|---|---|---|---|---|
| Quadrant | DetID | PixID | Counts | Sigma | Mean | Median | Sigma |
| A | 0 | 50 | 829938 | 2832.99 | 1423 | 1390 | 292.5 |
| A | 8 | 15 | 361606 | 1231.66 | 1423 | 1390 | 292.5 |
| A | 0 | 199 | 35640 | 117.11 | 1423 | 1390 | 292.5 |
| B | 3 | 0 | 2027602 | 7258.72 | 1443 | 1408 | 279.1 |
| B | 10 | 16 | 405376 | 1447.19 | 1443 | 1408 | 279.1 |
| B | 14 | 167 | 129518 | 458.94 | 1443 | 1408 | 279.1 |
| C | 9 | 144 | 29516 | 86.18 | 1401 | 1406 | 326.2 |
| C | 10 | 65 | 11629 | 31.34 | 1401 | 1406 | 326.2 |
| C | 13 | 61 | 11592 | 31.23 | 1401 | 1406 | 326.2 |
| D | 11 | 132 | 2769659 | 8161.73 | 1381 | 1336 | 339.2 |
| D | 2 | 232 | 1128557 | 3323.34 | 1381 | 1336 | 339.2 |
| D | 1 | 52 | 353809 | 1039.18 | 1381 | 1336 | 339.2 |
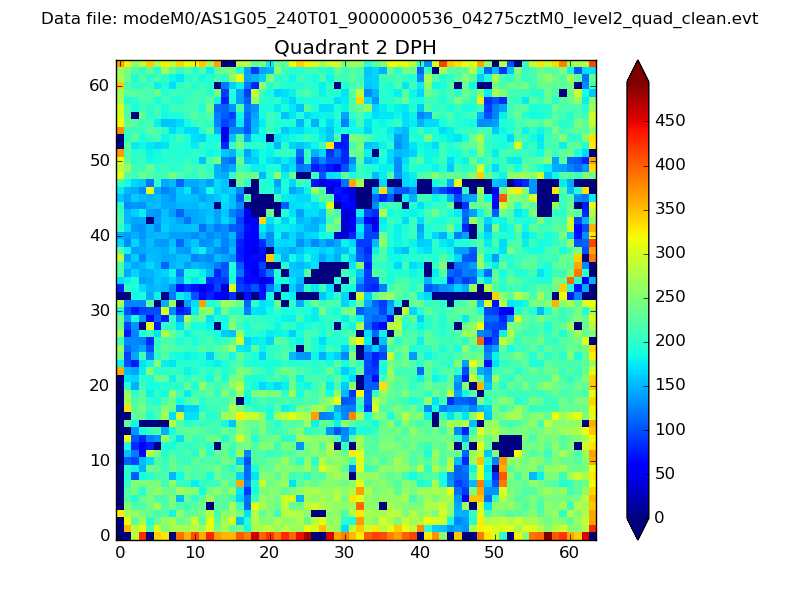
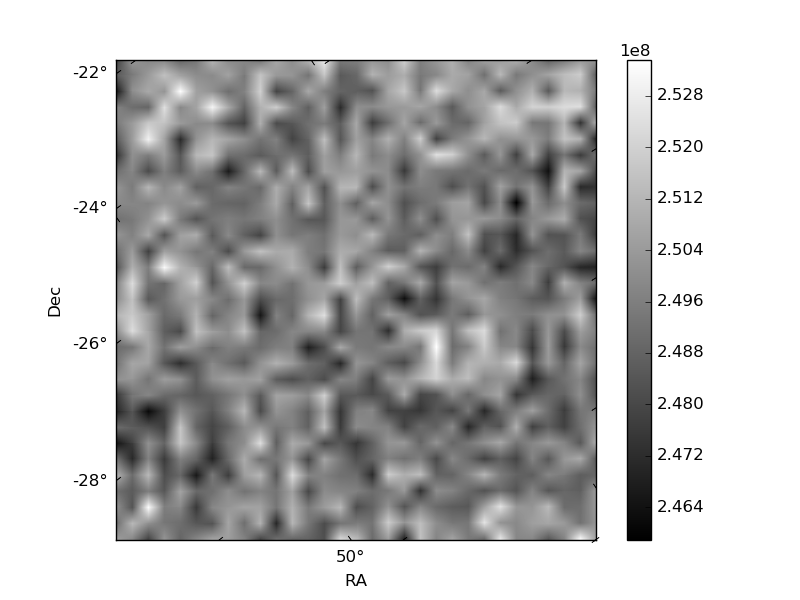
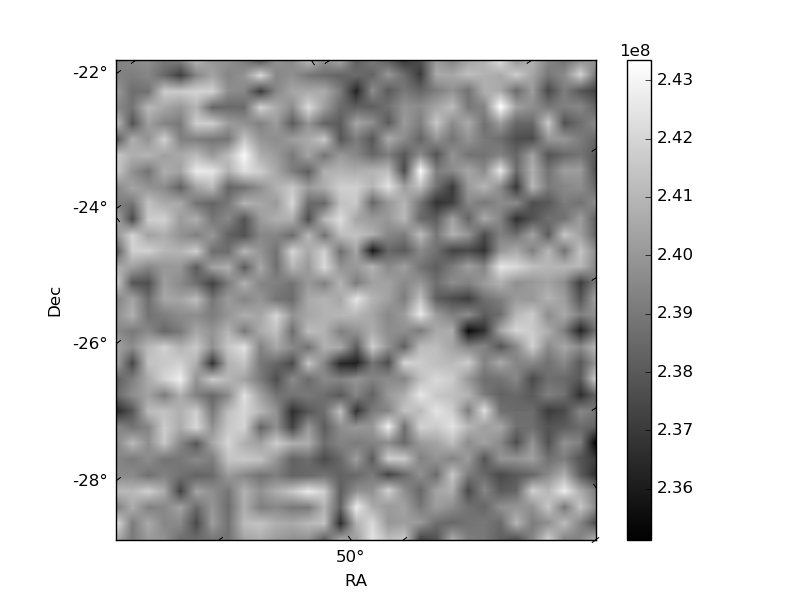
Histogram calculated using DETX and DETY for each event in the final _common_clean file
| Quadrant A | 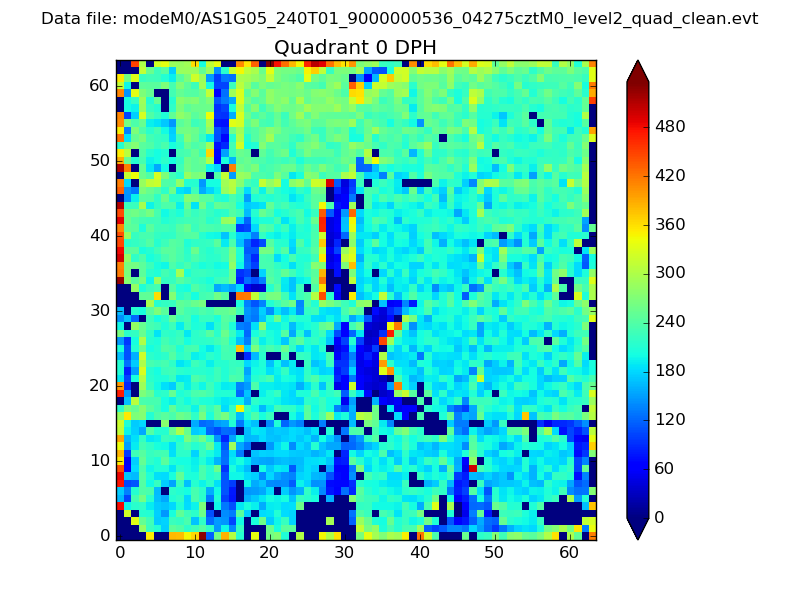 |
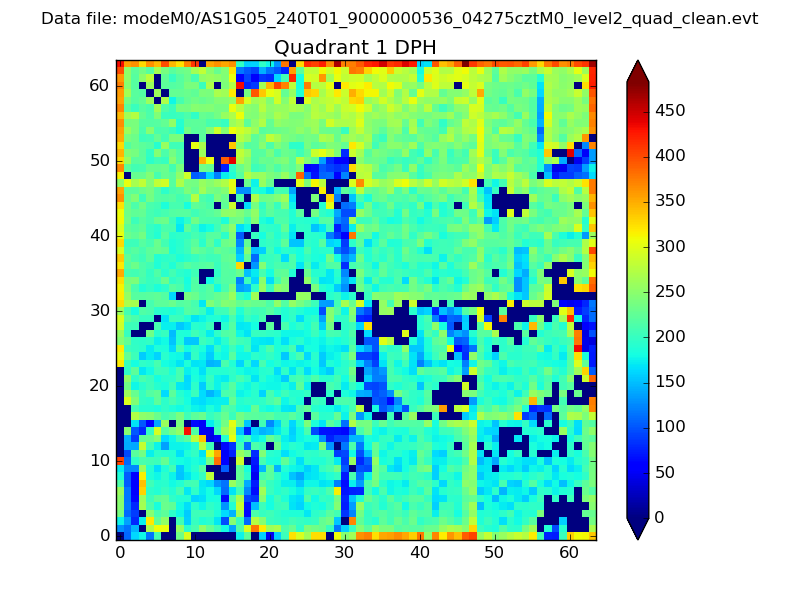 |
Quadrant B |
|---|---|---|---|
| Quadrant D | 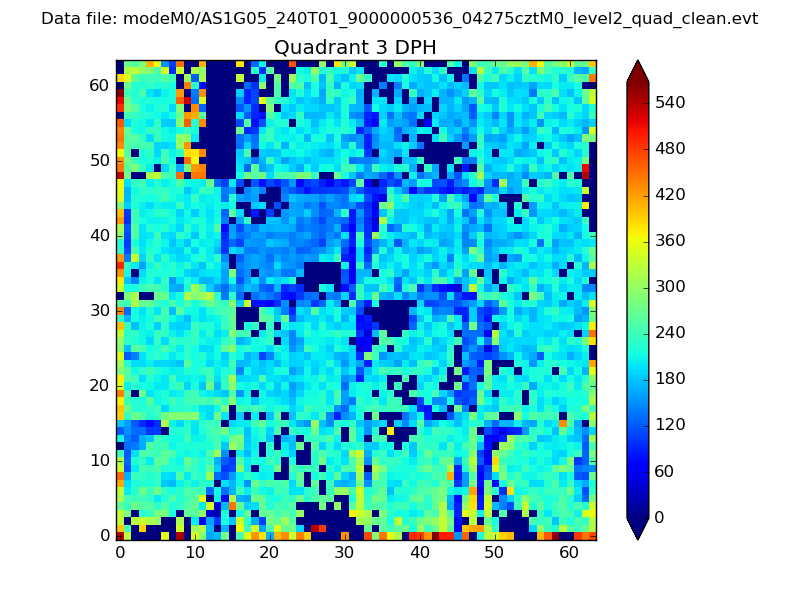 |
 |
Quadrant C |
| Plot type | Count rate plots | Images |
|---|---|---|
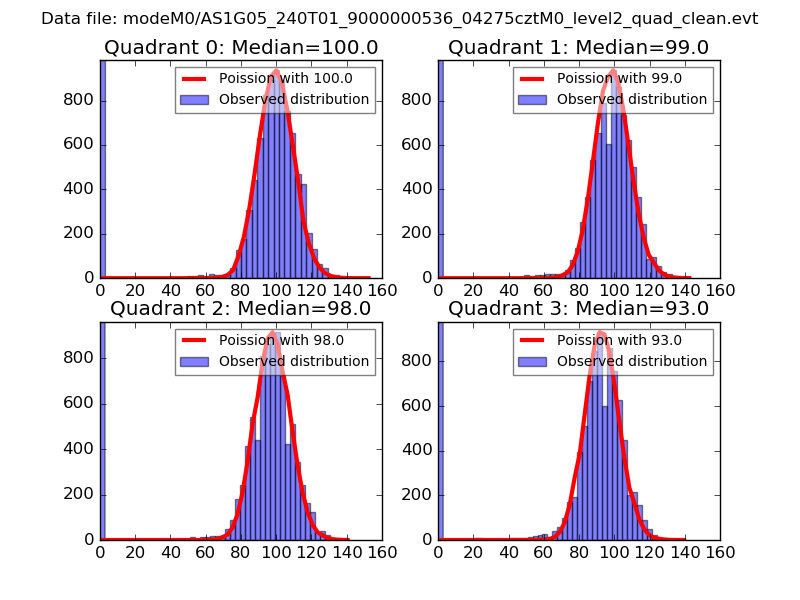
| Comparison with Poisson distribution Blue bars denote a histogram of data divided into 1 sec bins. Red curve is a Poisson curve with rate = median count rate of data. |
 |
 |
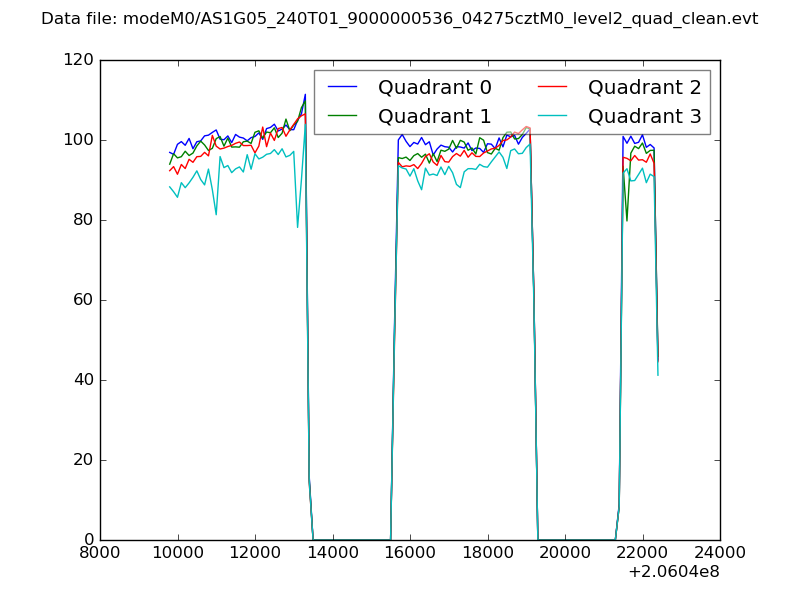
| Quadrant-wise count rates Data is divided into 100 sec bins |
 |
|
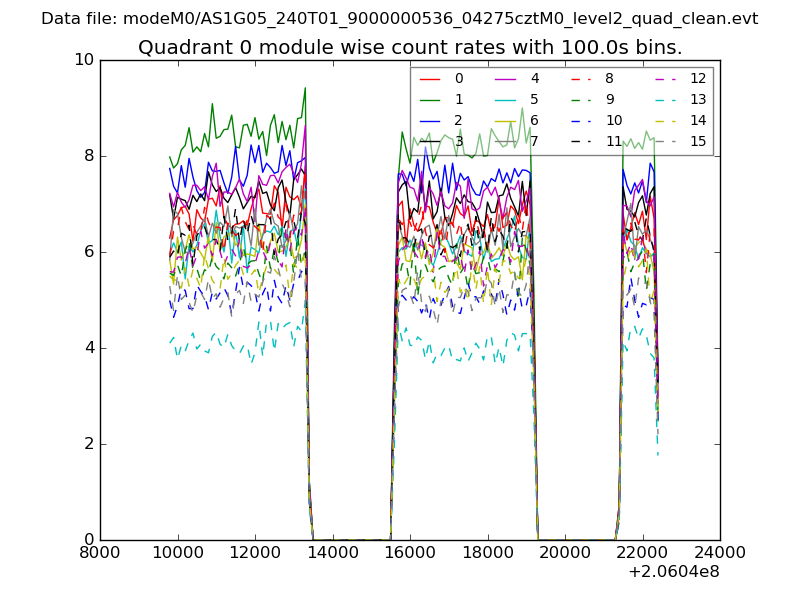
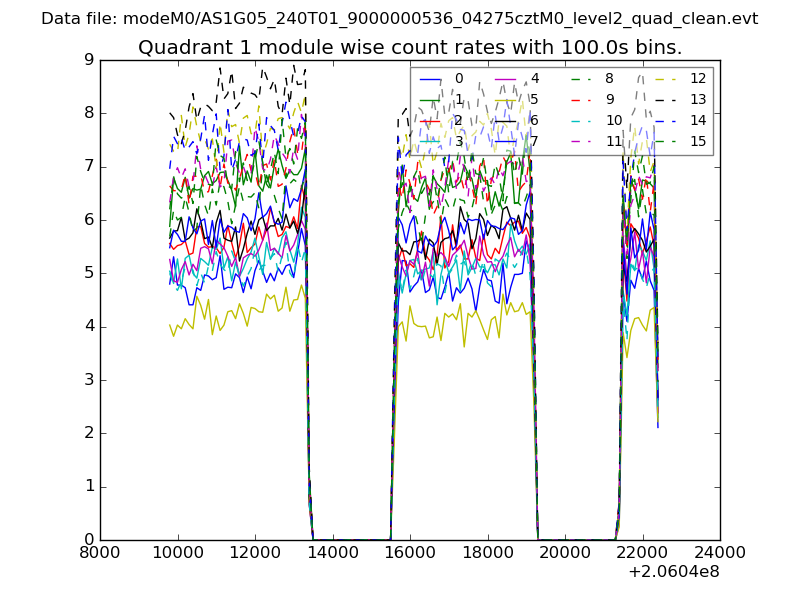
| Module-wise count rates for Quadrant A Data is divided into 100 sec bins |
 |
 |
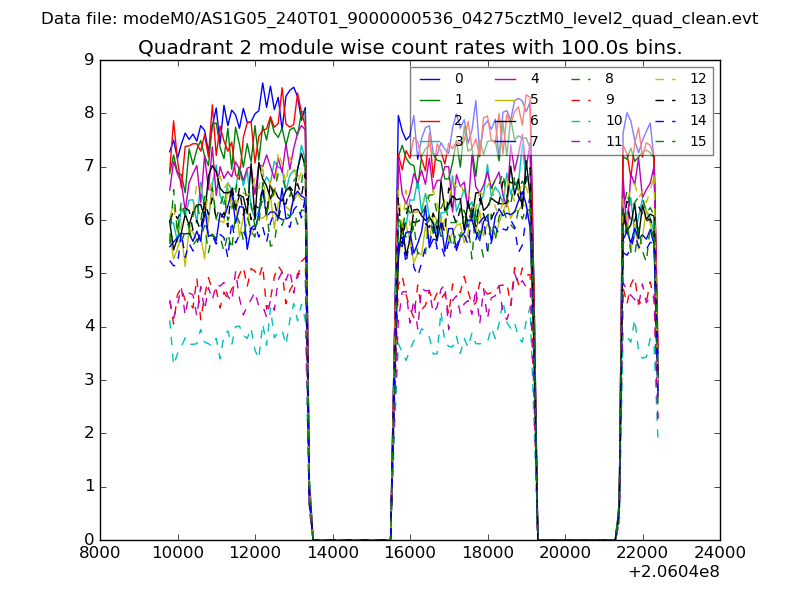
| Module-wise count rates for Quadrant B Data is divided into 100 sec bins |
 |
 |
| Module-wise count rates for Quadrant C Data is divided into 100 sec bins |
 |
 |
| Module-wise count rates for Quadrant D Data is divided into 100 sec bins |
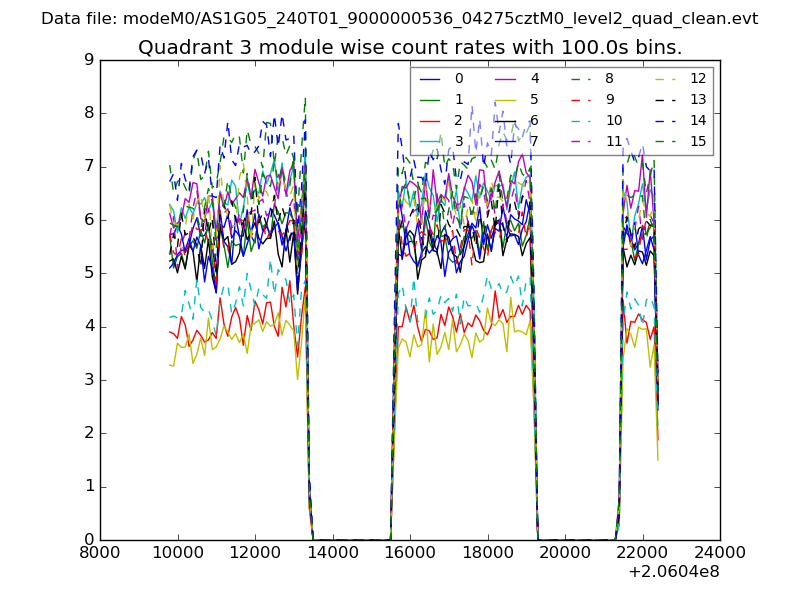 |
 |
| Parameter | Plot |
|---|---|
| CZT HV Monitor | 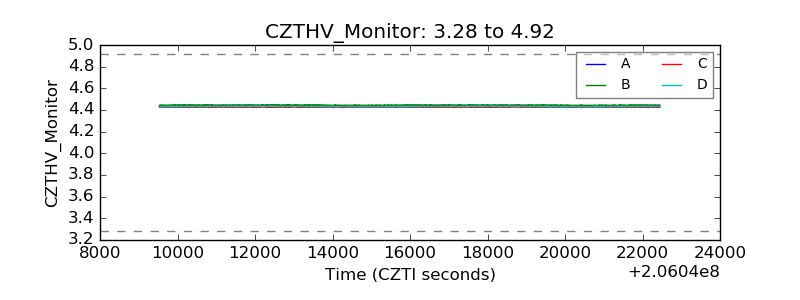 |
| D_VDD | 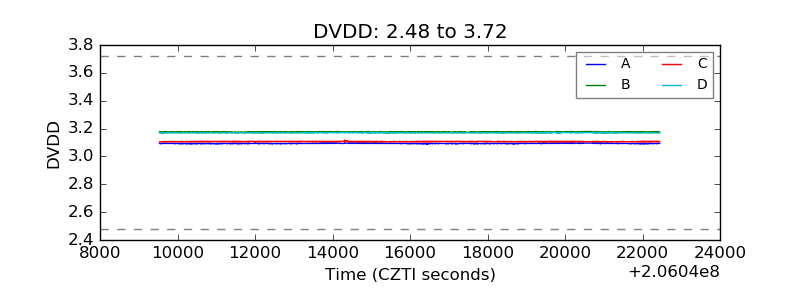 |
| Temperature 1 | 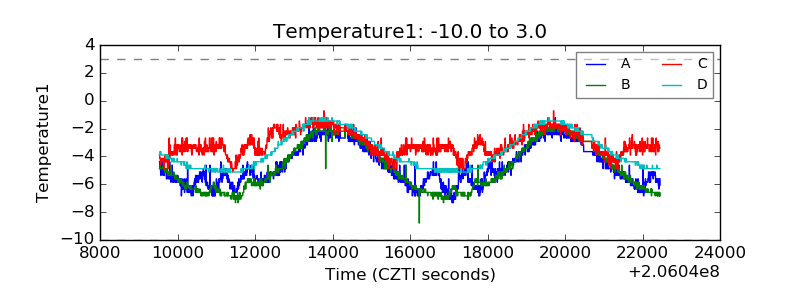 |
| Veto HV Monitor | 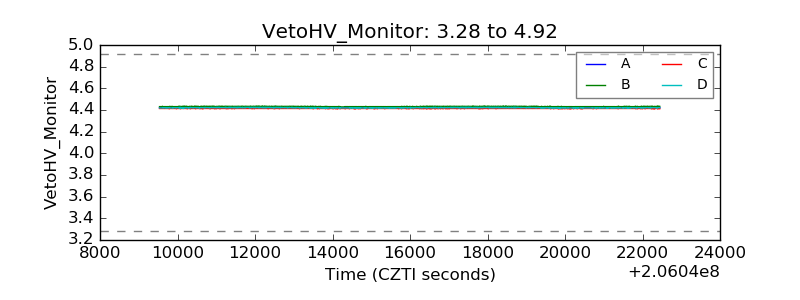 |
| Veto LLD | 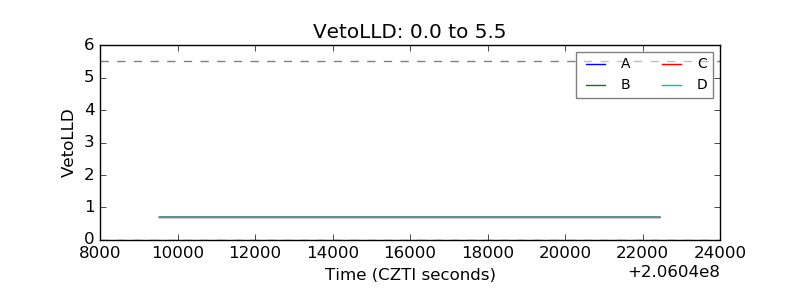 |
| Alpha Counter | 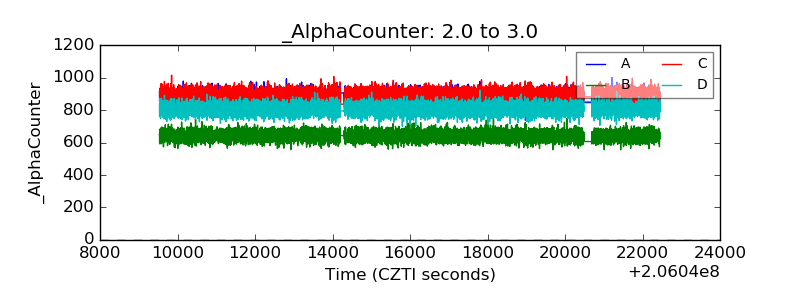 |
| _CPM_Rate | 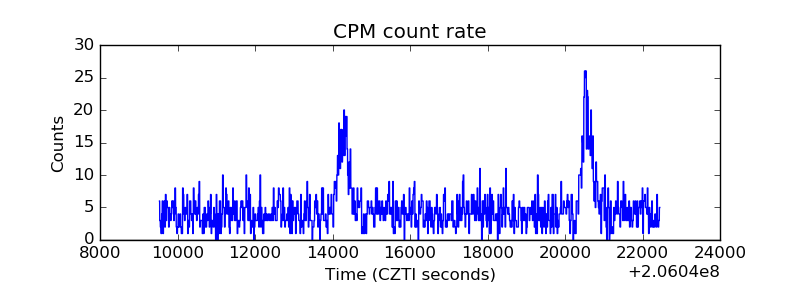 |
| CZT Counter | 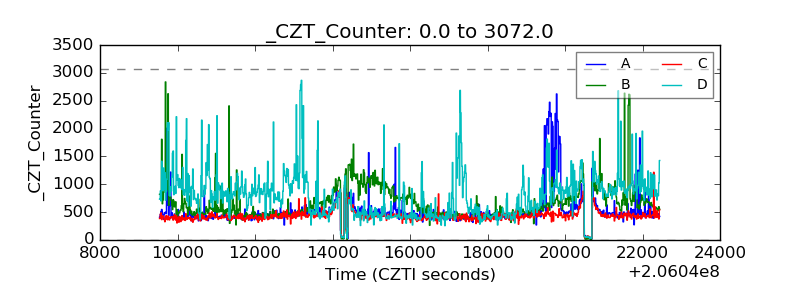 |
| +2.5 Volts monitor |  |
| +5 Volts monitor |  |
| _ROLL_ROT | 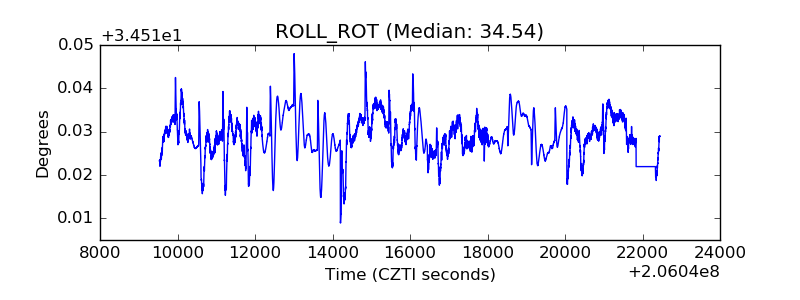 |
| _Roll_DEC | 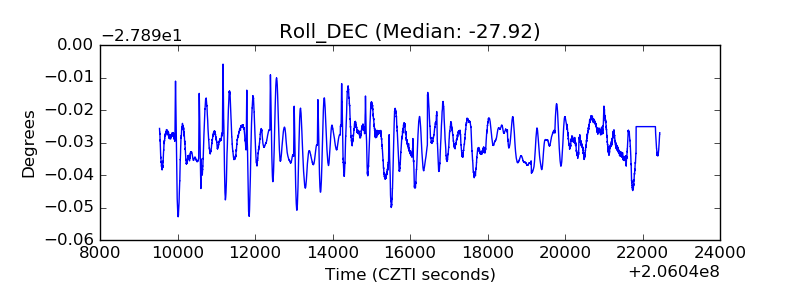 |
| _Roll_RA | 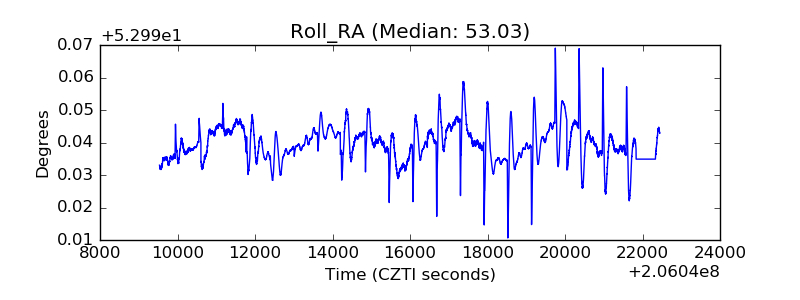 |
| Veto Counter | 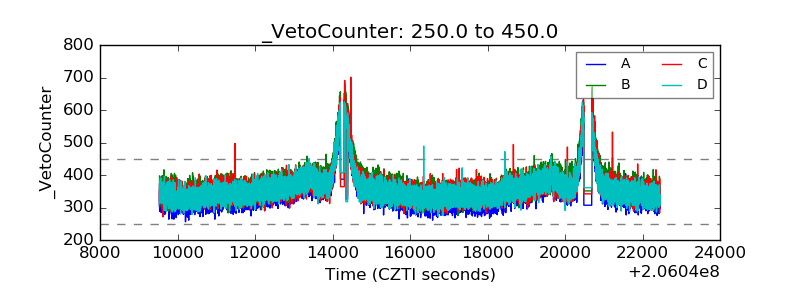 |