| Param | Original file | Final file |
|---|---|---|
| Filename | modeM0/AS1G05_240T01_9000000536_04279cztM0_level2.evt | modeM0/AS1G05_240T01_9000000536_04279cztM0_level2_quad_clean.evt |
| Size (bytes) | 567,774,720 | 70,058,880 |
| Size | 541.5 MB | 66.8 MB |
| Events in quadrant A | 3,726,620 | 424,842 |
| Events in quadrant B | 4,724,544 | 423,397 |
| Events in quadrant C | 2,827,478 | 424,728 |
| Events in quadrant D | 5,483,657 | 401,989 |
| Mode SS | |||
|---|---|---|---|
| Quadrant | BADHDUFLAG | Total packets | Discarded packets |
| A | 0 | 130 | 0 |
| B | 0 | 130 | 0 |
| C | 0 | 130 | 0 |
| D | 0 | 130 | 0 |
| Mode M9 | |||
|---|---|---|---|
| Quadrant | BADHDUFLAG | Total packets | Discarded packets |
| A | 0 | 9 | 0 |
| B | 0 | 9 | 0 |
| C | 0 | 9 | 0 |
| D | 0 | 9 | 0 |
| Mode M0 | |||
|---|---|---|---|
| Quadrant | BADHDUFLAG | Total packets | Discarded packets |
| A | 0 | 15483 | 29 |
| B | 0 | 18255 | 21 |
| C | 0 | 13042 | 5 |
| D | 0 | 20981 | 35 |
| Quadrant | Total seconds | Saturated seconds | Saturation percentage |
|---|---|---|---|
| A | 6396 | 241 | 3.767980% |
| B | 6396 | 97 | 1.516573% |
| C | 6399 | 34 | 0.531333% |
| D | 6394 | 184 | 2.877698% |
Noise dominated data is calculated using 1-second bins in cleaned event files. If a bin has >2000 counts, and if more than 50% of those come from <1% of pixels, then it is considered to be noise-dominated and hence unusable.
| Quadrant | # 1 sec bins | Bins with >0 counts | Bins with >2000 counts | High rate bins dominated by noise | Noise dominated (total time) | Noise dominated (detector-on time) | Marked lightcurve |
|---|---|---|---|---|---|---|---|
| A | 7336 | 6401 | 116 | 116 | 1.58% | 1.81% | 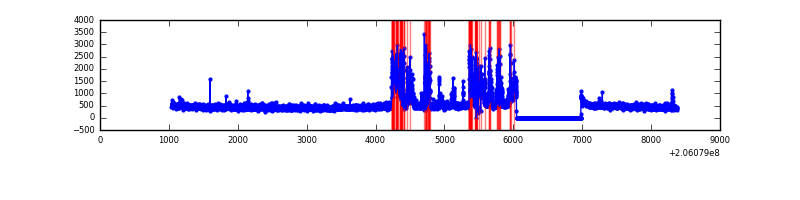 |
| B | 7336 | 6401 | 6 | 6 | 0.08% | 0.09% | 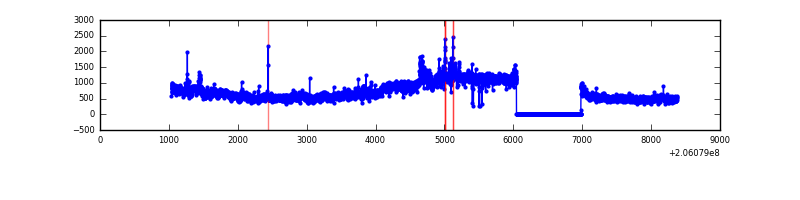 |
| C | 7336 | 6402 | 1 | 1 | 0.01% | 0.02% | 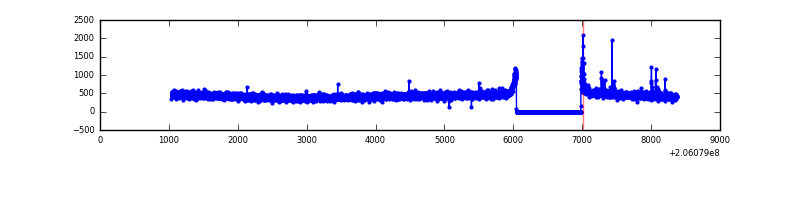 |
| D | 7336 | 6400 | 103 | 103 | 1.40% | 1.61% | 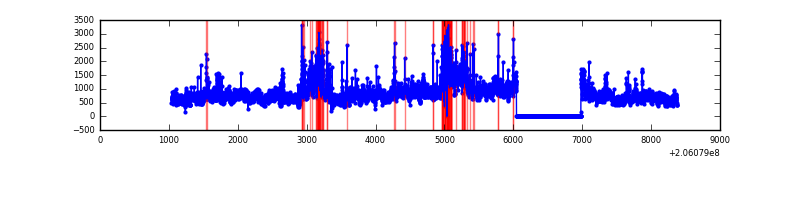 |
Top three noisy pixels from each quadrant. If the there are fewer than three noisy pixels in the level2.evt file, extra rows are filled as -1
| Pixel properties | Quadrant properties | ||||||
|---|---|---|---|---|---|---|---|
| Quadrant | DetID | PixID | Counts | Sigma | Mean | Median | Sigma |
| A | 0 | 50 | 793169 | 5355.06 | 720 | 704 | 148.0 |
| A | 8 | 15 | 113797 | 764.22 | 720 | 704 | 148.0 |
| A | 0 | 199 | 35270 | 233.58 | 720 | 704 | 148.0 |
| B | 3 | 0 | 1672217 | 11752.9 | 732 | 716 | 142.2 |
| B | 14 | 167 | 95086 | 663.55 | 732 | 716 | 142.2 |
| B | 10 | 16 | 73323 | 510.52 | 732 | 716 | 142.2 |
| C | 9 | 247 | 21204 | 123.28 | 712 | 715 | 166.2 |
| C | 9 | 54 | 11247 | 63.37 | 712 | 715 | 166.2 |
| C | 9 | 144 | 10239 | 57.3 | 712 | 715 | 166.2 |
| D | 11 | 132 | 1853107 | 10788.14 | 704 | 684 | 171.7 |
| D | 2 | 232 | 592266 | 3445.25 | 704 | 684 | 171.7 |
| D | 13 | 239 | 223646 | 1298.49 | 704 | 684 | 171.7 |
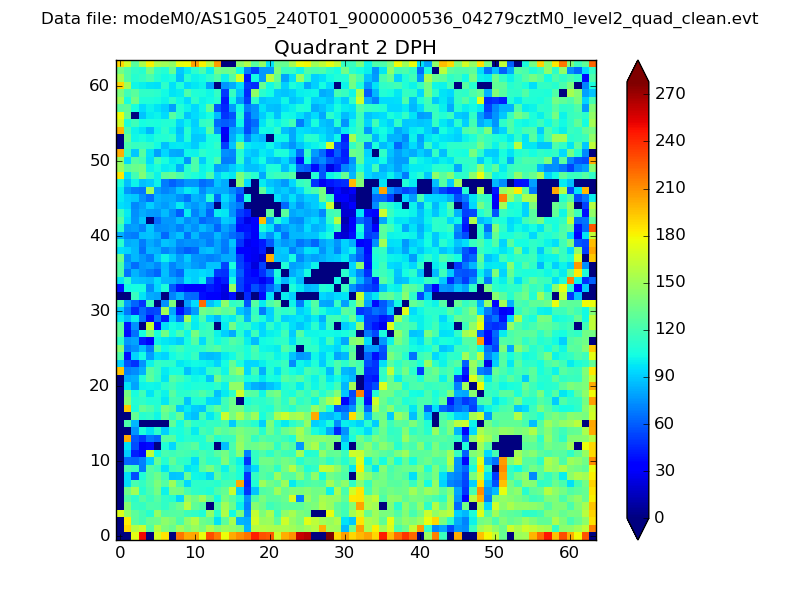
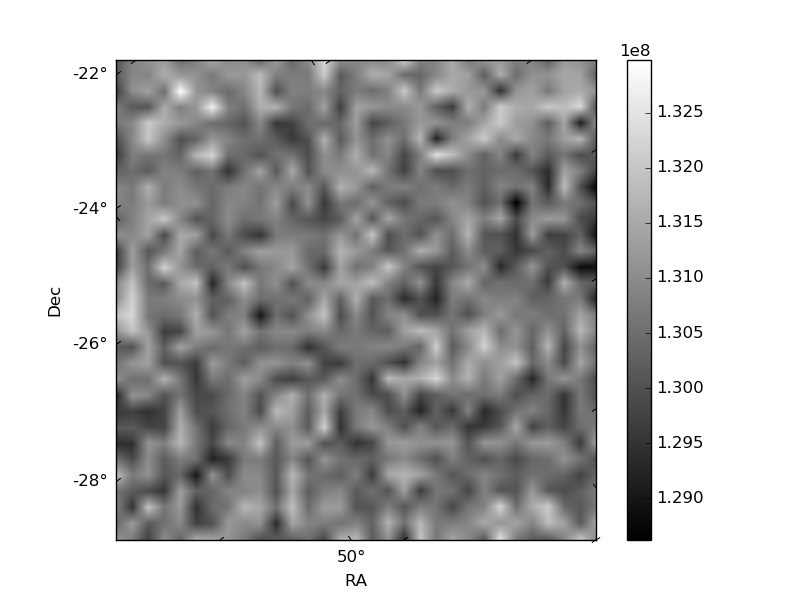
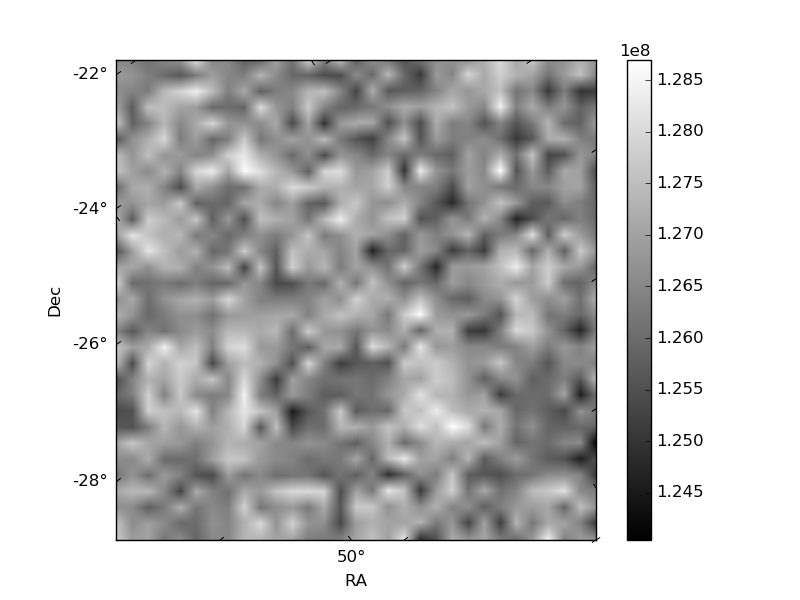
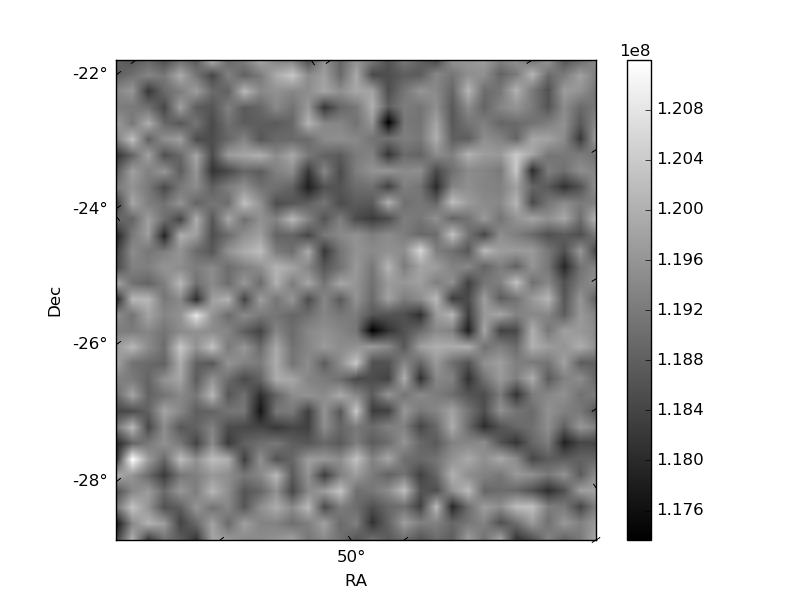
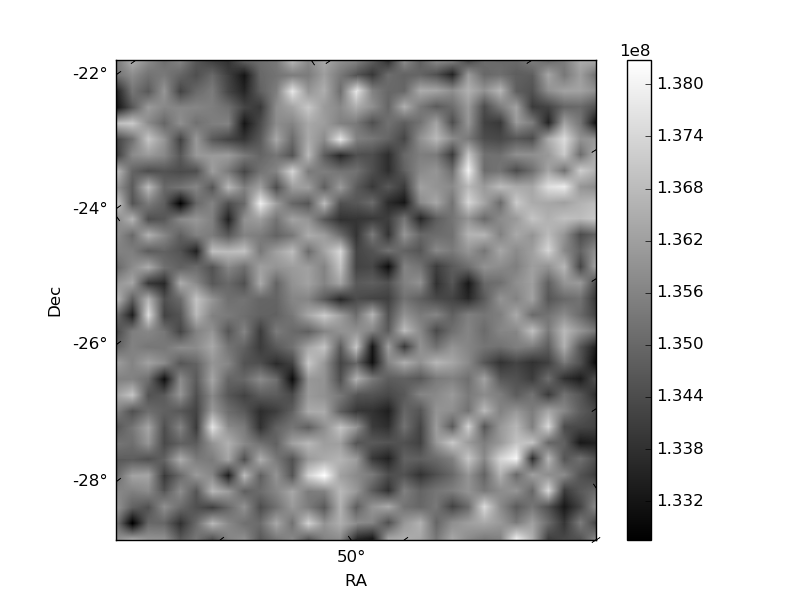
Histogram calculated using DETX and DETY for each event in the final _common_clean file
| Quadrant A | 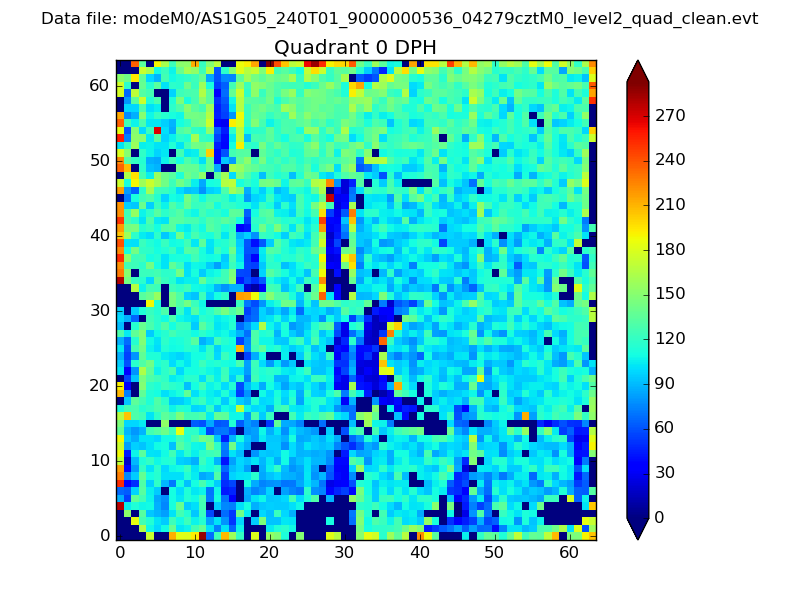 |
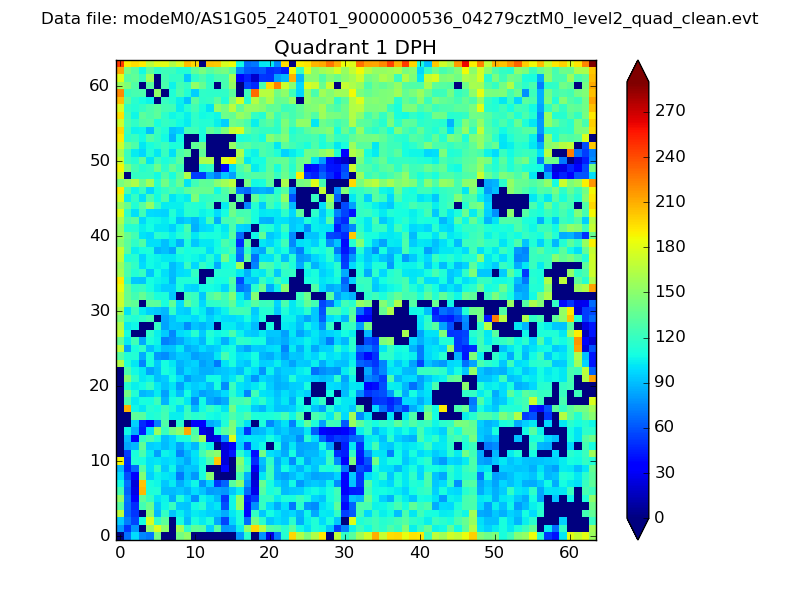 |
Quadrant B |
|---|---|---|---|
| Quadrant D | 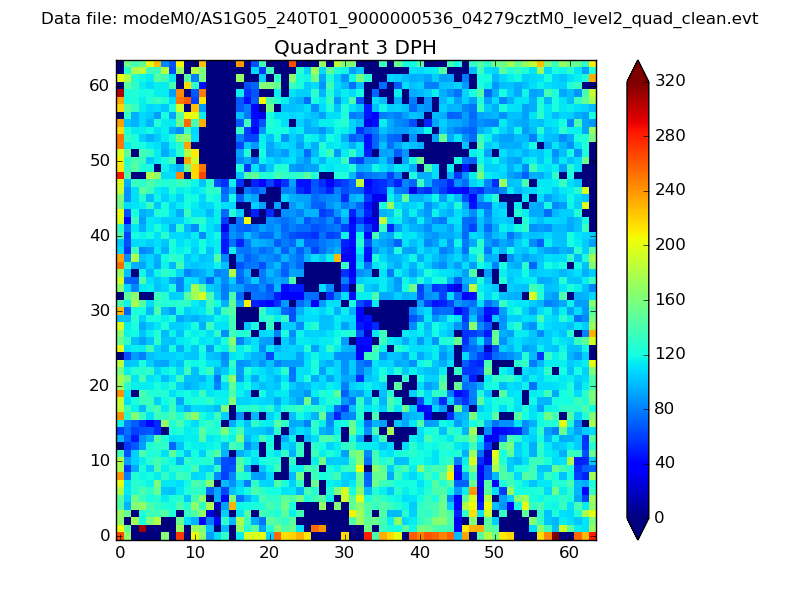 |
 |
Quadrant C |
| Plot type | Count rate plots | Images |
|---|---|---|
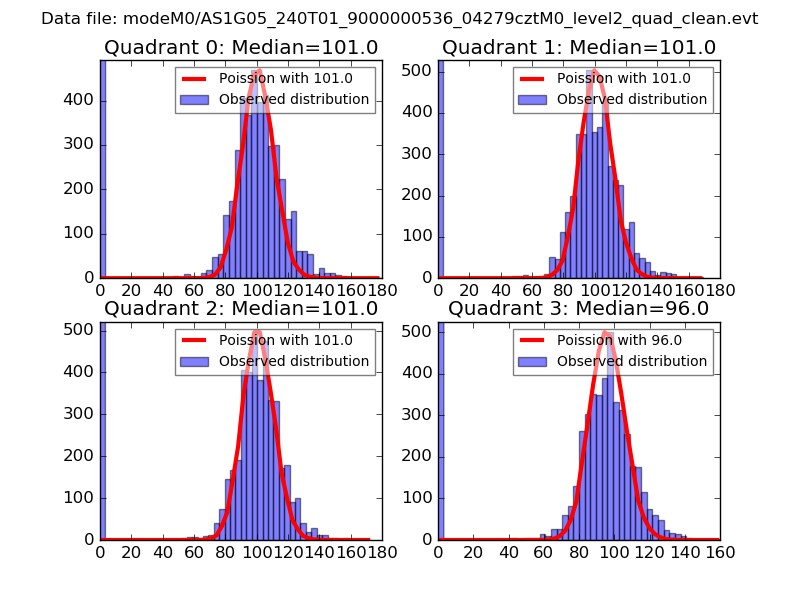
| Comparison with Poisson distribution Blue bars denote a histogram of data divided into 1 sec bins. Red curve is a Poisson curve with rate = median count rate of data. |
 |
 |
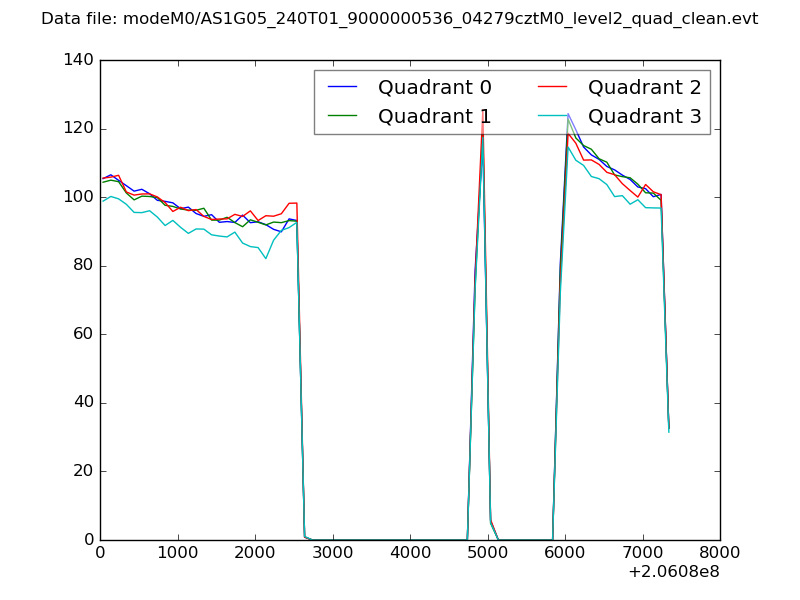
| Quadrant-wise count rates Data is divided into 100 sec bins |
 |
|
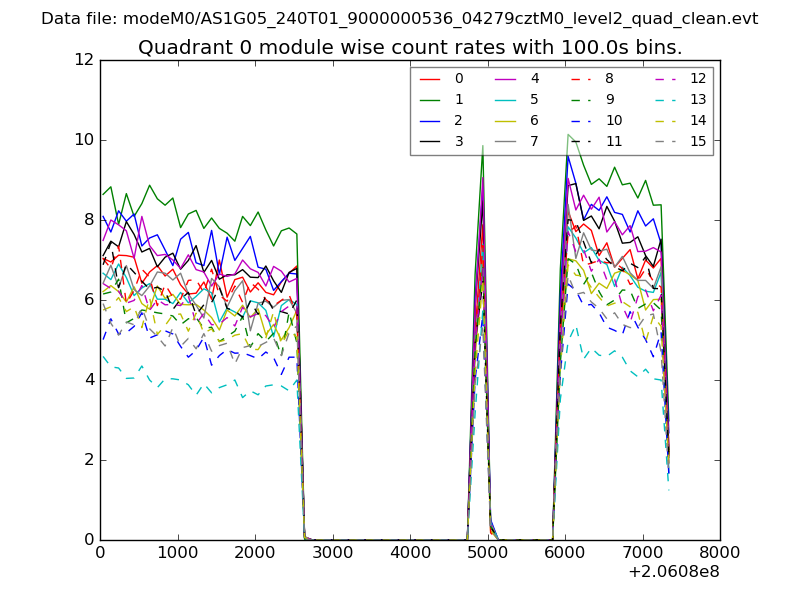
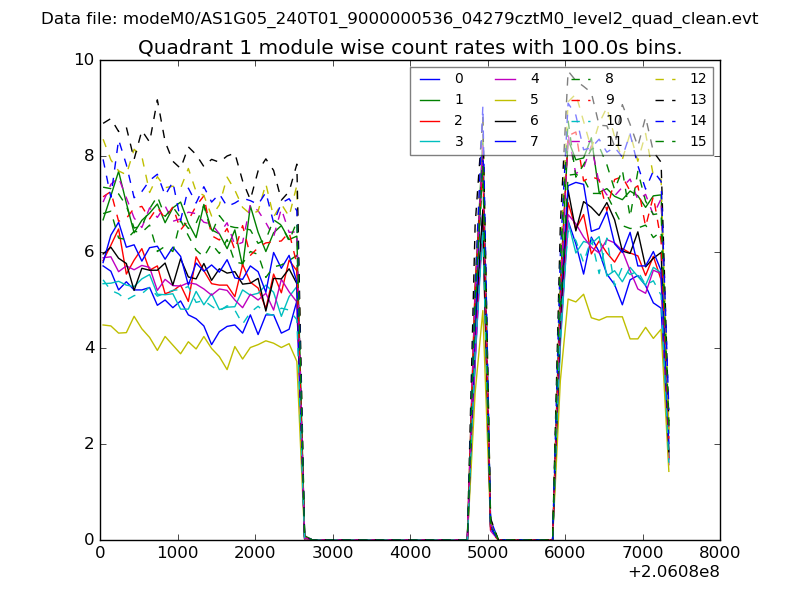
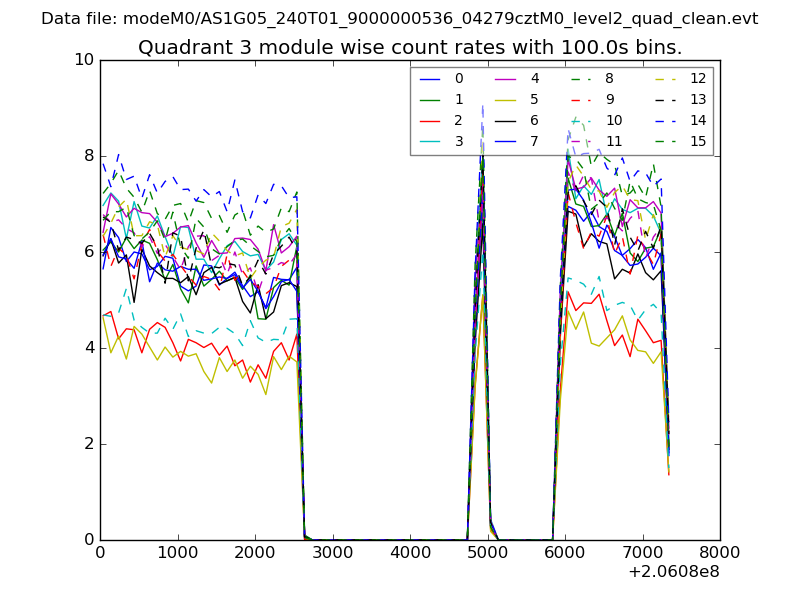
| Module-wise count rates for Quadrant A Data is divided into 100 sec bins |
 |
 |
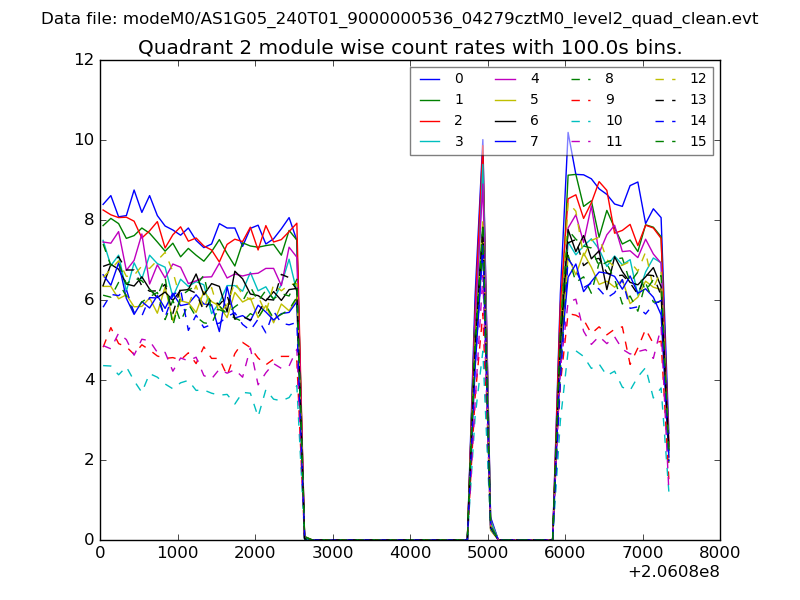
| Module-wise count rates for Quadrant B Data is divided into 100 sec bins |
 |
 |
| Module-wise count rates for Quadrant C Data is divided into 100 sec bins |
 |
 |
| Module-wise count rates for Quadrant D Data is divided into 100 sec bins |
 |
 |
| Parameter | Plot |
|---|---|
| CZT HV Monitor | 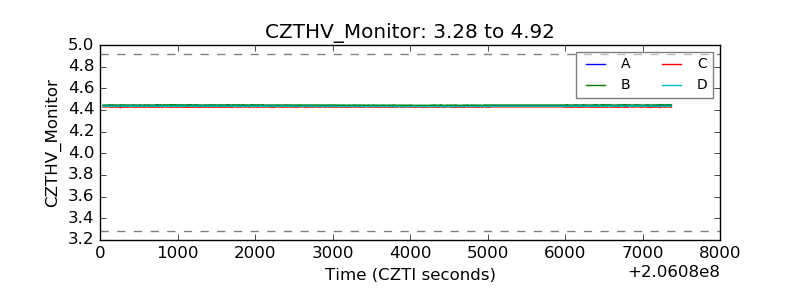 |
| D_VDD |  |
| Temperature 1 |  |
| Veto HV Monitor |  |
| Veto LLD |  |
| Alpha Counter | 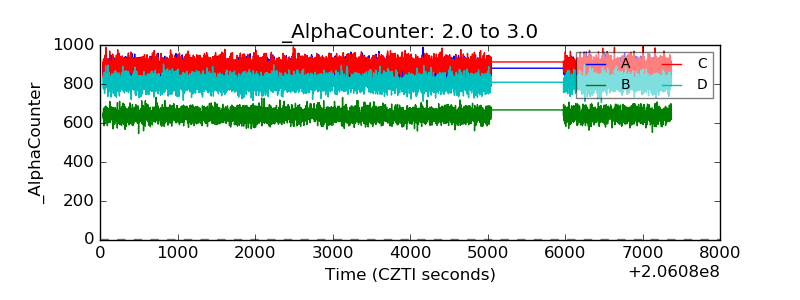 |
| _CPM_Rate | 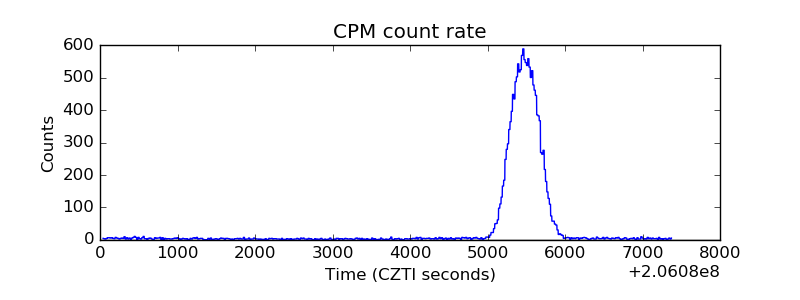 |
| CZT Counter | 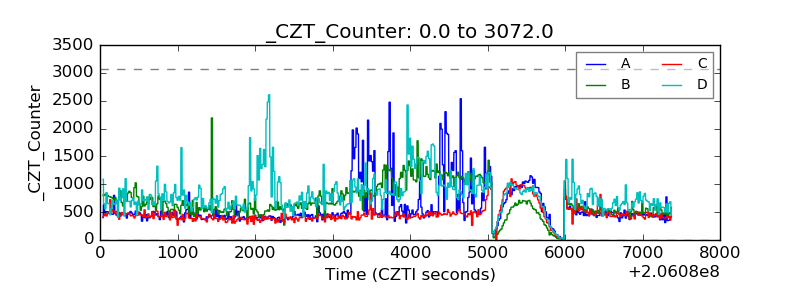 |
| +2.5 Volts monitor |  |
| +5 Volts monitor |  |
| _ROLL_ROT | 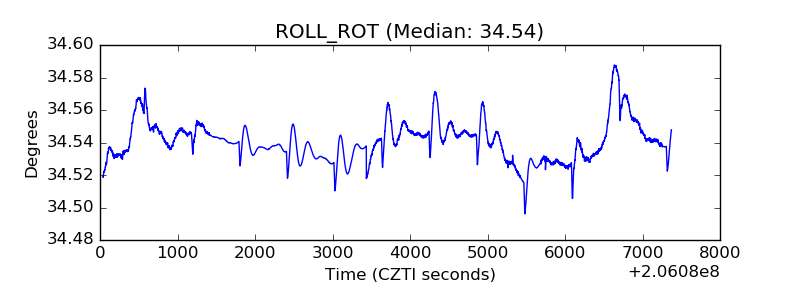 |
| _Roll_DEC | 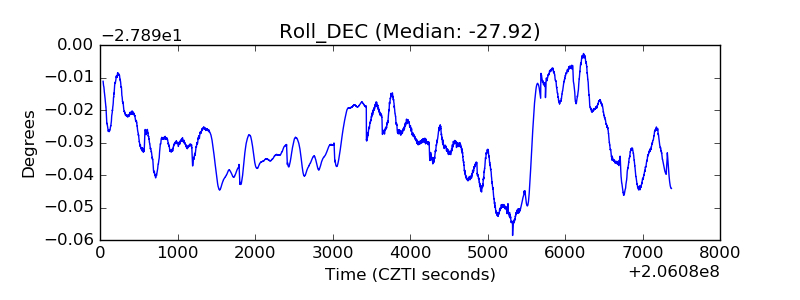 |
| _Roll_RA | 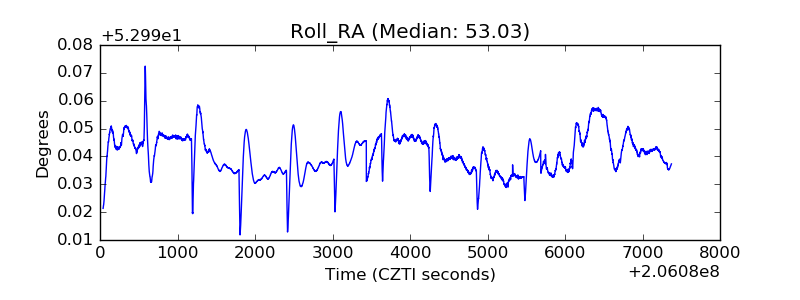 |
| Veto Counter | 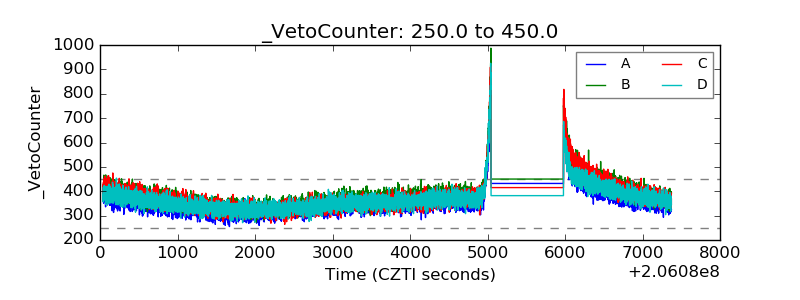 |