| Param | Original file | Final file |
|---|---|---|
| Filename | modeM0/AS1G05_240T01_9000000536_04283cztM0_level2.evt | modeM0/AS1G05_240T01_9000000536_04283cztM0_level2_quad_clean.evt |
| Size (bytes) | 603,904,320 | 60,033,600 |
| Size | 575.9 MB | 57.3 MB |
| Events in quadrant A | 4,841,552 | 334,136 |
| Events in quadrant B | 3,987,391 | 377,840 |
| Events in quadrant C | 2,634,764 | 364,822 |
| Events in quadrant D | 6,437,546 | 338,929 |
| Mode SS | |||
|---|---|---|---|
| Quadrant | BADHDUFLAG | Total packets | Discarded packets |
| A | 0 | 118 | 0 |
| B | 0 | 118 | 0 |
| C | 0 | 118 | 0 |
| D | 0 | 118 | 0 |
| Mode M9 | |||
|---|---|---|---|
| Quadrant | BADHDUFLAG | Total packets | Discarded packets |
| A | 0 | 12 | 0 |
| B | 0 | 12 | 0 |
| C | 0 | 12 | 0 |
| D | 0 | 12 | 0 |
| Mode M0 | |||
|---|---|---|---|
| Quadrant | BADHDUFLAG | Total packets | Discarded packets |
| A | 0 | 17932 | 2 |
| B | 0 | 15641 | 1 |
| C | 0 | 11742 | 1 |
| D | 0 | 23161 | 1 |
| Quadrant | Total seconds | Saturated seconds | Saturation percentage |
|---|---|---|---|
| A | 5737 | 772 | 13.456510% |
| B | 5737 | 158 | 2.754053% |
| C | 5737 | 34 | 0.592644% |
| D | 5737 | 409 | 7.129162% |
Noise dominated data is calculated using 1-second bins in cleaned event files. If a bin has >2000 counts, and if more than 50% of those come from <1% of pixels, then it is considered to be noise-dominated and hence unusable.
| Quadrant | # 1 sec bins | Bins with >0 counts | Bins with >2000 counts | High rate bins dominated by noise | Noise dominated (total time) | Noise dominated (detector-on time) | Marked lightcurve |
|---|---|---|---|---|---|---|---|
| A | 6987 | 5737 | 599 | 599 | 8.57% | 10.44% | 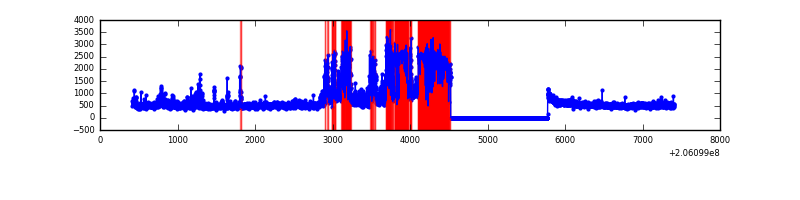 |
| B | 6987 | 5737 | 68 | 68 | 0.97% | 1.19% |  |
| C | 6987 | 5738 | 0 | 0 | 0.00% | 0.00% | 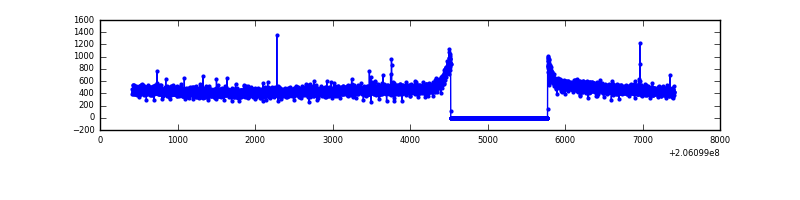 |
| D | 6987 | 5737 | 328 | 328 | 4.69% | 5.72% |  |
Top three noisy pixels from each quadrant. If the there are fewer than three noisy pixels in the level2.evt file, extra rows are filled as -1
| Pixel properties | Quadrant properties | ||||||
|---|---|---|---|---|---|---|---|
| Quadrant | DetID | PixID | Counts | Sigma | Mean | Median | Sigma |
| A | 0 | 199 | 1680870 | 12547.37 | 660 | 648 | 133.9 |
| A | 0 | 50 | 313298 | 2334.77 | 660 | 648 | 133.9 |
| A | 0 | 226 | 152864 | 1136.7 | 660 | 648 | 133.9 |
| B | 3 | 0 | 954306 | 7116.75 | 700 | 686 | 134.0 |
| B | 4 | 170 | 190381 | 1415.67 | 700 | 686 | 134.0 |
| B | 15 | 204 | 35489 | 259.73 | 700 | 686 | 134.0 |
| C | 13 | 61 | 5612 | 31.36 | 672 | 676 | 157.4 |
| C | 9 | 144 | 4351 | 23.35 | 672 | 676 | 157.4 |
| C | 9 | 54 | 3275 | 16.51 | 672 | 676 | 157.4 |
| D | 11 | 132 | 1923365 | 11762.93 | 669 | 649 | 163.5 |
| D | 2 | 232 | 1483223 | 9070.2 | 669 | 649 | 163.5 |
| D | 4 | 95 | 158042 | 962.91 | 669 | 649 | 163.5 |
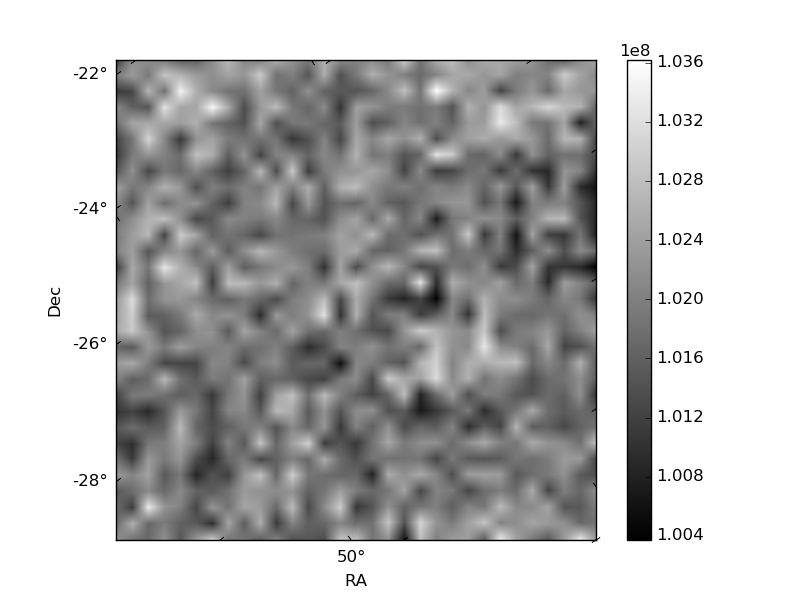
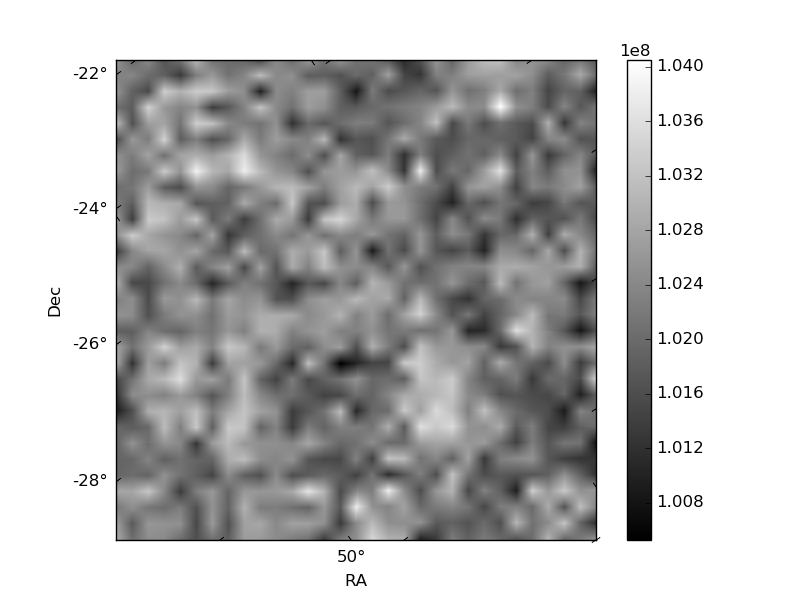
Histogram calculated using DETX and DETY for each event in the final _common_clean file
| Quadrant A | 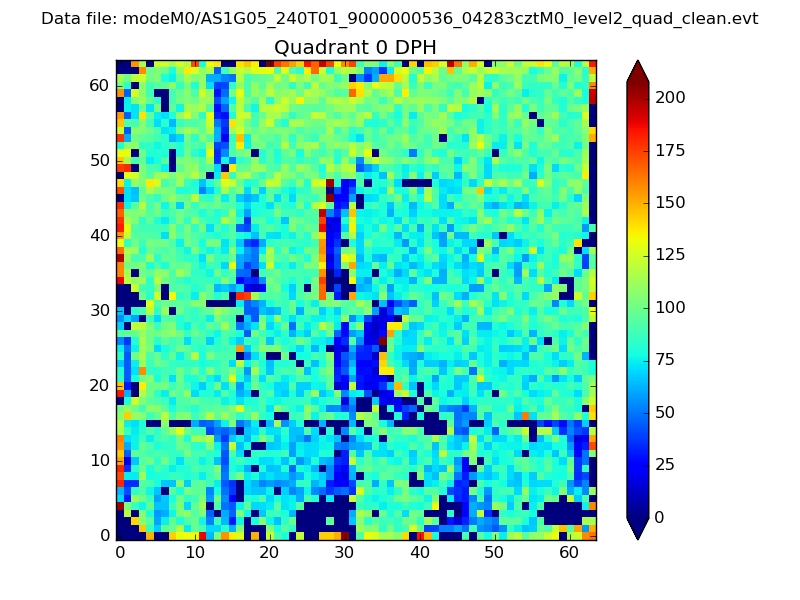 |
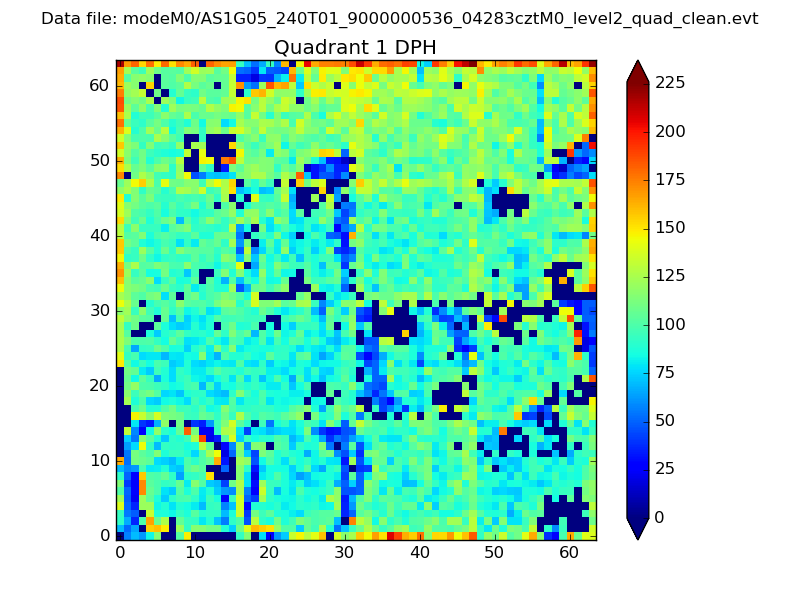 |
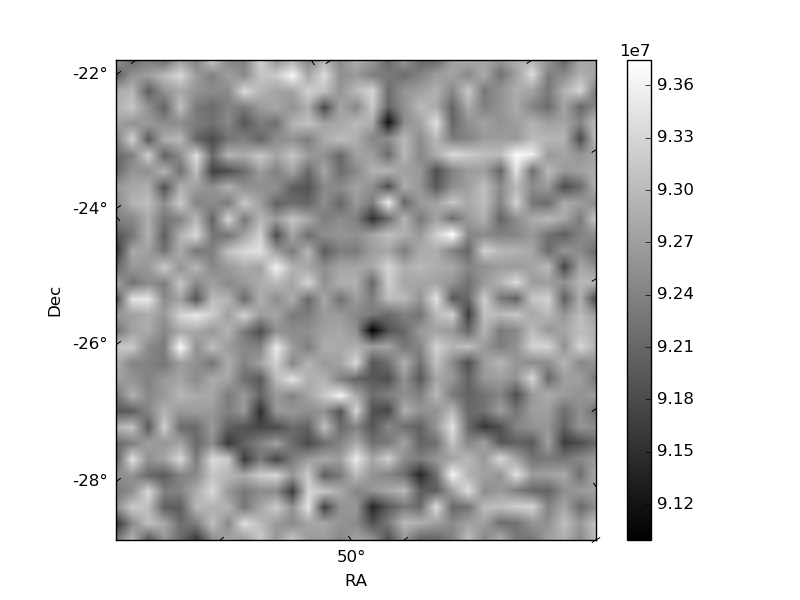
Quadrant B |
|---|---|---|---|
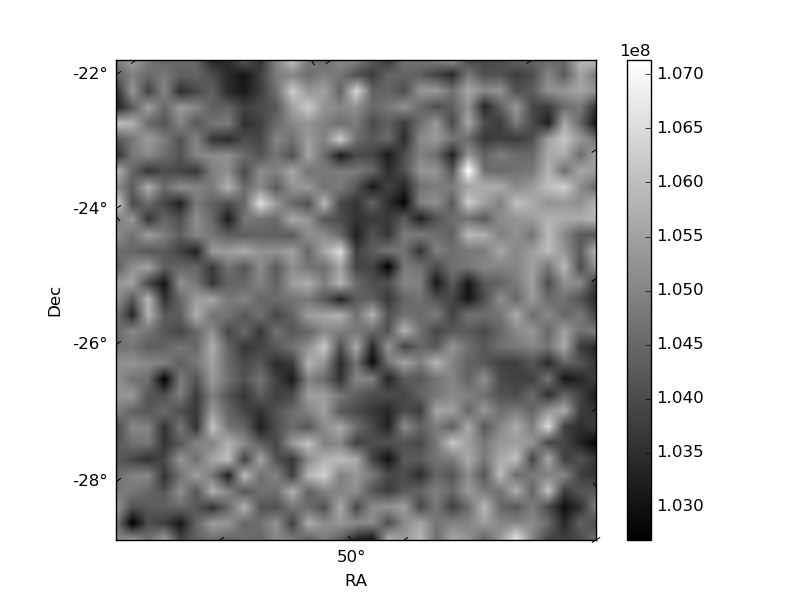
| Quadrant D |  |
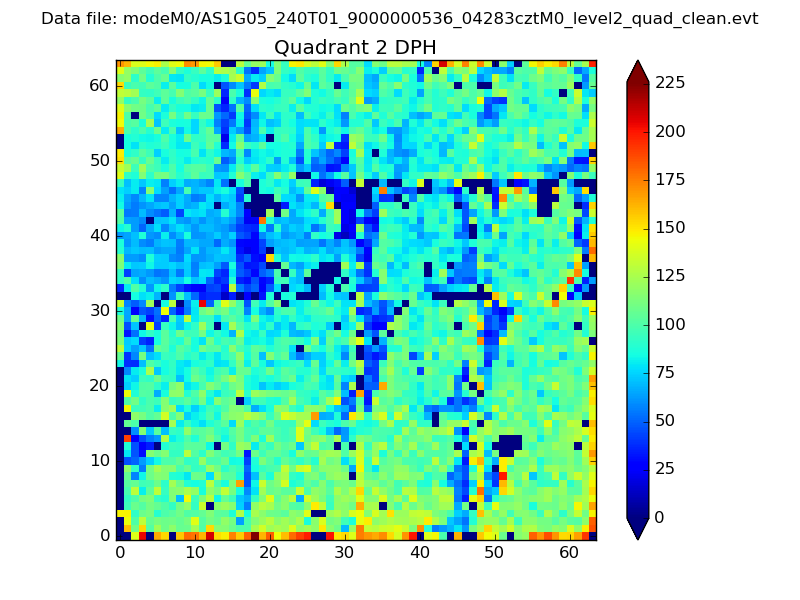 |
Quadrant C |
| Plot type | Count rate plots | Images |
|---|---|---|
| Comparison with Poisson distribution Blue bars denote a histogram of data divided into 1 sec bins. Red curve is a Poisson curve with rate = median count rate of data. |
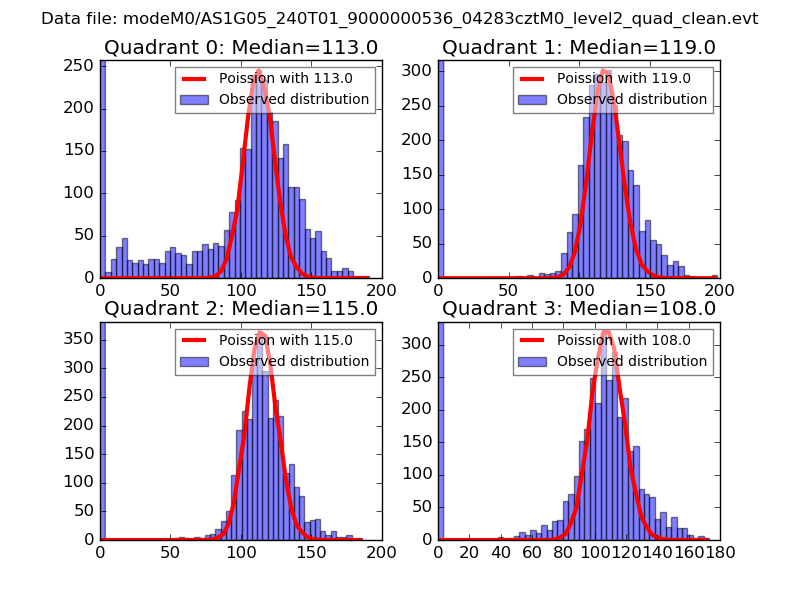 |
 |
| Quadrant-wise count rates Data is divided into 100 sec bins |
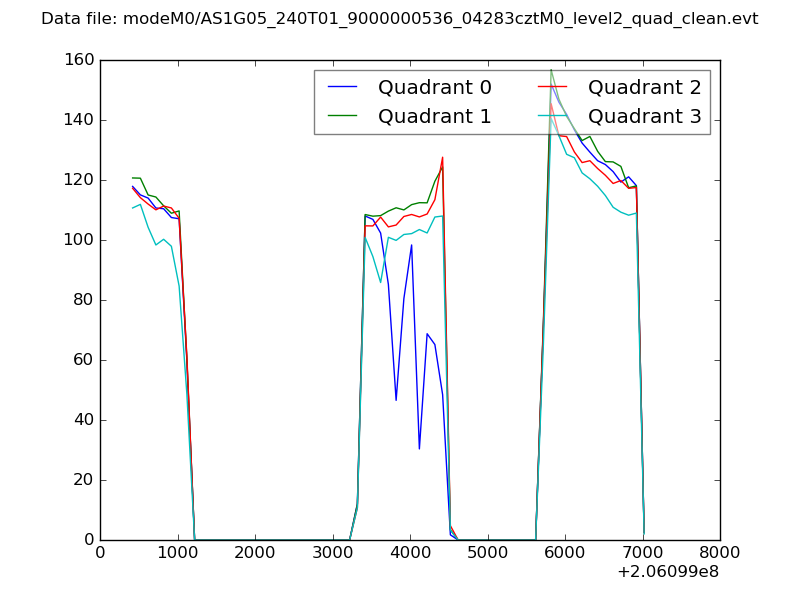 |
|
| Module-wise count rates for Quadrant A Data is divided into 100 sec bins |
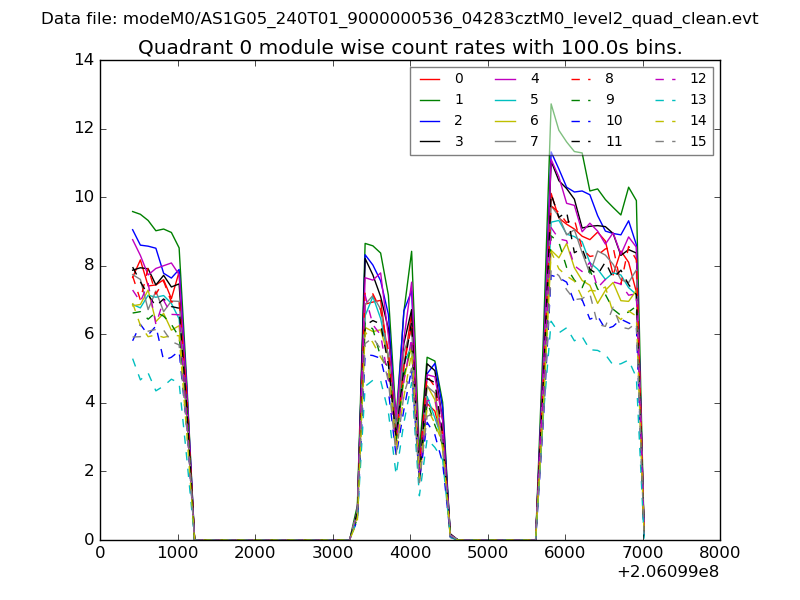 |
 |
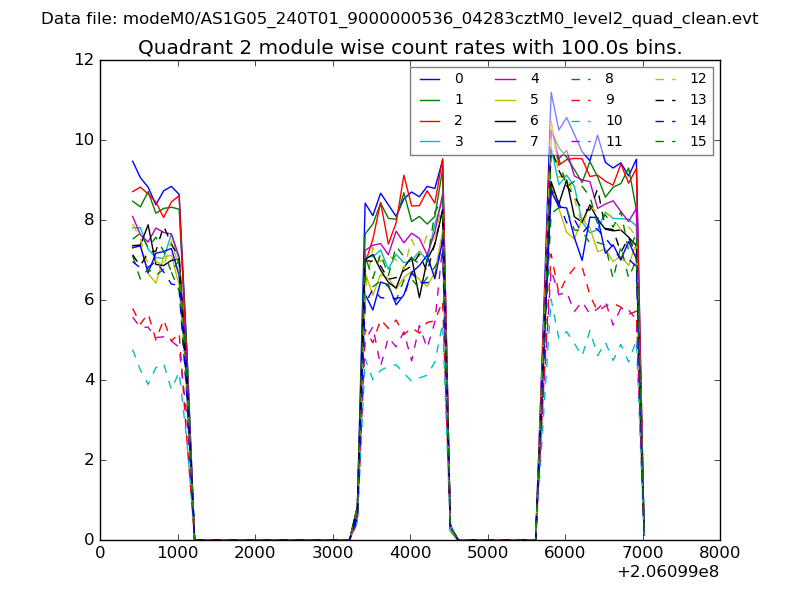
| Module-wise count rates for Quadrant B Data is divided into 100 sec bins |
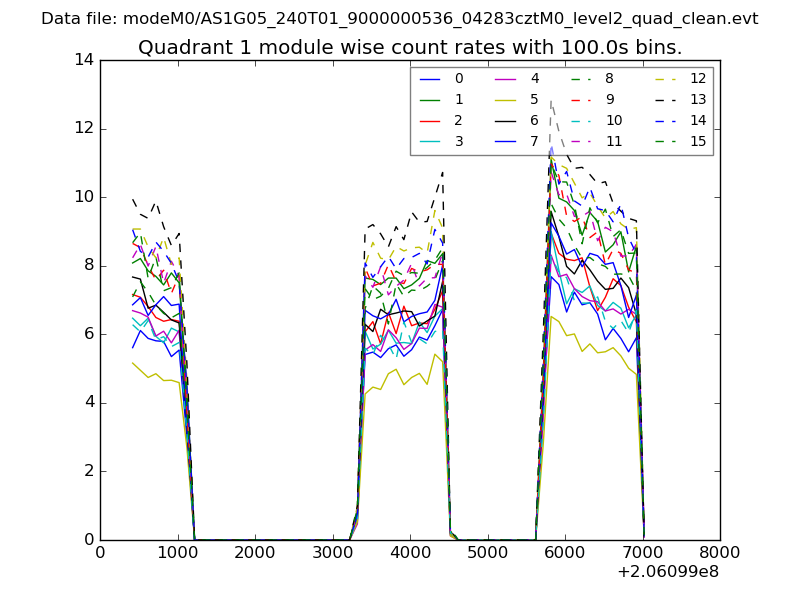 |
 |
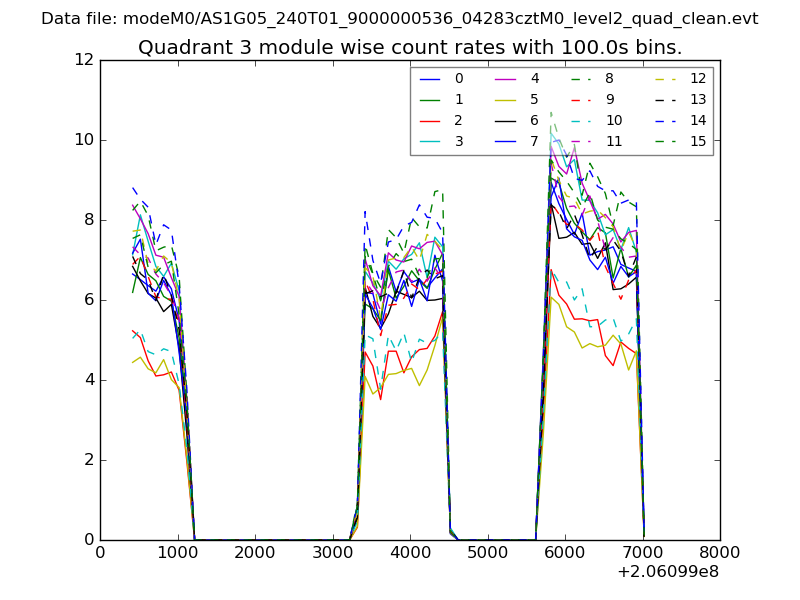
| Module-wise count rates for Quadrant C Data is divided into 100 sec bins |
 |
 |
| Module-wise count rates for Quadrant D Data is divided into 100 sec bins |
 |
 |
| Parameter | Plot |
|---|---|
| CZT HV Monitor | 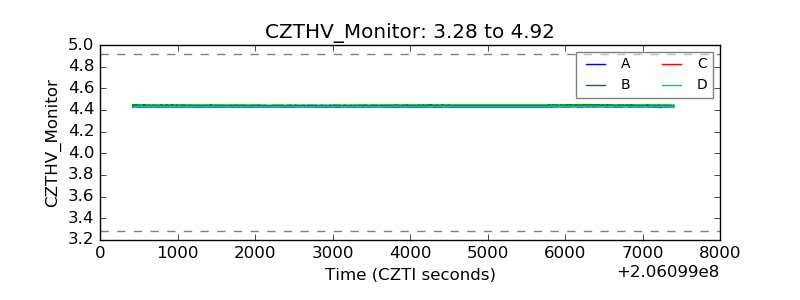 |
| D_VDD | 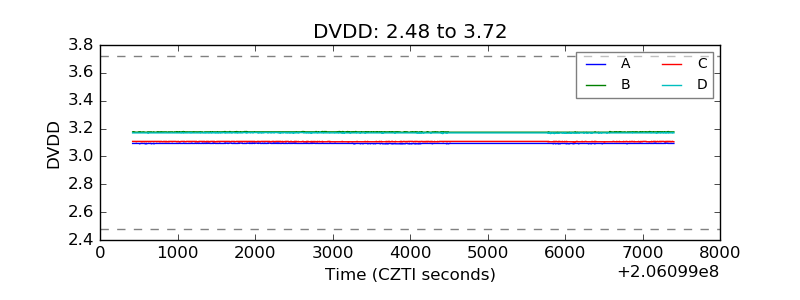 |
| Temperature 1 | 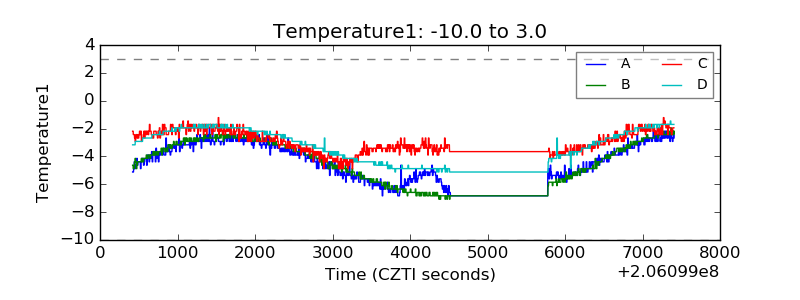 |
| Veto HV Monitor |  |
| Veto LLD | 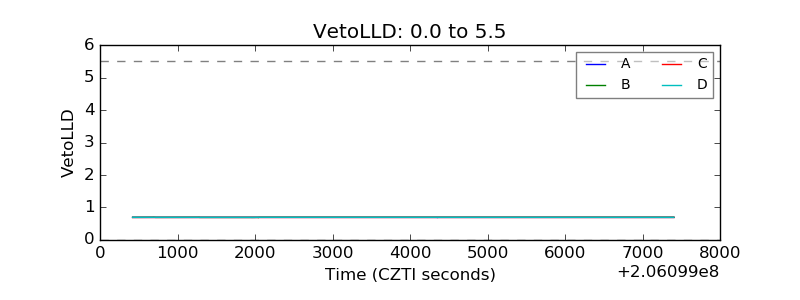 |
| Alpha Counter | 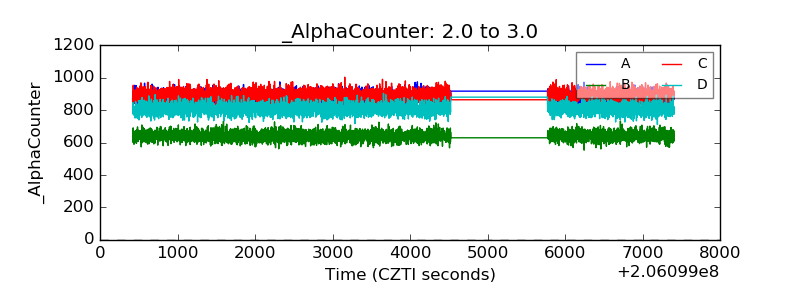 |
| _CPM_Rate | 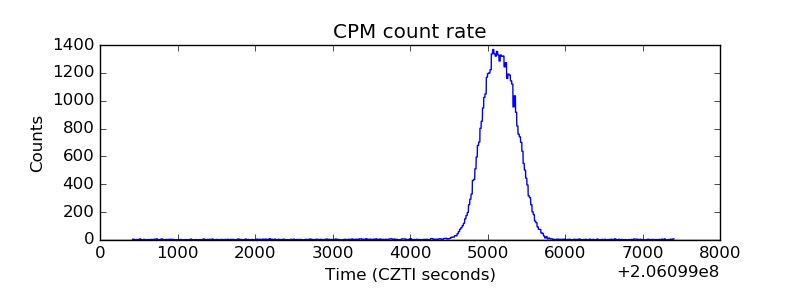 |
| CZT Counter | 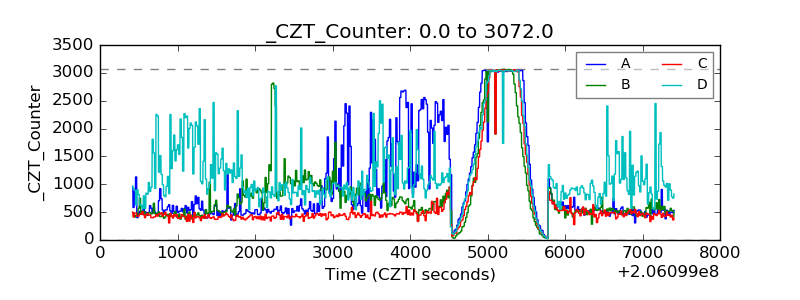 |
| +2.5 Volts monitor | 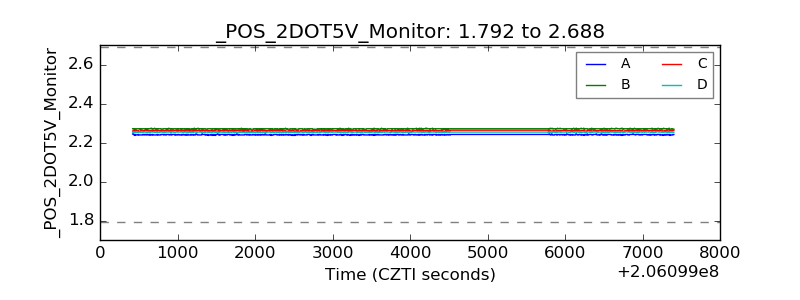 |
| +5 Volts monitor |  |
| _ROLL_ROT | 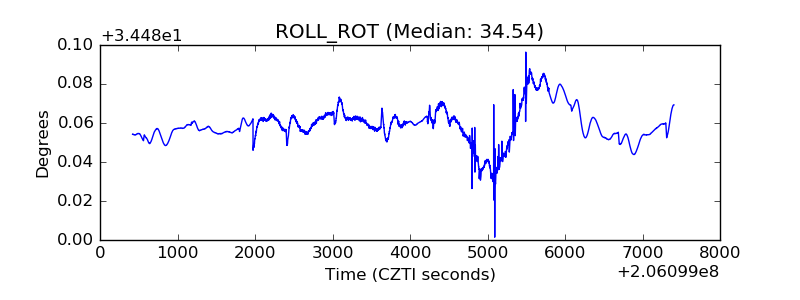 |
| _Roll_DEC | 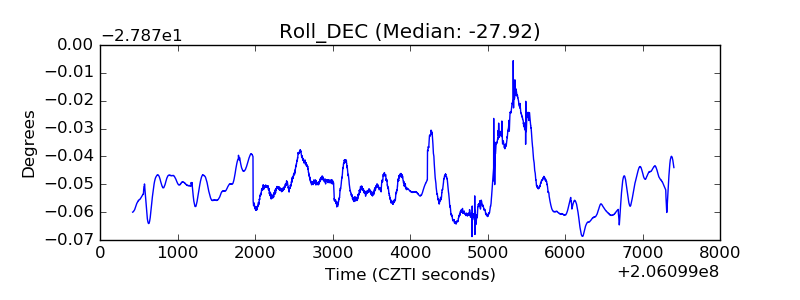 |
| _Roll_RA | 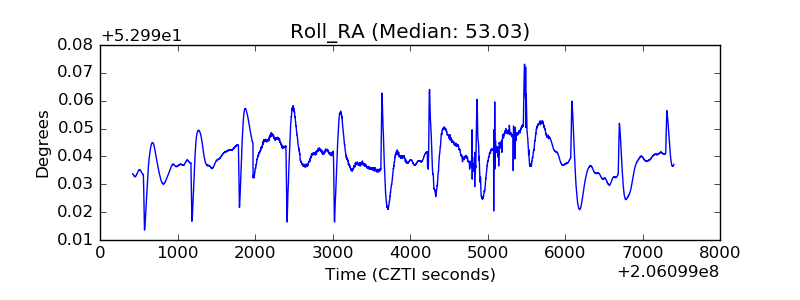 |
| Veto Counter | 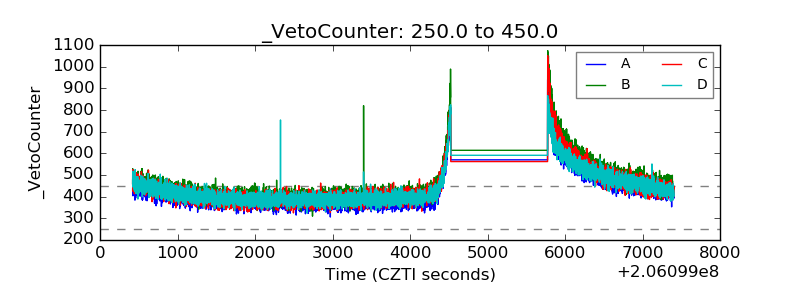 |