| Param | Original file | Final file |
|---|---|---|
| Filename | modeM0/AS1G05_240T01_9000000536_04284cztM0_level2.evt | modeM0/AS1G05_240T01_9000000536_04284cztM0_level2_quad_clean.evt |
| Size (bytes) | 567,112,320 | 57,608,640 |
| Size | 540.8 MB | 54.9 MB |
| Events in quadrant A | 3,577,864 | 341,842 |
| Events in quadrant B | 3,902,394 | 348,988 |
| Events in quadrant C | 2,712,681 | 338,459 |
| Events in quadrant D | 6,587,966 | 307,276 |
| Mode SS | |||
|---|---|---|---|
| Quadrant | BADHDUFLAG | Total packets | Discarded packets |
| A | 0 | 118 | 0 |
| B | 0 | 118 | 0 |
| C | 0 | 118 | 0 |
| D | 0 | 118 | 0 |
| Mode M9 | |||
|---|---|---|---|
| Quadrant | BADHDUFLAG | Total packets | Discarded packets |
| A | 0 | 13 | 0 |
| B | 0 | 13 | 0 |
| C | 0 | 13 | 0 |
| D | 0 | 13 | 0 |
| Mode M0 | |||
|---|---|---|---|
| Quadrant | BADHDUFLAG | Total packets | Discarded packets |
| A | 0 | 14206 | 2 |
| B | 0 | 15510 | 1 |
| C | 0 | 11970 | 1 |
| D | 0 | 23692 | 1 |
| Quadrant | Total seconds | Saturated seconds | Saturation percentage |
|---|---|---|---|
| A | 5829 | 201 | 3.448276% |
| B | 5829 | 125 | 2.144450% |
| C | 5829 | 67 | 1.149425% |
| D | 5829 | 552 | 9.469892% |
Noise dominated data is calculated using 1-second bins in cleaned event files. If a bin has >2000 counts, and if more than 50% of those come from <1% of pixels, then it is considered to be noise-dominated and hence unusable.
| Quadrant | # 1 sec bins | Bins with >0 counts | Bins with >2000 counts | High rate bins dominated by noise | Noise dominated (total time) | Noise dominated (detector-on time) | Marked lightcurve |
|---|---|---|---|---|---|---|---|
| A | 7099 | 5829 | 71 | 71 | 1.00% | 1.22% |  |
| B | 7099 | 5829 | 7 | 7 | 0.10% | 0.12% | 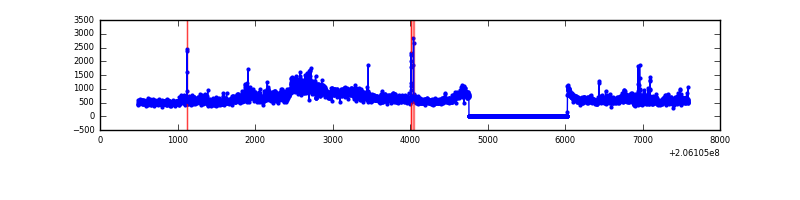 |
| C | 7099 | 5829 | 1 | 1 | 0.01% | 0.02% | 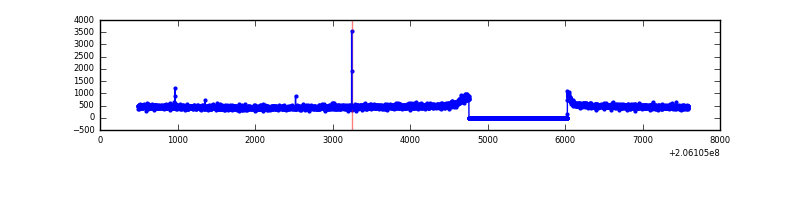 |
| D | 7099 | 5829 | 387 | 387 | 5.45% | 6.64% |  |
Top three noisy pixels from each quadrant. If the there are fewer than three noisy pixels in the level2.evt file, extra rows are filled as -1
| Pixel properties | Quadrant properties | ||||||
|---|---|---|---|---|---|---|---|
| Quadrant | DetID | PixID | Counts | Sigma | Mean | Median | Sigma |
| A | 0 | 199 | 360131 | 2426.23 | 725 | 709 | 148.1 |
| A | 8 | 15 | 216355 | 1455.69 | 725 | 709 | 148.1 |
| A | 0 | 50 | 93494 | 626.33 | 725 | 709 | 148.1 |
| B | 3 | 0 | 660434 | 4730.58 | 727 | 712 | 139.5 |
| B | 15 | 204 | 272504 | 1948.9 | 727 | 712 | 139.5 |
| B | 14 | 167 | 94030 | 669.14 | 727 | 712 | 139.5 |
| C | 7 | 174 | 5880 | 32.13 | 692 | 696 | 161.4 |
| C | 13 | 61 | 5608 | 30.44 | 692 | 696 | 161.4 |
| C | 10 | 21 | 2288 | 9.87 | 692 | 696 | 161.4 |
| D | 2 | 232 | 1773685 | 11045.43 | 676 | 657 | 160.5 |
| D | 11 | 132 | 1770792 | 11027.41 | 676 | 657 | 160.5 |
| D | 13 | 239 | 369125 | 2295.44 | 676 | 657 | 160.5 |
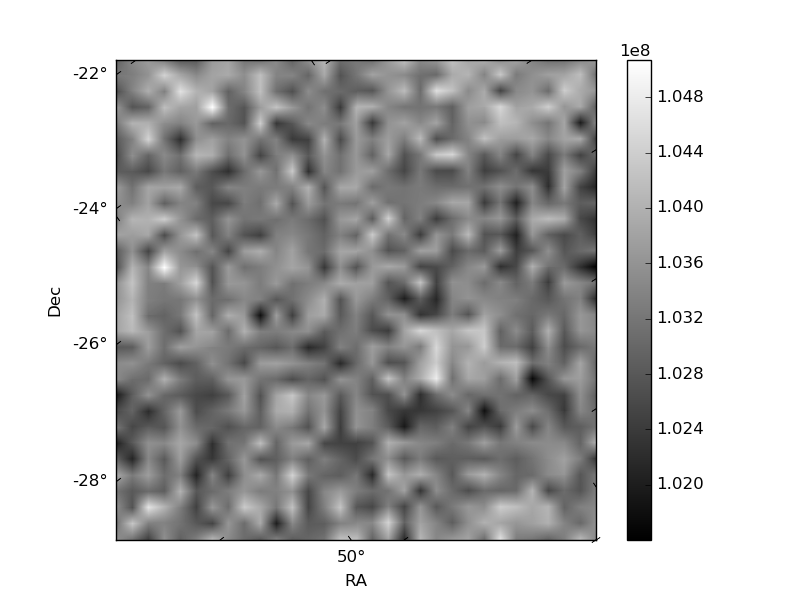
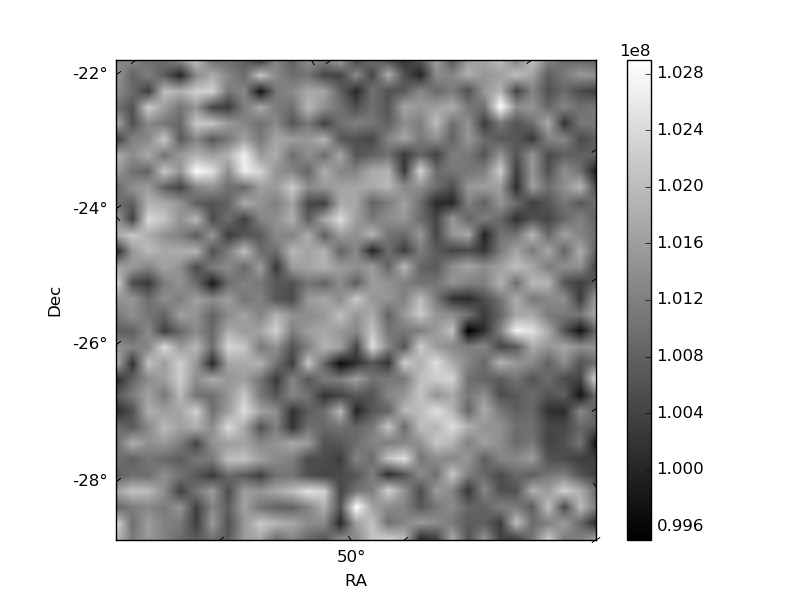
Histogram calculated using DETX and DETY for each event in the final _common_clean file
| Quadrant A | 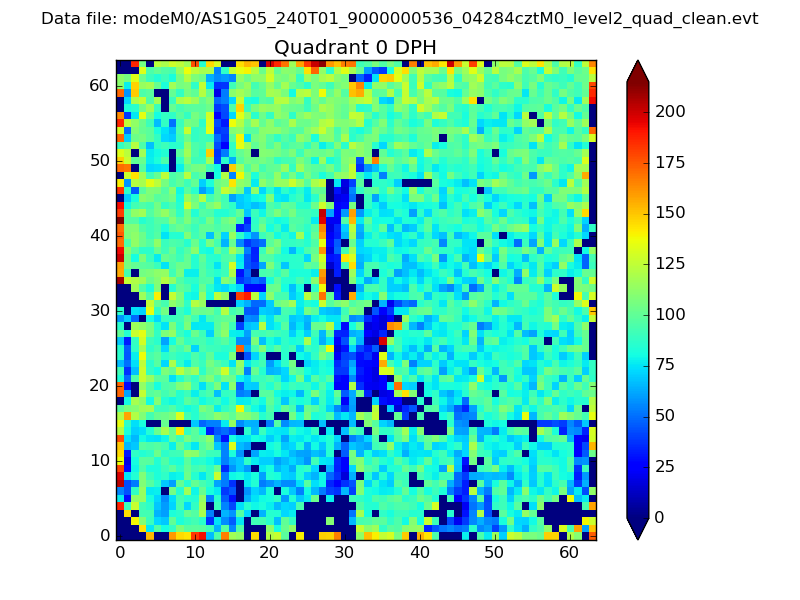 |
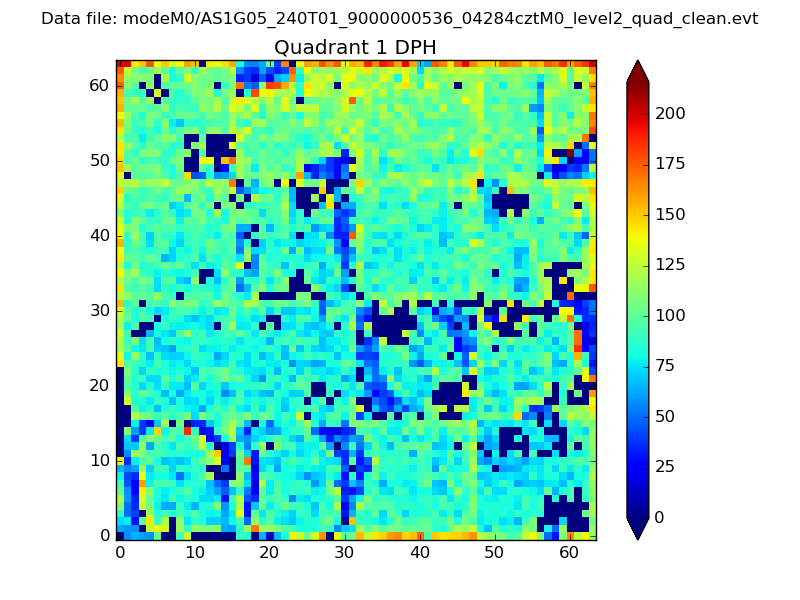 |
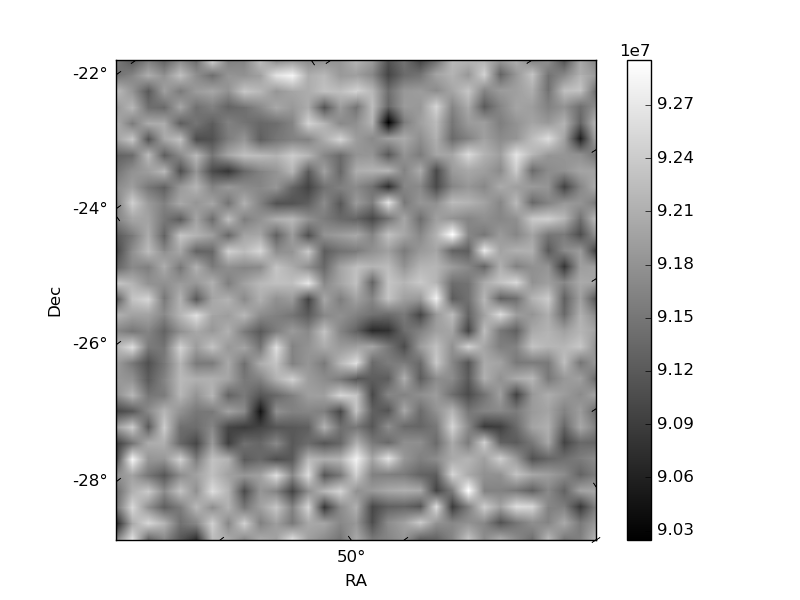
Quadrant B |
|---|---|---|---|
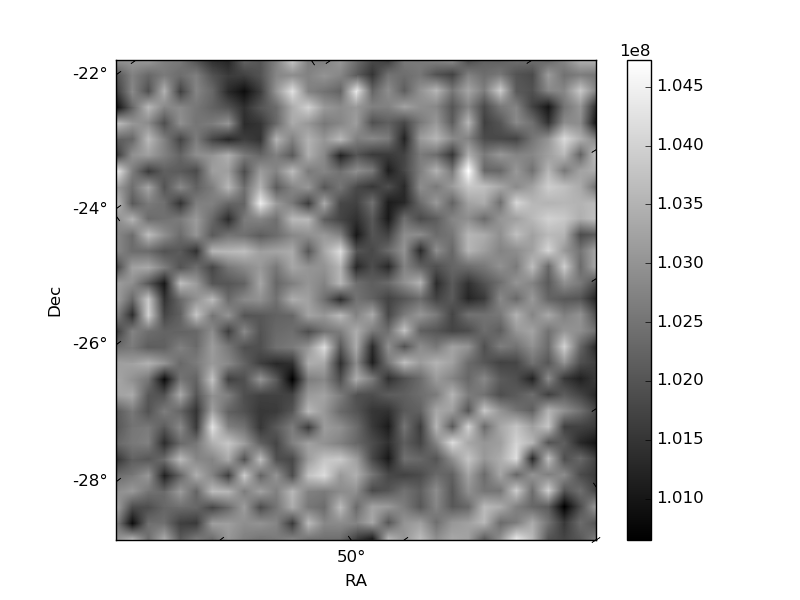
| Quadrant D |  |
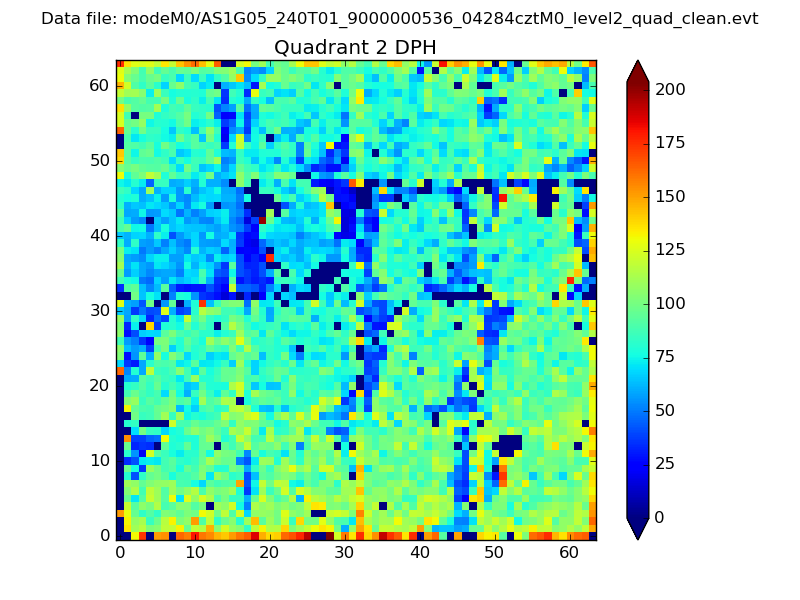 |
Quadrant C |
| Plot type | Count rate plots | Images |
|---|---|---|
| Comparison with Poisson distribution Blue bars denote a histogram of data divided into 1 sec bins. Red curve is a Poisson curve with rate = median count rate of data. |
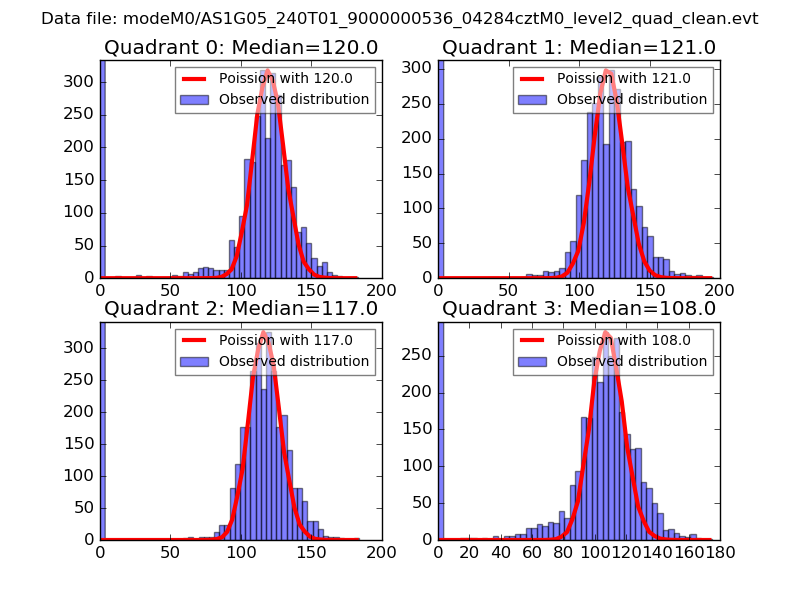 |
 |
| Quadrant-wise count rates Data is divided into 100 sec bins |
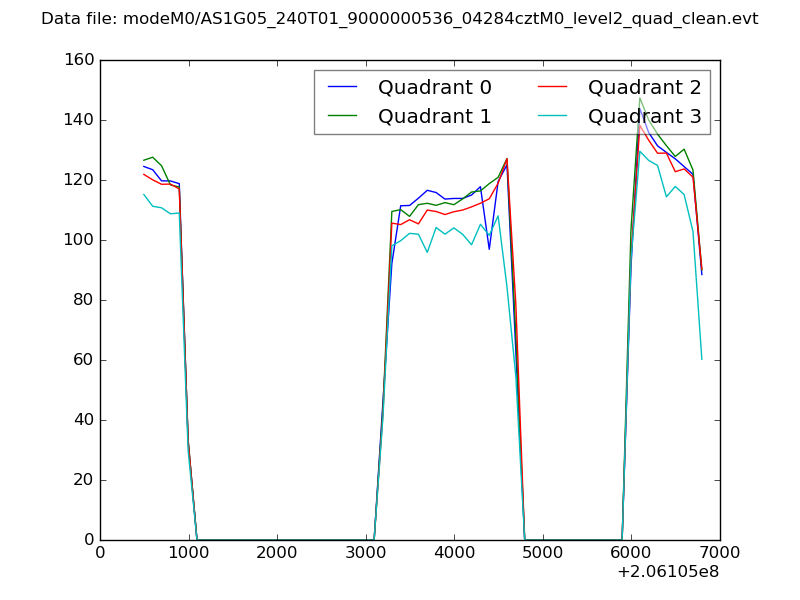 |
|
| Module-wise count rates for Quadrant A Data is divided into 100 sec bins |
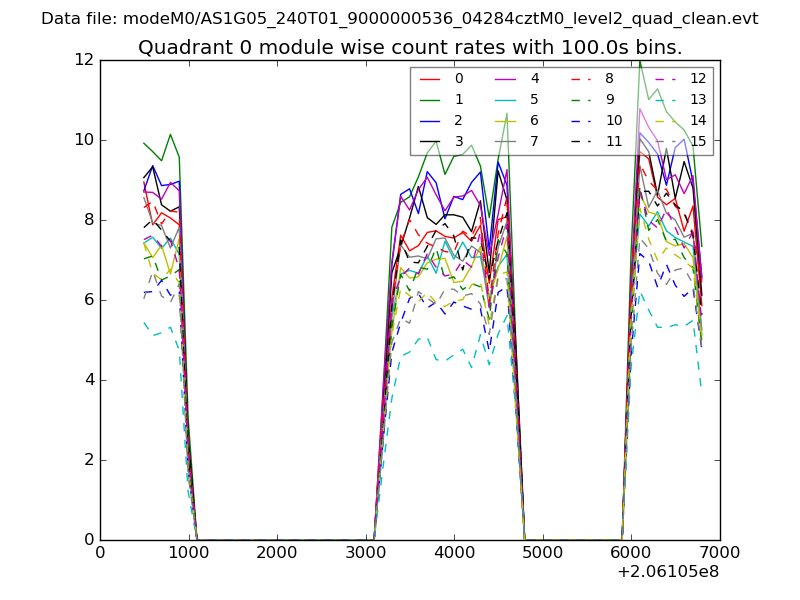 |
 |
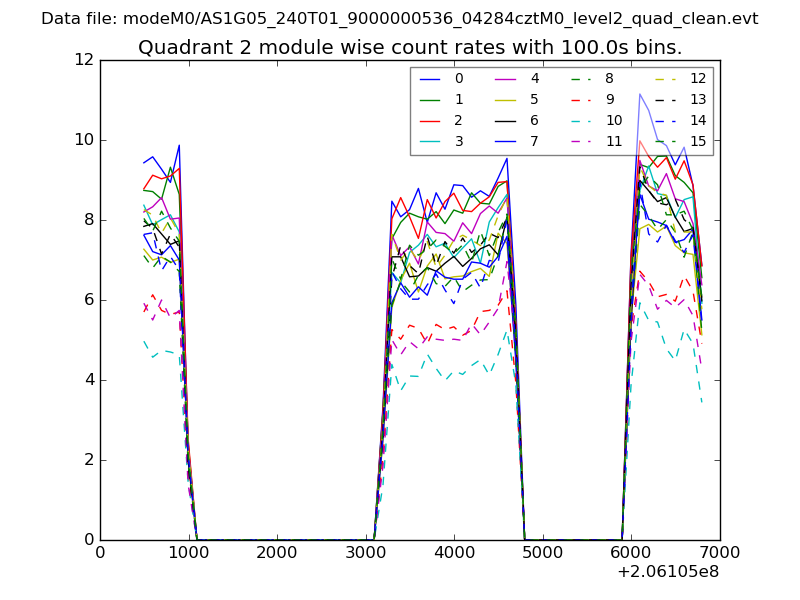
| Module-wise count rates for Quadrant B Data is divided into 100 sec bins |
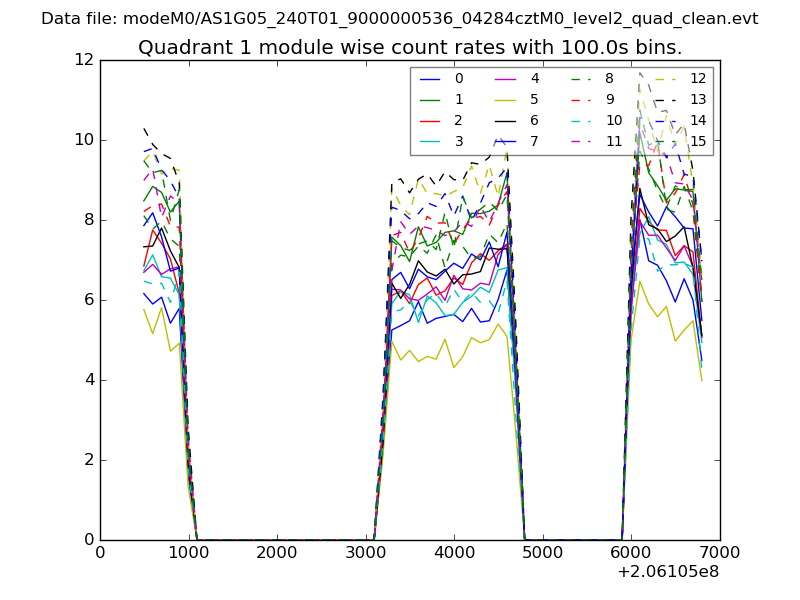 |
 |
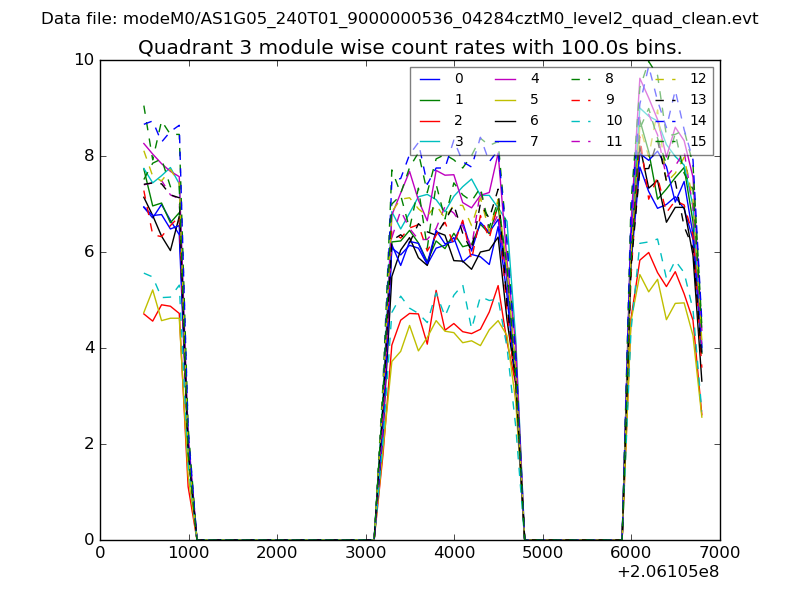
| Module-wise count rates for Quadrant C Data is divided into 100 sec bins |
 |
 |
| Module-wise count rates for Quadrant D Data is divided into 100 sec bins |
 |
 |
| Parameter | Plot |
|---|---|
| CZT HV Monitor | 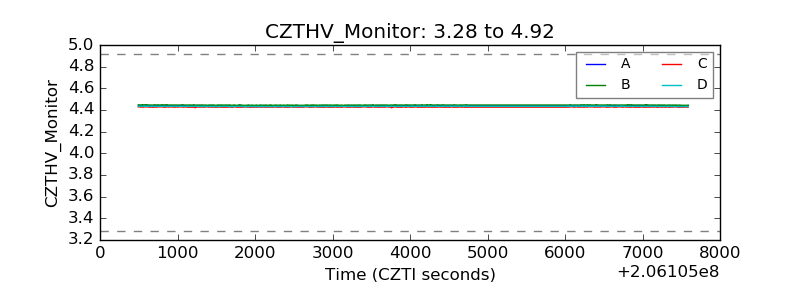 |
| D_VDD | 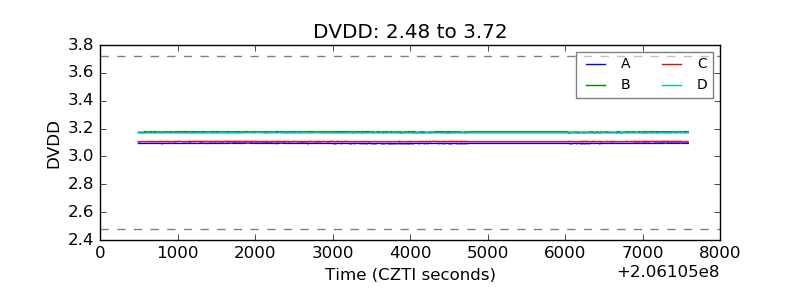 |
| Temperature 1 | 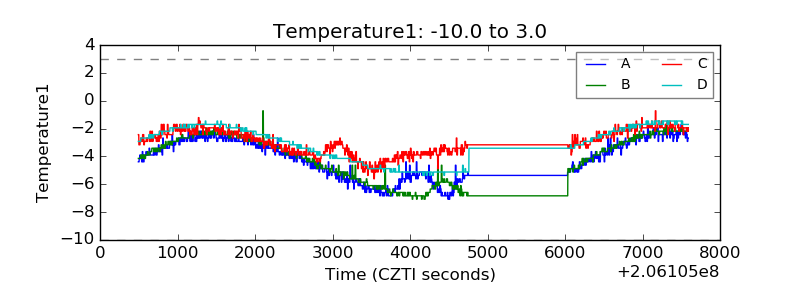 |
| Veto HV Monitor | 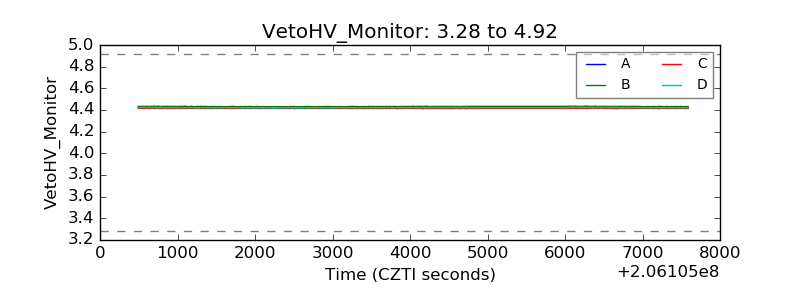 |
| Veto LLD | 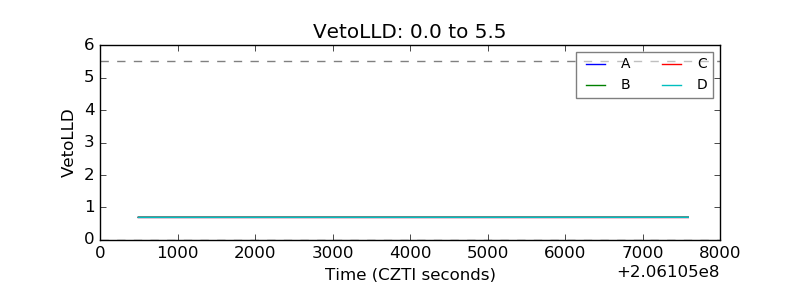 |
| Alpha Counter | 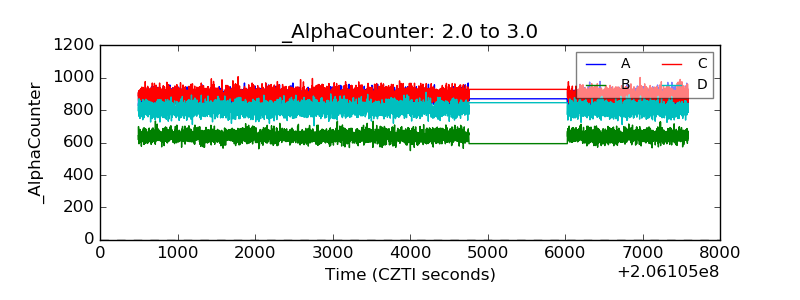 |
| _CPM_Rate | 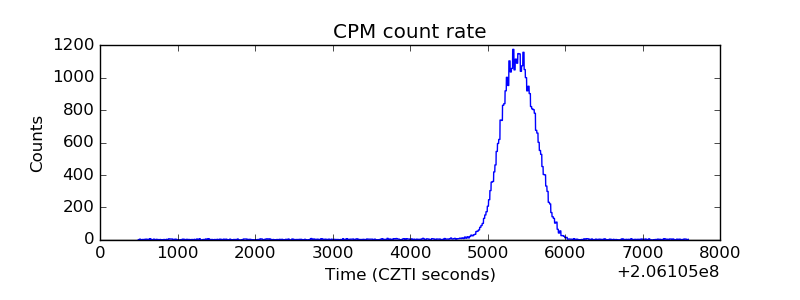 |
| CZT Counter | 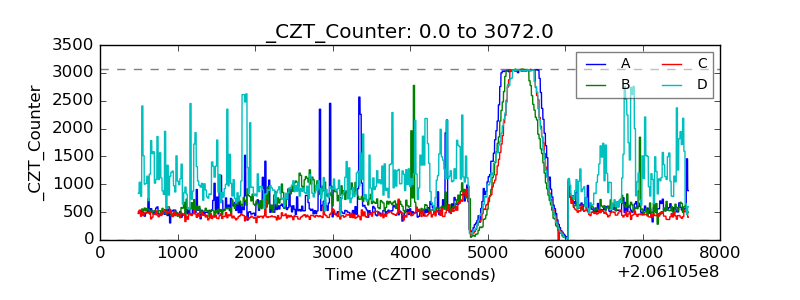 |
| +2.5 Volts monitor | 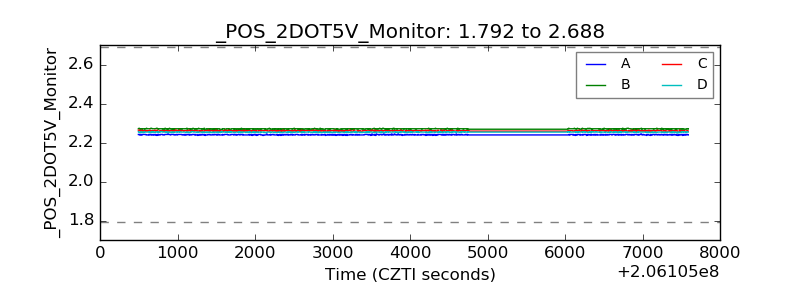 |
| +5 Volts monitor |  |
| _ROLL_ROT | 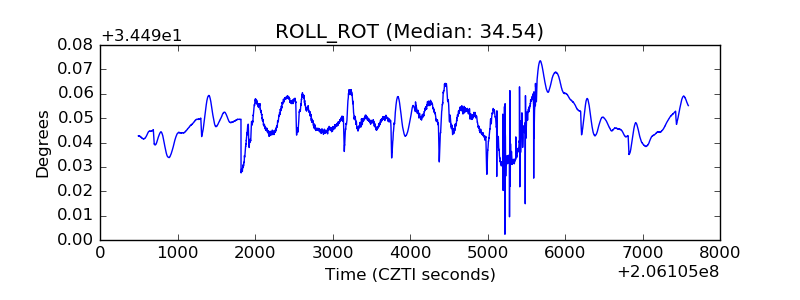 |
| _Roll_DEC | 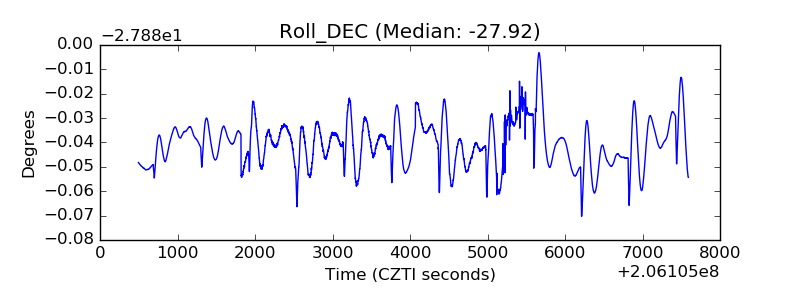 |
| _Roll_RA | 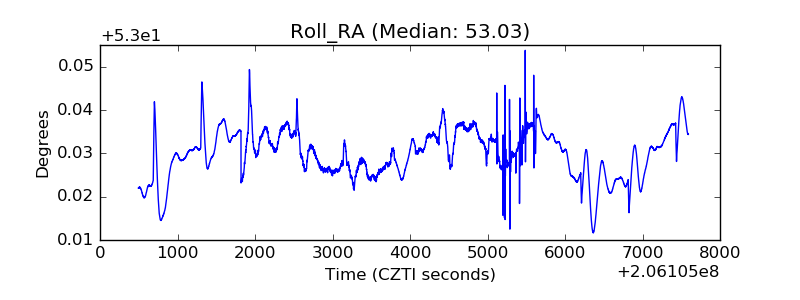 |
| Veto Counter | 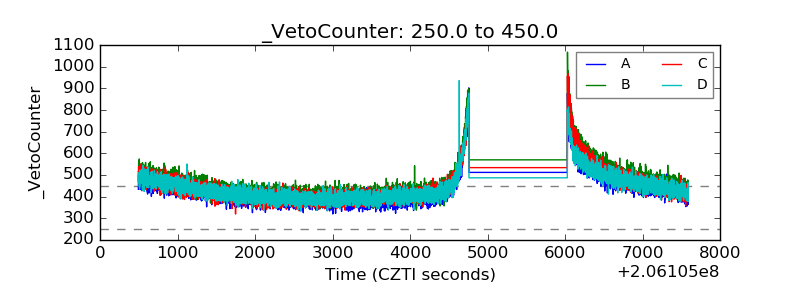 |