| Param | Original file | Final file |
|---|---|---|
| Filename | modeM0/AS1G05_240T01_9000000536_04285cztM0_level2.evt | modeM0/AS1G05_240T01_9000000536_04285cztM0_level2_quad_clean.evt |
| Size (bytes) | 465,410,880 | 59,670,720 |
| Size | 443.9 MB | 56.9 MB |
| Events in quadrant A | 3,118,008 | 367,240 |
| Events in quadrant B | 2,901,682 | 370,571 |
| Events in quadrant C | 2,479,270 | 359,917 |
| Events in quadrant D | 5,233,809 | 334,790 |
| Mode SS | |||
|---|---|---|---|
| Quadrant | BADHDUFLAG | Total packets | Discarded packets |
| A | 0 | 112 | 0 |
| B | 0 | 112 | 0 |
| C | 0 | 112 | 0 |
| D | 0 | 112 | 0 |
| Mode M9 | |||
|---|---|---|---|
| Quadrant | BADHDUFLAG | Total packets | Discarded packets |
| A | 0 | 12 | 0 |
| B | 0 | 12 | 0 |
| C | 0 | 12 | 0 |
| D | 0 | 12 | 0 |
| Mode M0 | |||
|---|---|---|---|
| Quadrant | BADHDUFLAG | Total packets | Discarded packets |
| A | 0 | 12616 | 2 |
| B | 0 | 11918 | 2 |
| C | 0 | 10940 | 2 |
| D | 0 | 19296 | 2 |
| Quadrant | Total seconds | Saturated seconds | Saturation percentage |
|---|---|---|---|
| A | 5328 | 164 | 3.078078% |
| B | 5328 | 91 | 1.707958% |
| C | 5328 | 36 | 0.675676% |
| D | 5328 | 308 | 5.780781% |
Noise dominated data is calculated using 1-second bins in cleaned event files. If a bin has >2000 counts, and if more than 50% of those come from <1% of pixels, then it is considered to be noise-dominated and hence unusable.
| Quadrant | # 1 sec bins | Bins with >0 counts | Bins with >2000 counts | High rate bins dominated by noise | Noise dominated (total time) | Noise dominated (detector-on time) | Marked lightcurve |
|---|---|---|---|---|---|---|---|
| A | 6603 | 5328 | 71 | 71 | 1.08% | 1.33% | 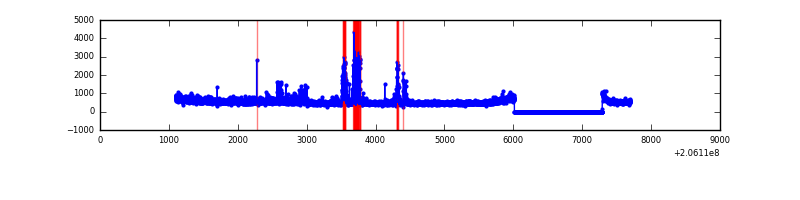 |
| B | 6603 | 5328 | 2 | 2 | 0.03% | 0.04% |  |
| C | 6603 | 5329 | 0 | 0 | 0.00% | 0.00% |  |
| D | 6603 | 5328 | 203 | 203 | 3.07% | 3.81% |  |
Top three noisy pixels from each quadrant. If the there are fewer than three noisy pixels in the level2.evt file, extra rows are filled as -1
| Pixel properties | Quadrant properties | ||||||
|---|---|---|---|---|---|---|---|
| Quadrant | DetID | PixID | Counts | Sigma | Mean | Median | Sigma |
| A | 8 | 15 | 273720 | 2030.65 | 660 | 647 | 134.5 |
| A | 13 | 248 | 214778 | 1592.34 | 660 | 647 | 134.5 |
| A | 0 | 50 | 53463 | 392.75 | 660 | 647 | 134.5 |
| B | 15 | 204 | 141664 | 1100.59 | 666 | 651 | 128.1 |
| B | 14 | 167 | 63314 | 489.08 | 666 | 651 | 128.1 |
| B | 3 | 0 | 45527 | 350.25 | 666 | 651 | 128.1 |
| C | 10 | 65 | 6801 | 41.86 | 632 | 634 | 147.3 |
| C | 13 | 61 | 5232 | 31.21 | 632 | 634 | 147.3 |
| C | 12 | 4 | 2186 | 10.54 | 632 | 634 | 147.3 |
| D | 11 | 132 | 1275819 | 8427.65 | 627 | 609 | 151.3 |
| D | 2 | 232 | 1119273 | 7393.06 | 627 | 609 | 151.3 |
| D | 13 | 239 | 297468 | 1961.89 | 627 | 609 | 151.3 |
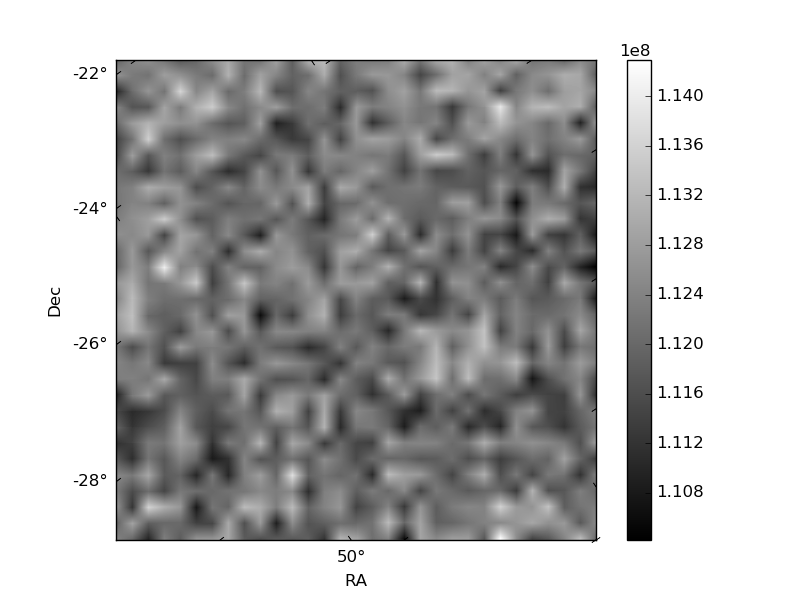
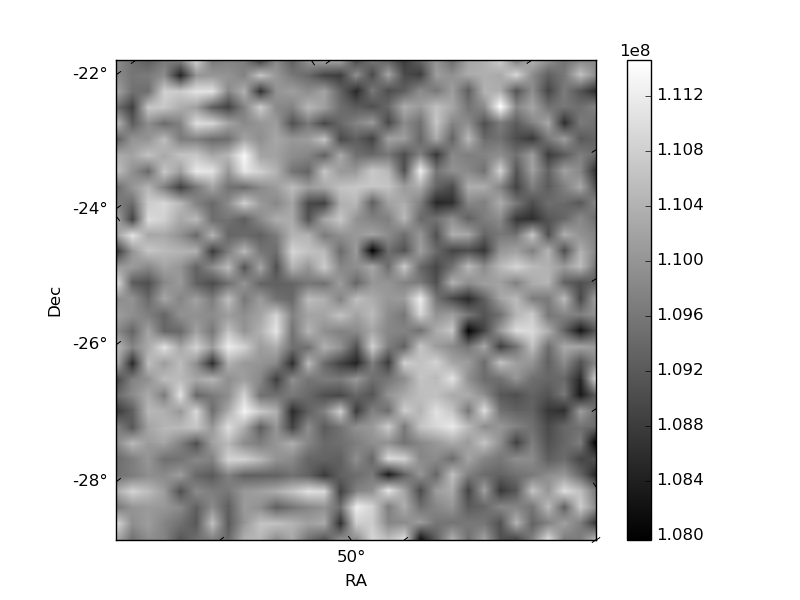
Histogram calculated using DETX and DETY for each event in the final _common_clean file
| Quadrant A | 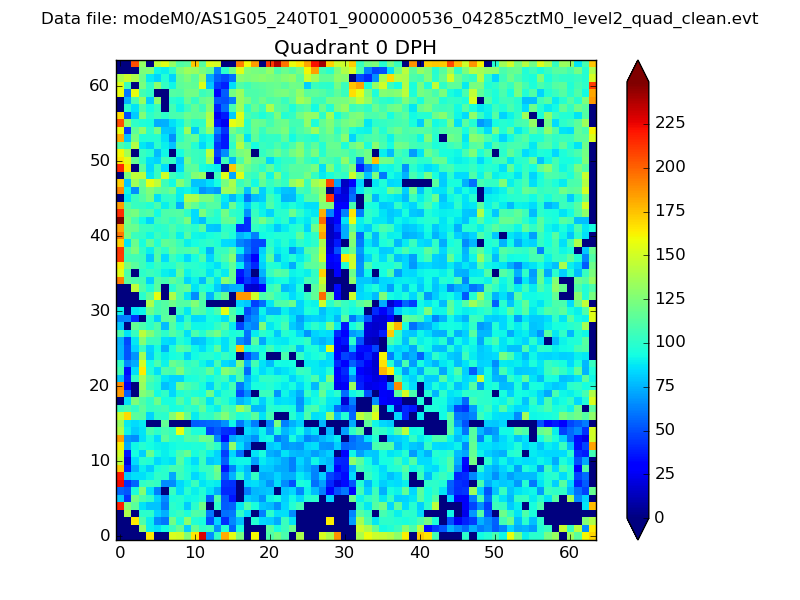 |
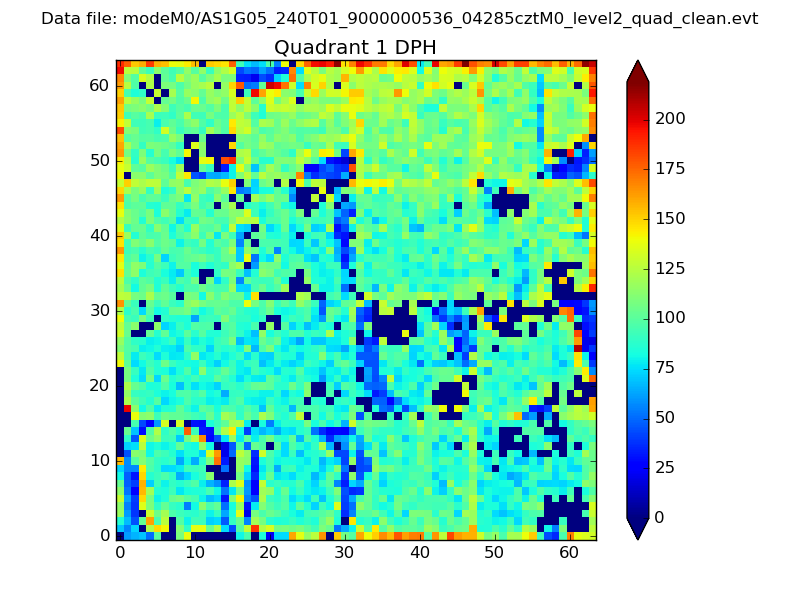 |
Quadrant B |
|---|---|---|---|
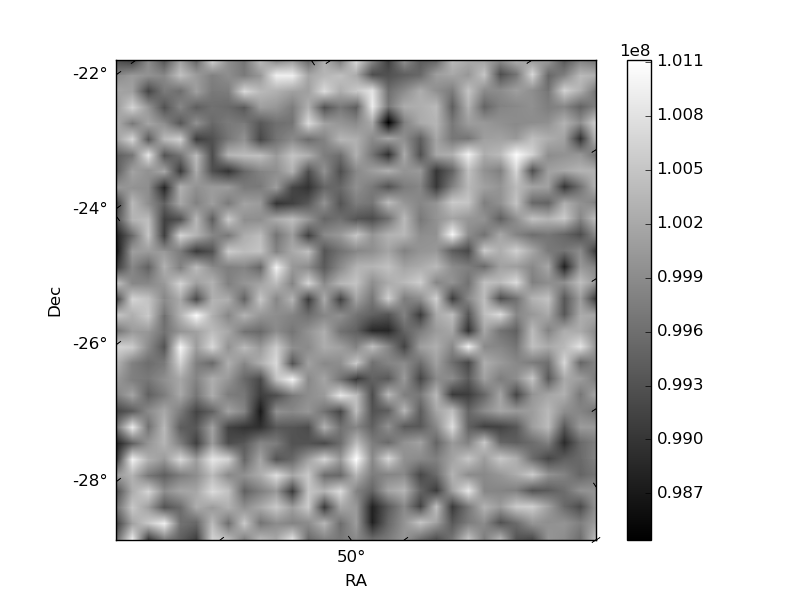
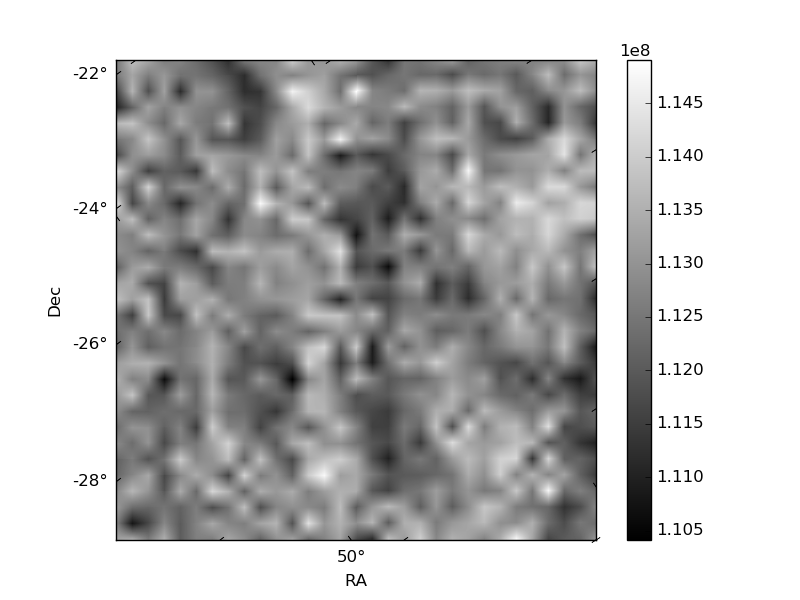
| Quadrant D | 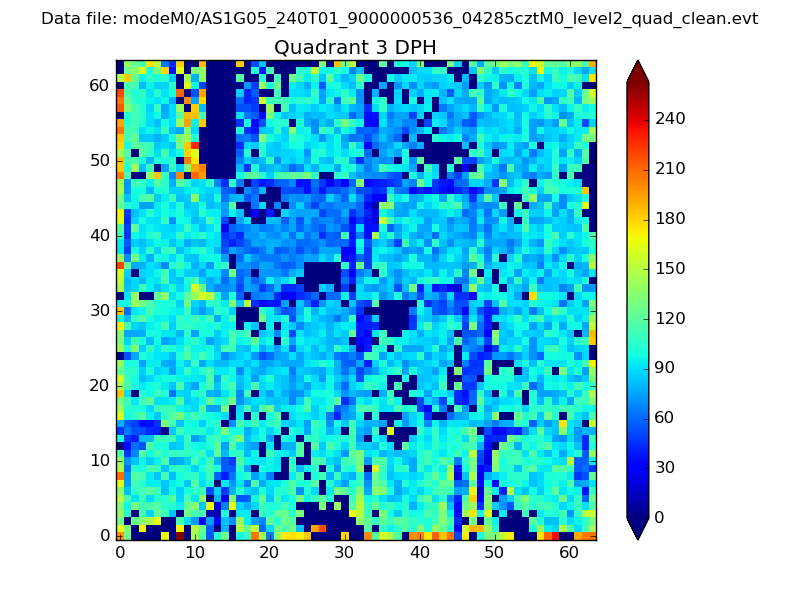 |
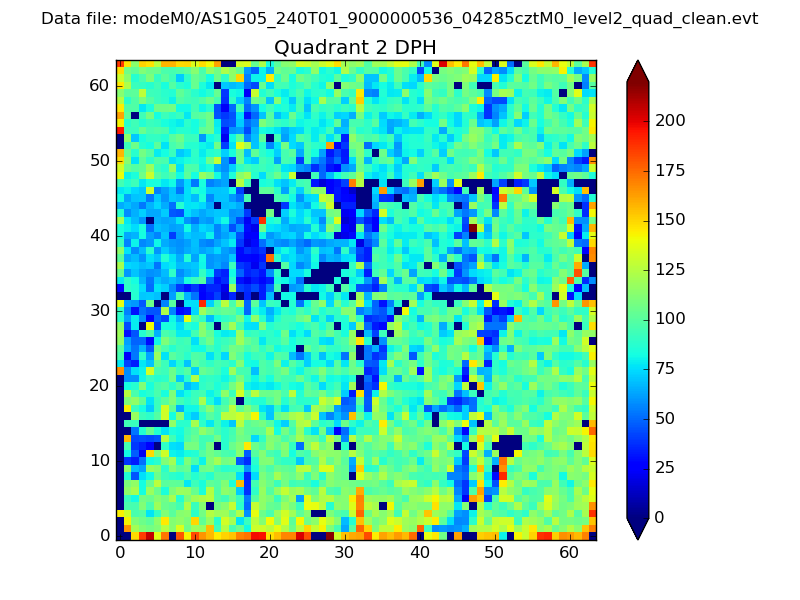 |
Quadrant C |
| Plot type | Count rate plots | Images |
|---|---|---|
| Comparison with Poisson distribution Blue bars denote a histogram of data divided into 1 sec bins. Red curve is a Poisson curve with rate = median count rate of data. |
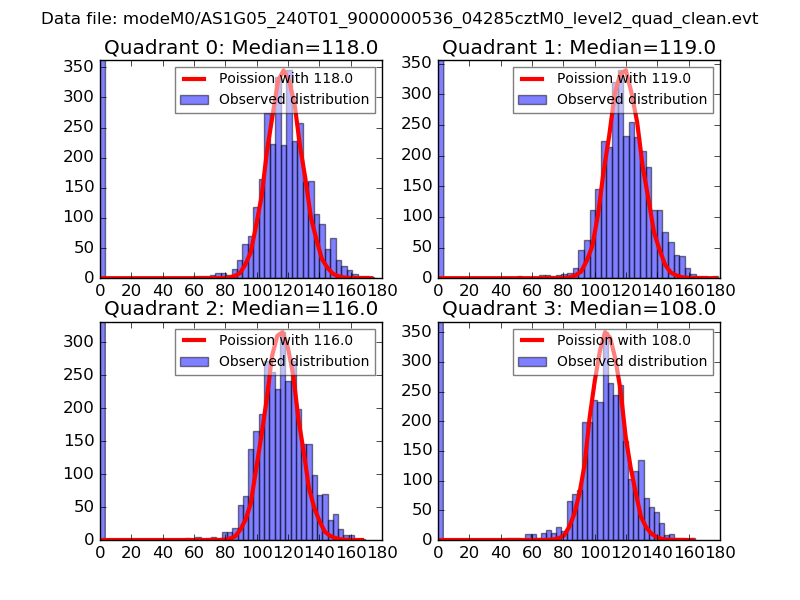 |
 |
| Quadrant-wise count rates Data is divided into 100 sec bins |
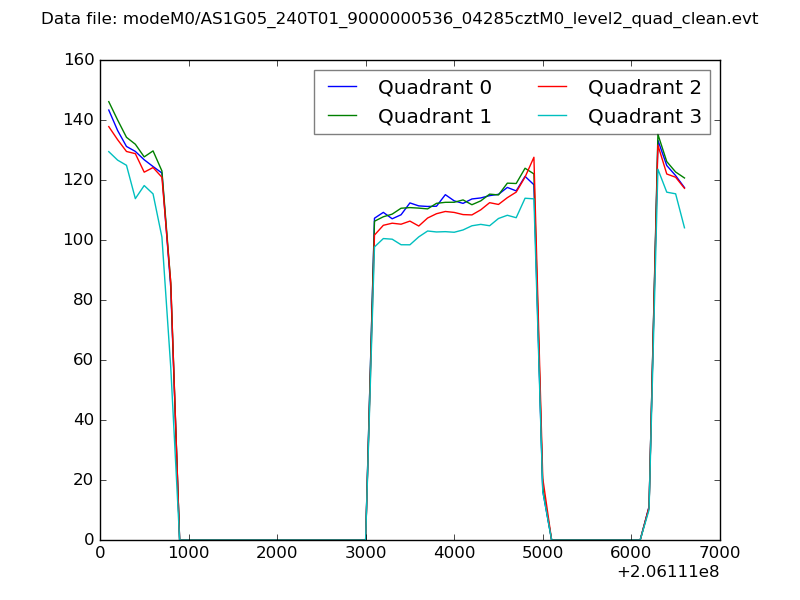 |
|
| Module-wise count rates for Quadrant A Data is divided into 100 sec bins |
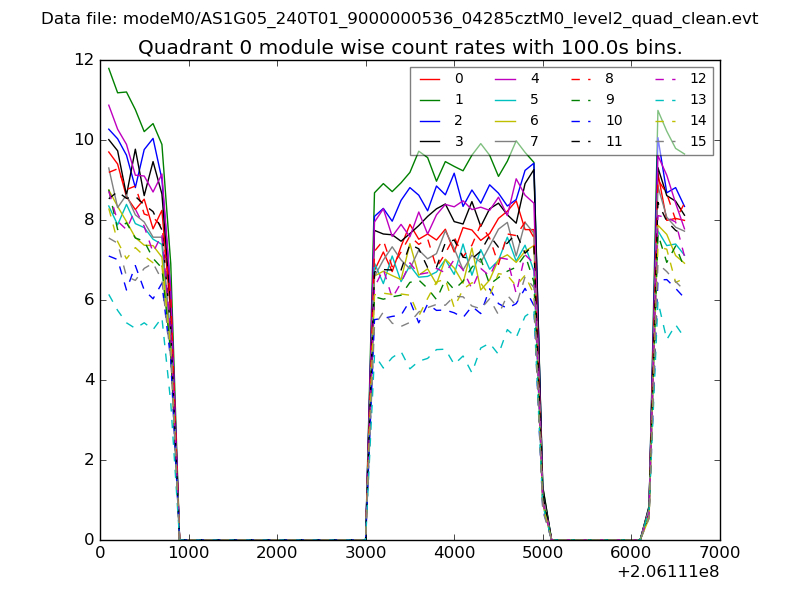 |
 |
| Module-wise count rates for Quadrant B Data is divided into 100 sec bins |
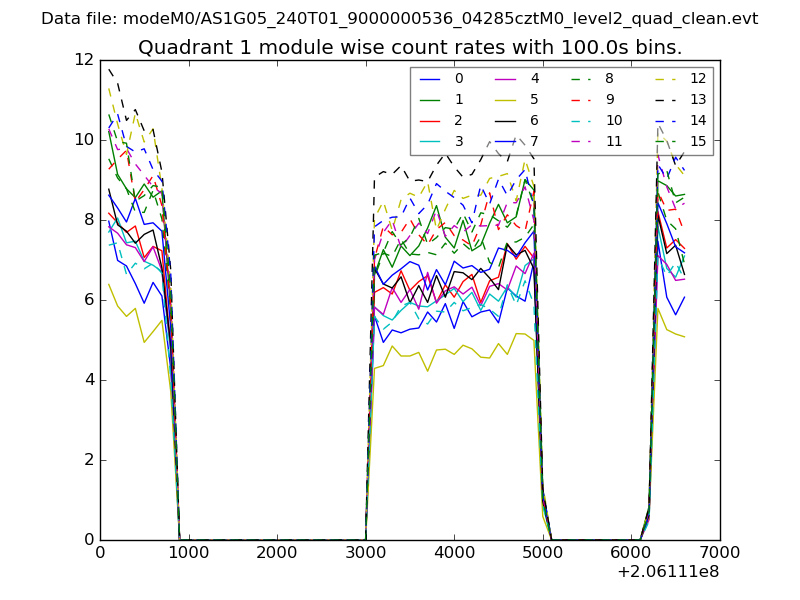 |
 |
| Module-wise count rates for Quadrant C Data is divided into 100 sec bins |
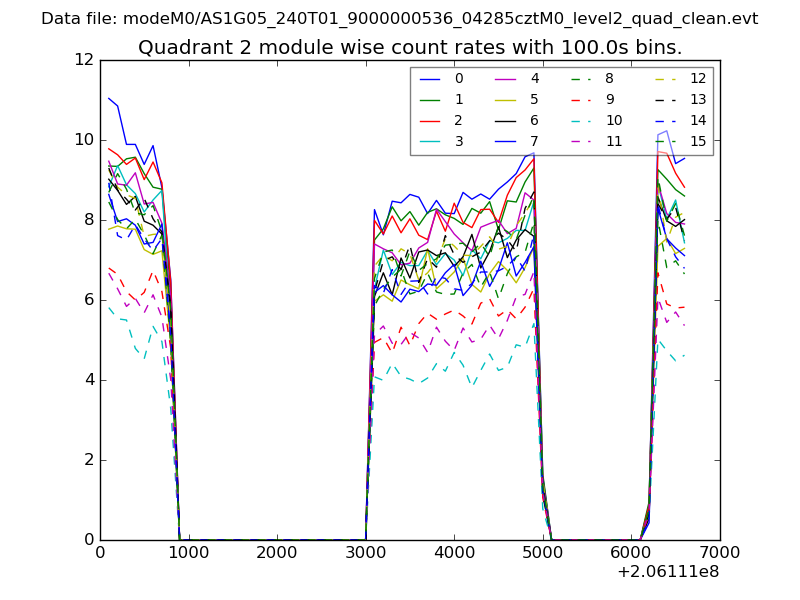 |
 |
| Module-wise count rates for Quadrant D Data is divided into 100 sec bins |
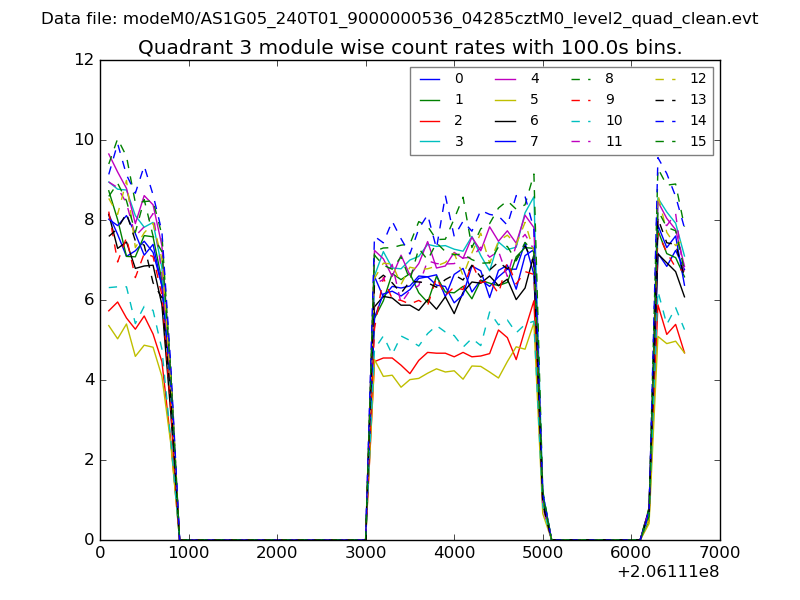 |
 |
| Parameter | Plot |
|---|---|
| CZT HV Monitor | 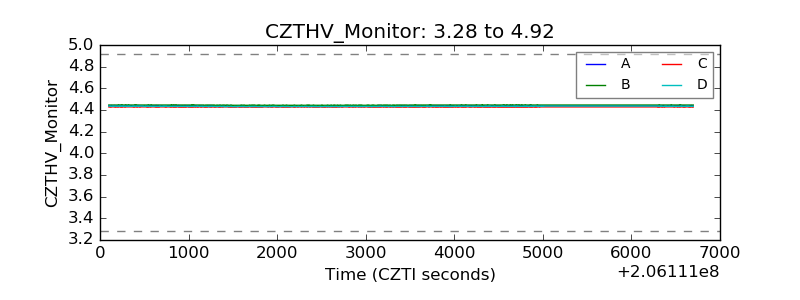 |
| D_VDD | 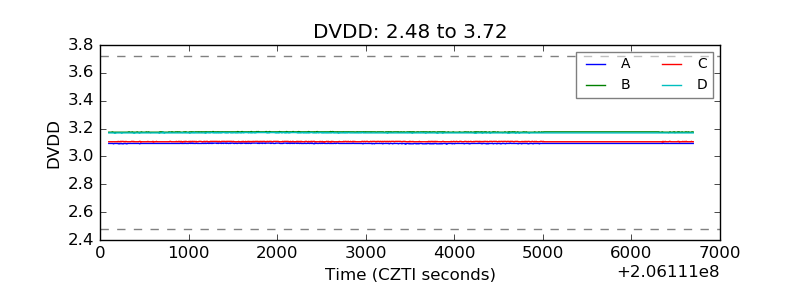 |
| Temperature 1 | 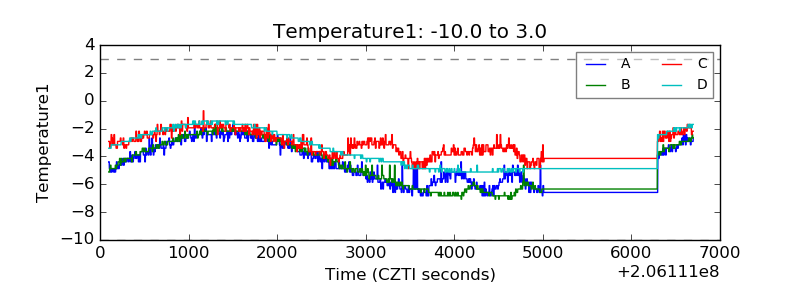 |
| Veto HV Monitor | 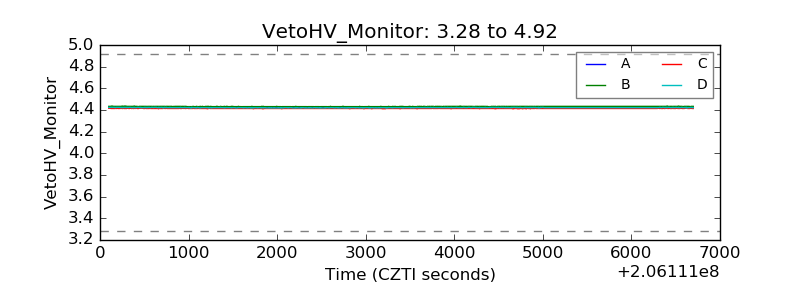 |
| Veto LLD | 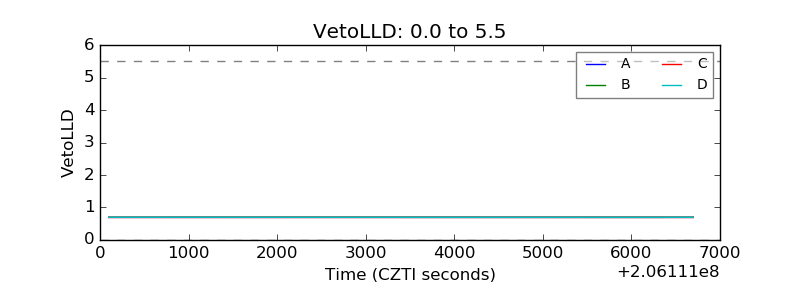 |
| Alpha Counter | 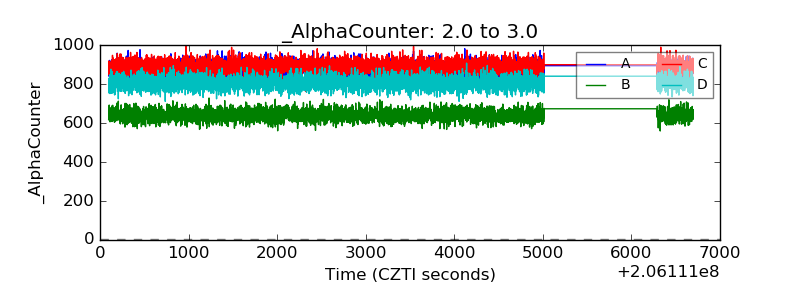 |
| _CPM_Rate | 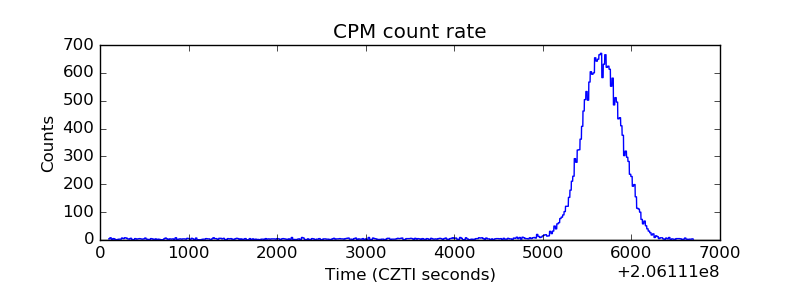 |
| CZT Counter | 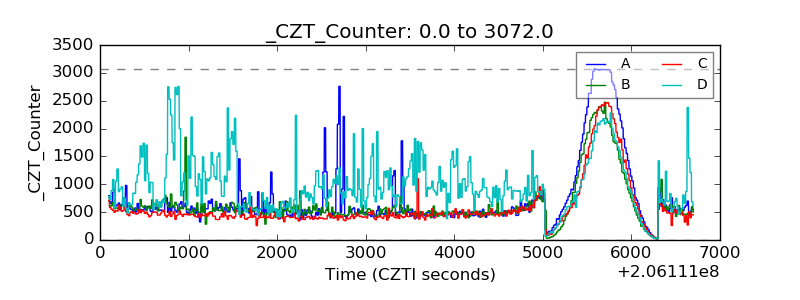 |
| +2.5 Volts monitor |  |
| +5 Volts monitor | 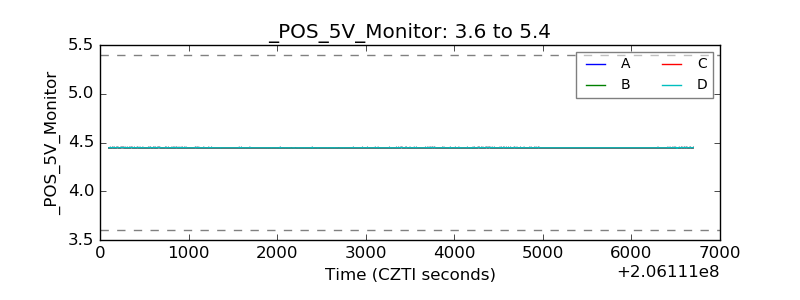 |
| _ROLL_ROT | 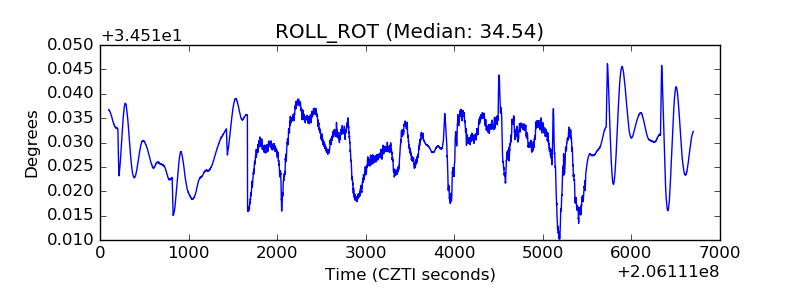 |
| _Roll_DEC | 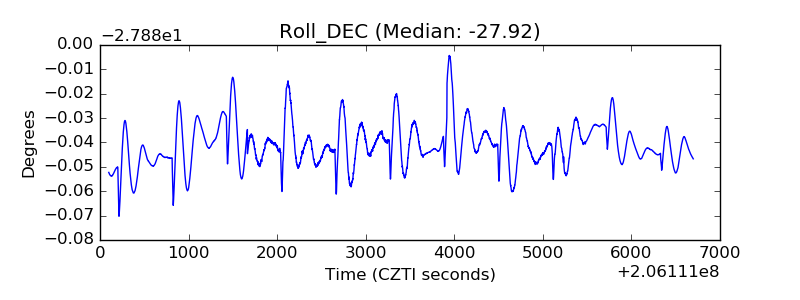 |
| _Roll_RA | 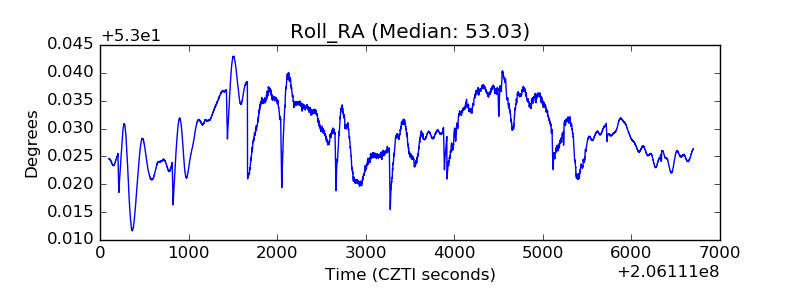 |
| Veto Counter | 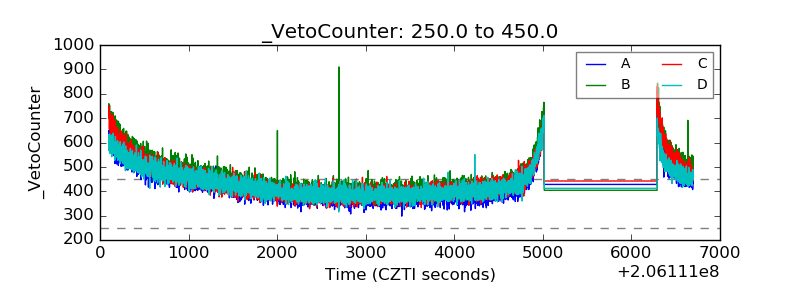 |