| Param | Original file | Final file |
|---|---|---|
| Filename | modeM0/AS1G05_245T01_9000000532_04137cztM0_level2.evt | modeM0/AS1G05_245T01_9000000532_04137cztM0_level2_quad_clean.evt |
| Size (bytes) | 468,374,400 | 85,452,480 |
| Size | 446.7 MB | 81.5 MB |
| Events in quadrant A | 3,398,030 | 539,829 |
| Events in quadrant B | 3,488,495 | 538,086 |
| Events in quadrant C | 3,302,518 | 529,867 |
| Events in quadrant D | 3,538,607 | 511,233 |
| Mode M0 | |||
|---|---|---|---|
| Quadrant | BADHDUFLAG | Total packets | Discarded packets |
| A | 0 | 14259 | 3 |
| B | 0 | 14556 | 2 |
| C | 0 | 14064 | 2 |
| D | 0 | 15041 | 2 |
| Mode SS | |||
|---|---|---|---|
| Quadrant | BADHDUFLAG | Total packets | Discarded packets |
| A | 0 | 136 | 0 |
| B | 0 | 136 | 0 |
| C | 0 | 136 | 0 |
| D | 0 | 136 | 0 |
| Mode M9 | |||
|---|---|---|---|
| Quadrant | BADHDUFLAG | Total packets | Discarded packets |
| A | 0 | 23 | 0 |
| B | 0 | 23 | 0 |
| C | 0 | 23 | 0 |
| D | 0 | 23 | 0 |
| Quadrant | Total seconds | Saturated seconds | Saturation percentage |
|---|---|---|---|
| A | 6732 | 139 | 2.064765% |
| B | 6732 | 146 | 2.168746% |
| C | 6732 | 126 | 1.871658% |
| D | 6732 | 165 | 2.450980% |
Noise dominated data is calculated using 1-second bins in cleaned event files. If a bin has >2000 counts, and if more than 50% of those come from <1% of pixels, then it is considered to be noise-dominated and hence unusable.
| Quadrant | # 1 sec bins | Bins with >0 counts | Bins with >2000 counts | High rate bins dominated by noise | Noise dominated (total time) | Noise dominated (detector-on time) | Marked lightcurve |
|---|---|---|---|---|---|---|---|
| A | 8942 | 6734 | 1 | 1 | 0.01% | 0.01% | 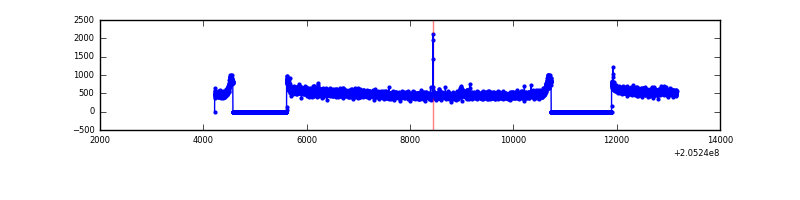 |
| B | 8942 | 6733 | 0 | 0 | 0.00% | 0.00% | 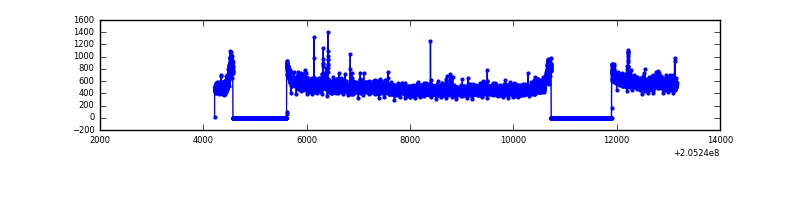 |
| C | 8942 | 6733 | 0 | 0 | 0.00% | 0.00% | 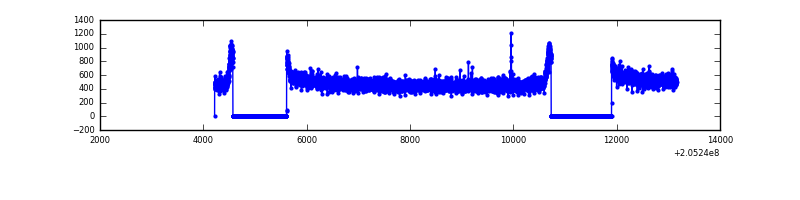 |
| D | 8942 | 6733 | 30 | 30 | 0.34% | 0.45% |  |
Top three noisy pixels from each quadrant. If the there are fewer than three noisy pixels in the level2.evt file, extra rows are filled as -1
| Pixel properties | Quadrant properties | ||||||
|---|---|---|---|---|---|---|---|
| Quadrant | DetID | PixID | Counts | Sigma | Mean | Median | Sigma |
| A | 3 | 1 | 20165 | 109.54 | 867 | 851 | 176.3 |
| A | 15 | 234 | 20077 | 109.04 | 867 | 851 | 176.3 |
| A | 13 | 14 | 19973 | 108.46 | 867 | 851 | 176.3 |
| B | 15 | 204 | 30173 | 176.04 | 872 | 854 | 166.5 |
| B | 10 | 16 | 23815 | 137.86 | 872 | 854 | 166.5 |
| B | 0 | 183 | 22022 | 127.1 | 872 | 854 | 166.5 |
| C | 10 | 65 | 12084 | 57.41 | 843 | 850 | 195.7 |
| C | 13 | 61 | 6874 | 30.79 | 843 | 850 | 195.7 |
| C | 3 | 202 | 1996 | 5.85 | 843 | 850 | 195.7 |
| D | 10 | 172 | 170189 | 849.34 | 836 | 813 | 199.4 |
| D | 13 | 239 | 90773 | 451.11 | 836 | 813 | 199.4 |
| D | 13 | 238 | 39342 | 193.2 | 836 | 813 | 199.4 |
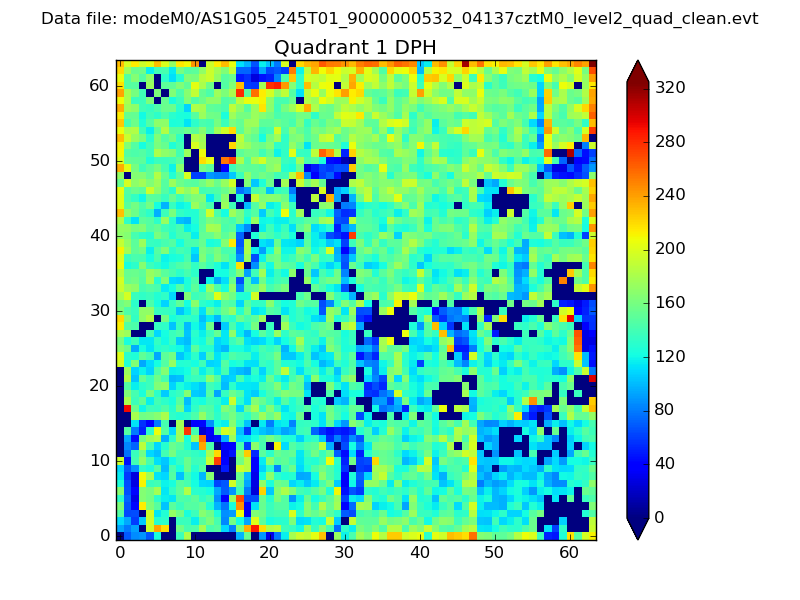
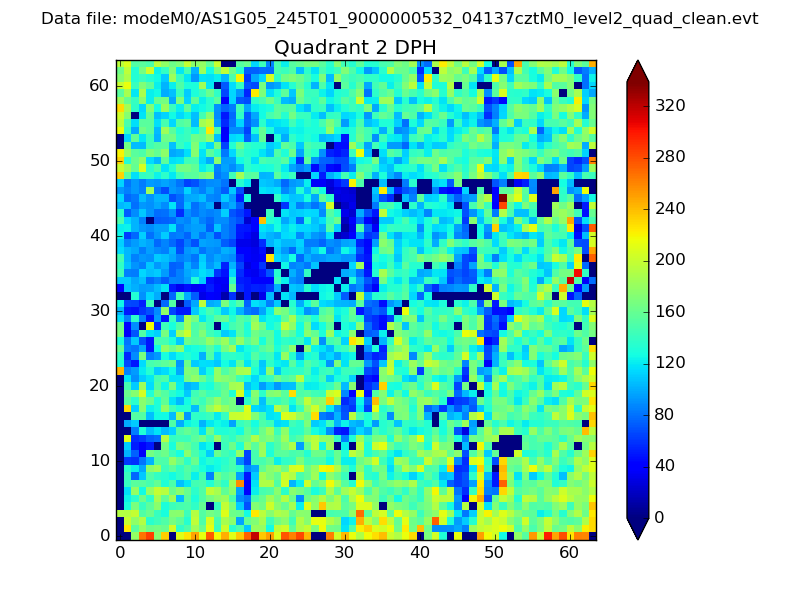
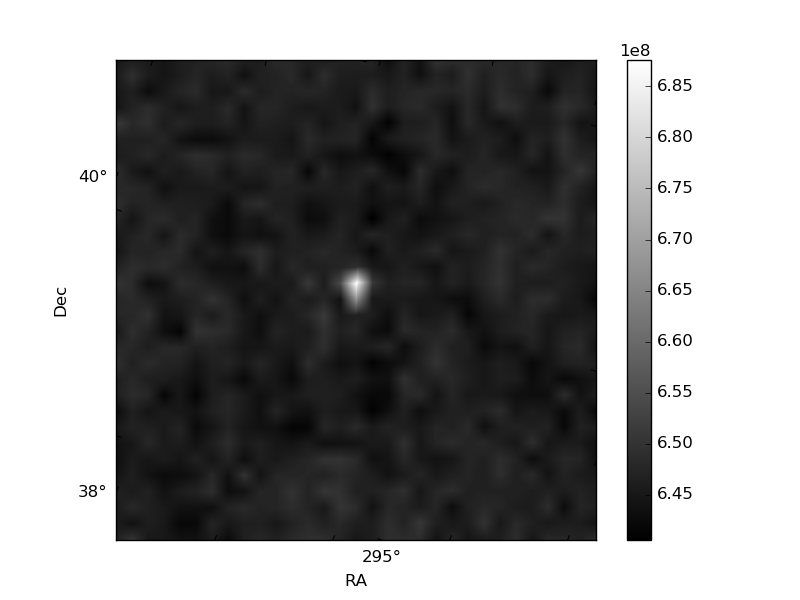
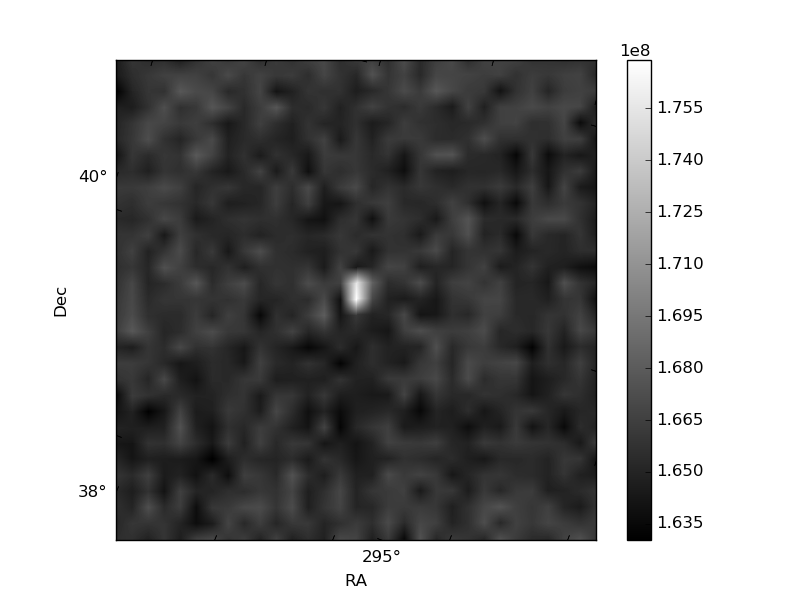
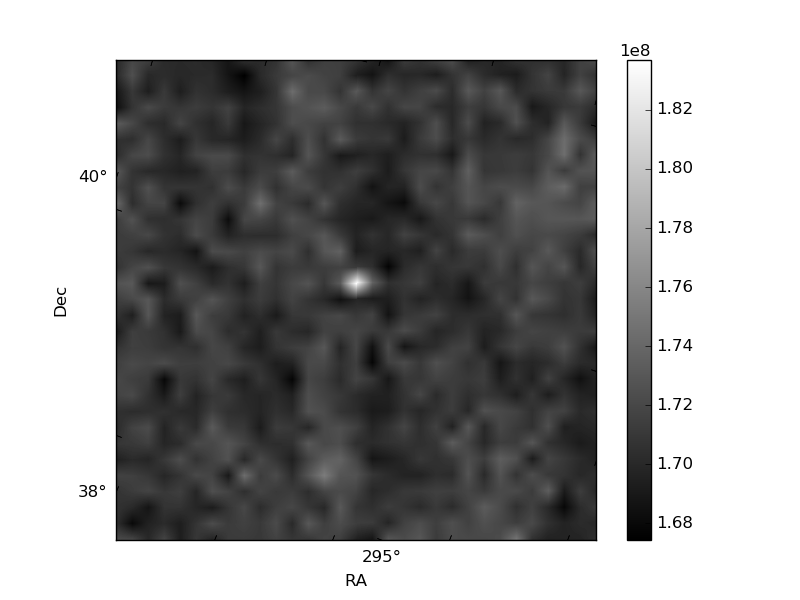
Histogram calculated using DETX and DETY for each event in the final _common_clean file
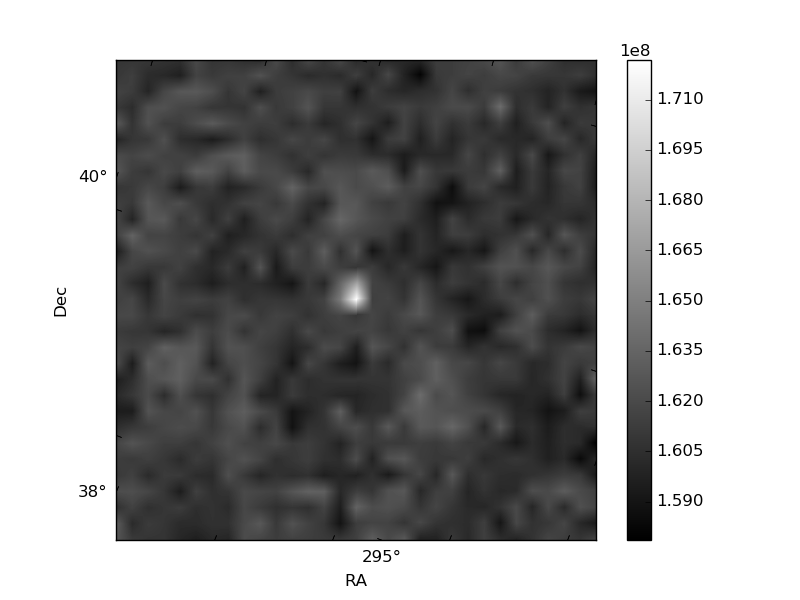
| Quadrant A | 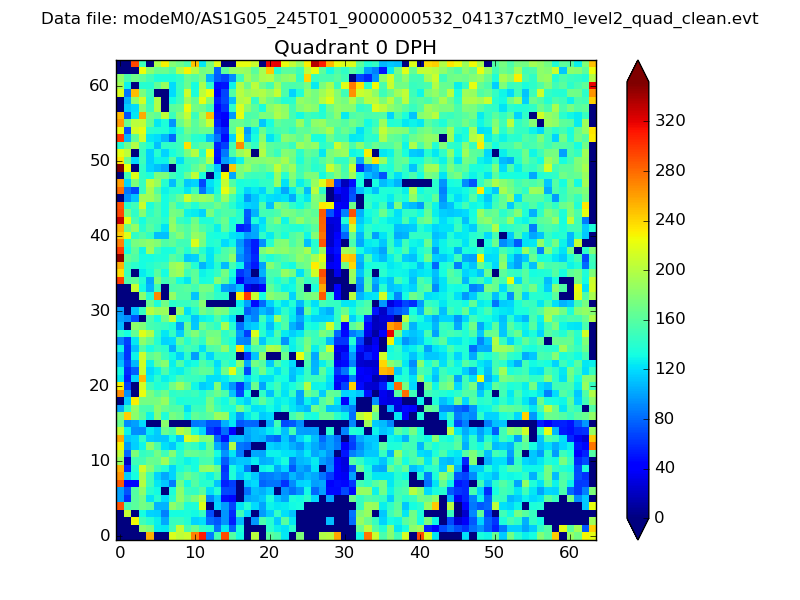 |
 |
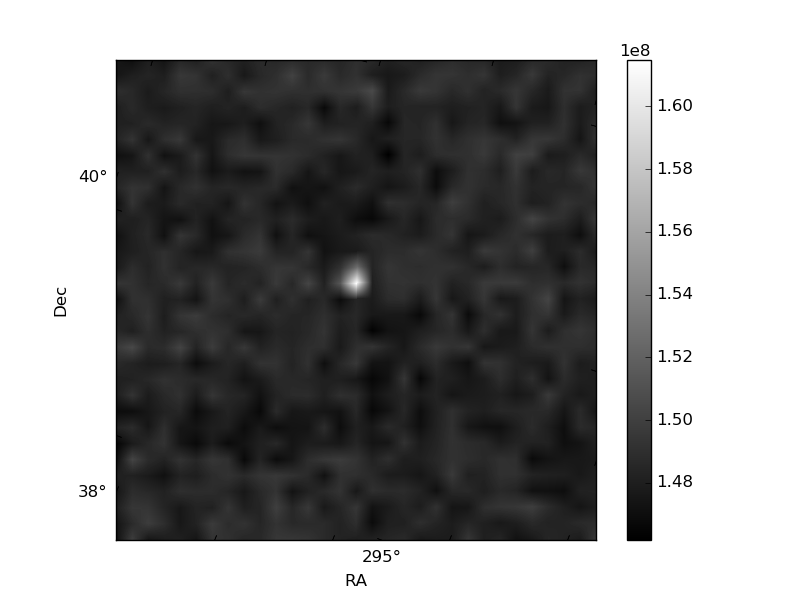
Quadrant B |
|---|---|---|---|
| Quadrant D | 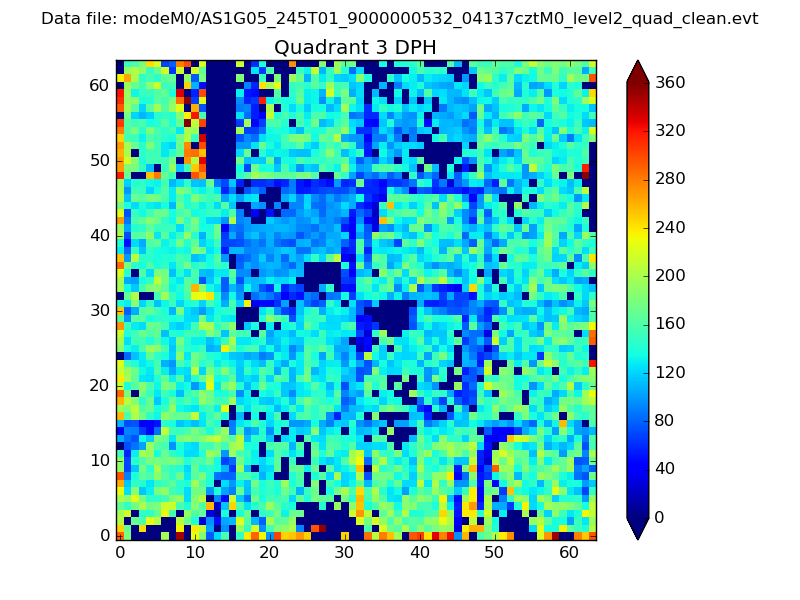 |
 |
Quadrant C |
| Plot type | Count rate plots | Images |
|---|---|---|
| Comparison with Poisson distribution Blue bars denote a histogram of data divided into 1 sec bins. Red curve is a Poisson curve with rate = median count rate of data. |
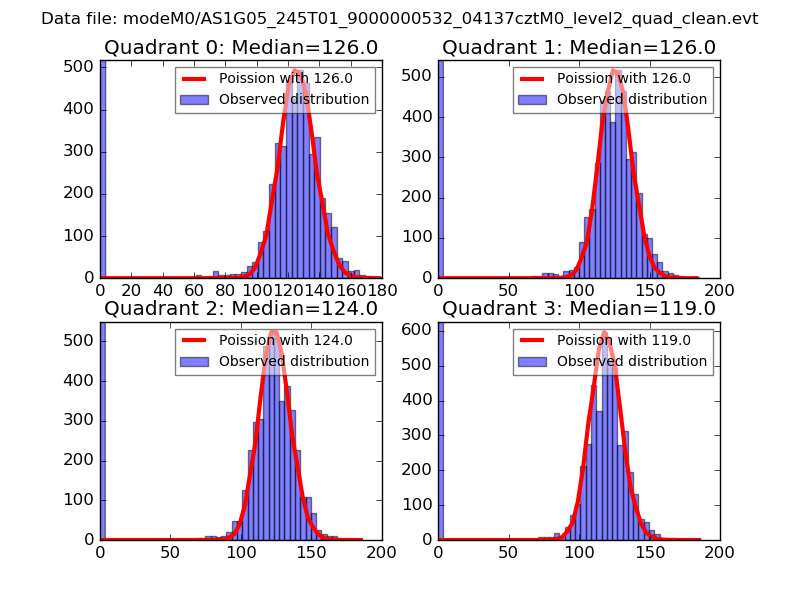 |
 |
| Quadrant-wise count rates Data is divided into 100 sec bins |
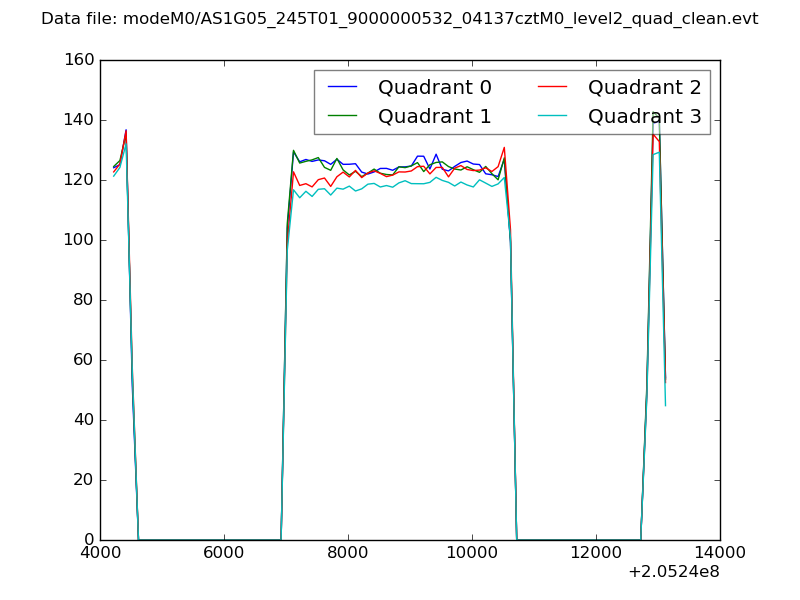 |
|
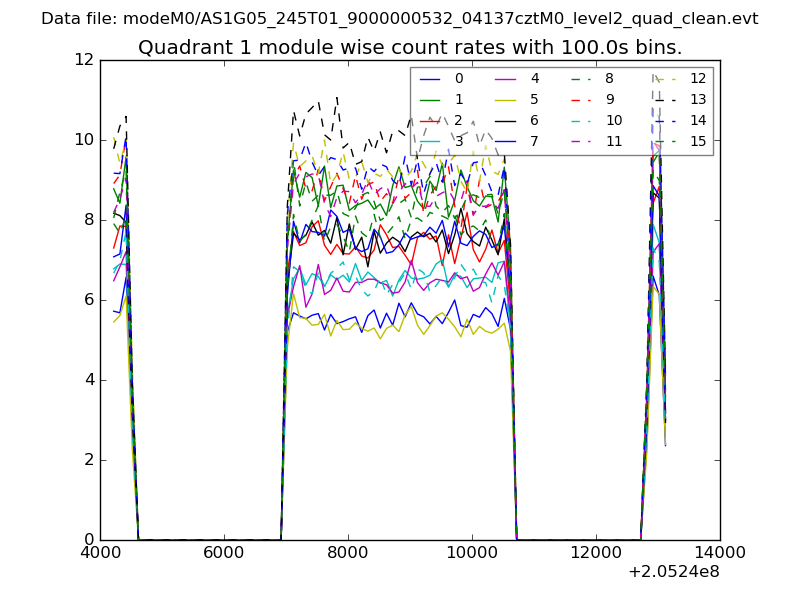
| Module-wise count rates for Quadrant A Data is divided into 100 sec bins |
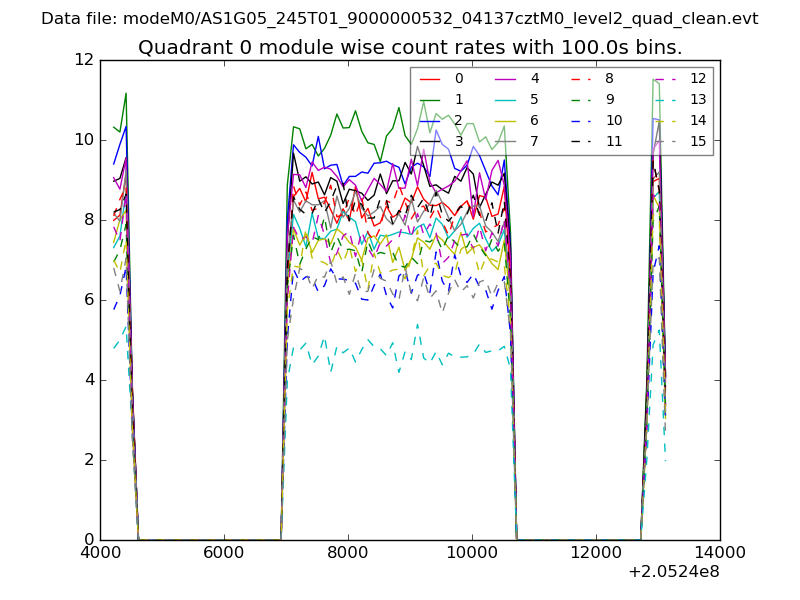 |
 |
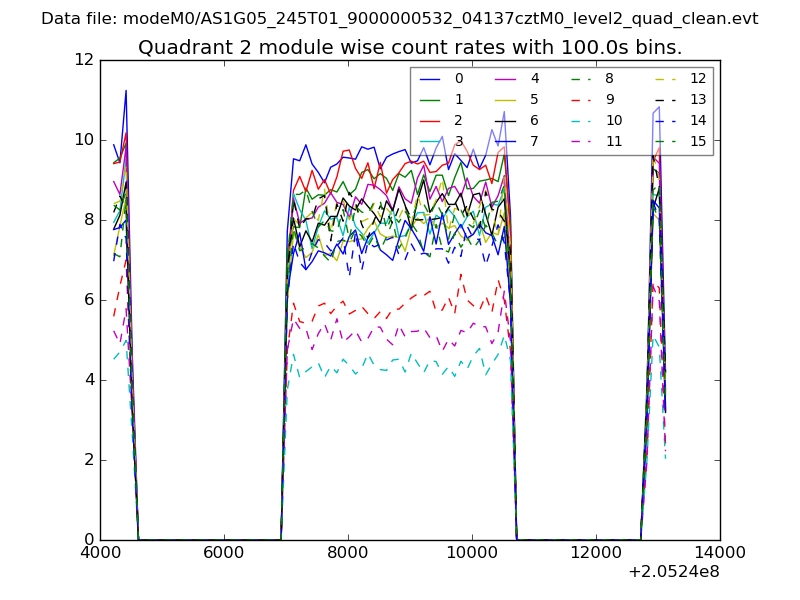
| Module-wise count rates for Quadrant B Data is divided into 100 sec bins |
 |
 |
| Module-wise count rates for Quadrant C Data is divided into 100 sec bins |
 |
 |
| Module-wise count rates for Quadrant D Data is divided into 100 sec bins |
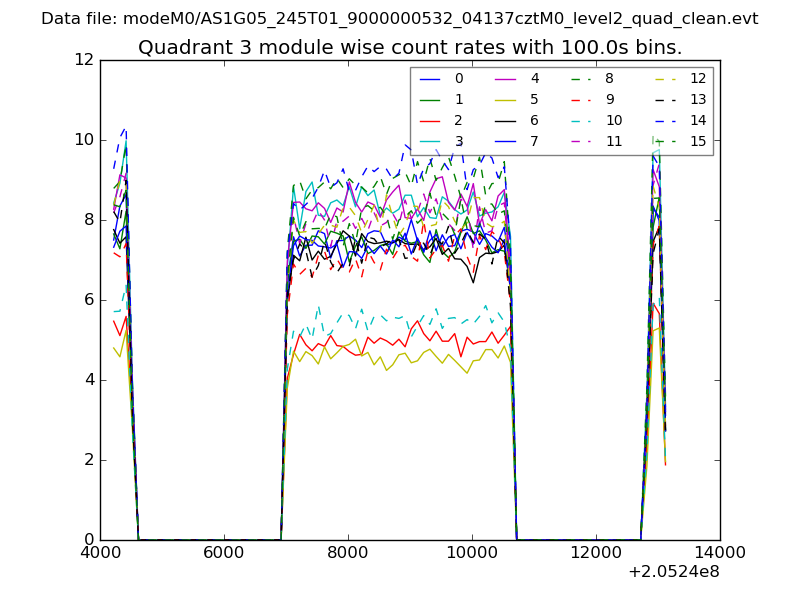 |
 |
| Parameter | Plot |
|---|---|
| CZT HV Monitor | 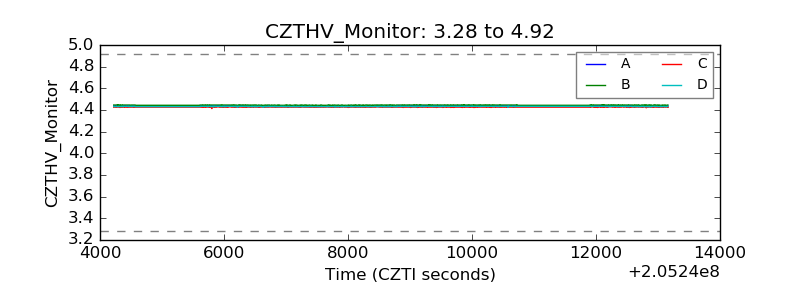 |
| D_VDD | 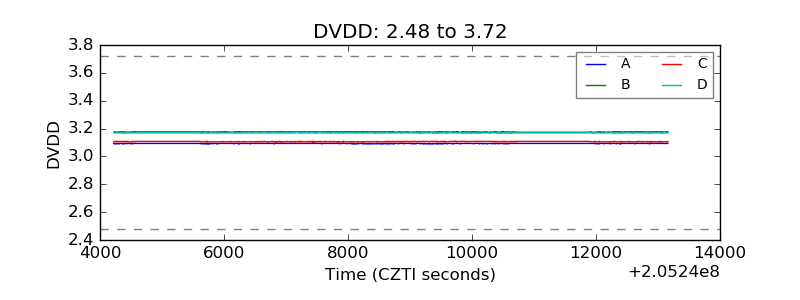 |
| Temperature 1 | 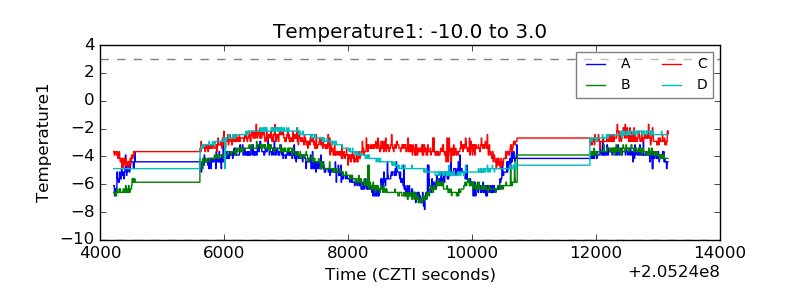 |
| Veto HV Monitor | 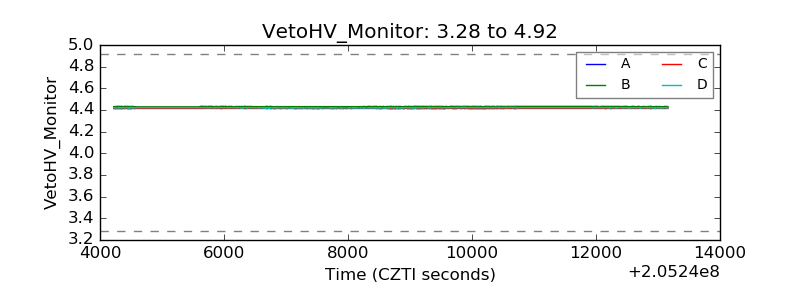 |
| Veto LLD | 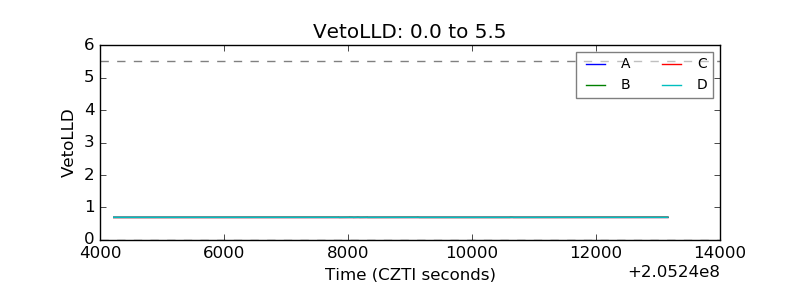 |
| Alpha Counter | 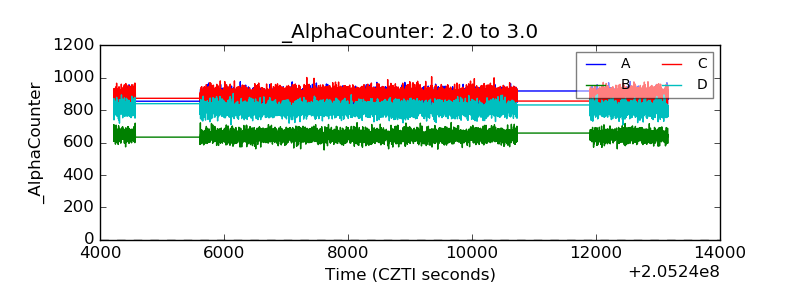 |
| _CPM_Rate | 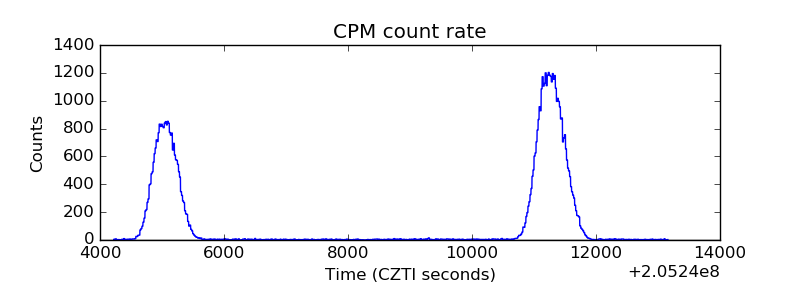 |
| CZT Counter | 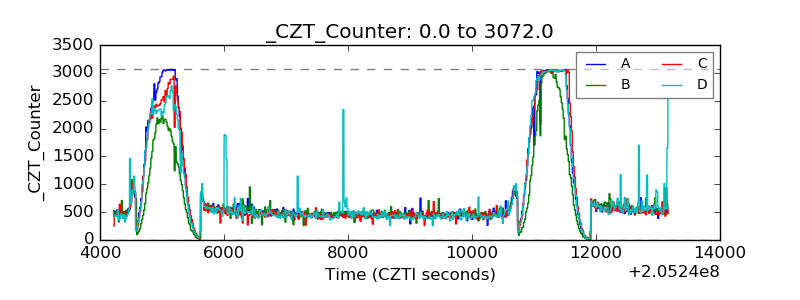 |
| +2.5 Volts monitor | 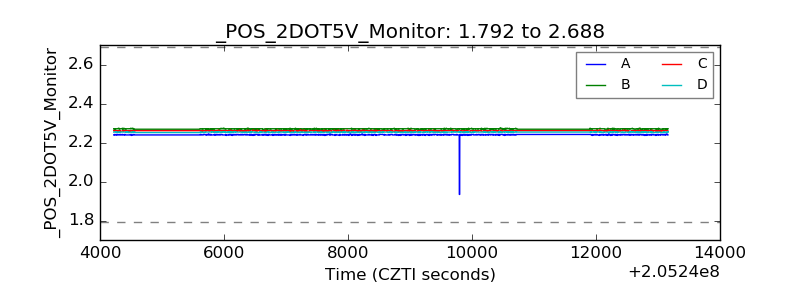 |
| +5 Volts monitor | 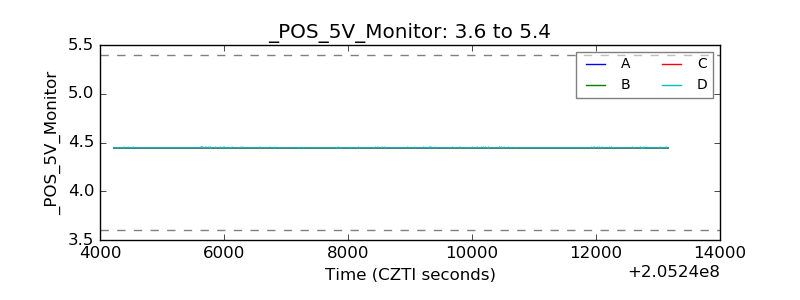 |
| _ROLL_ROT | 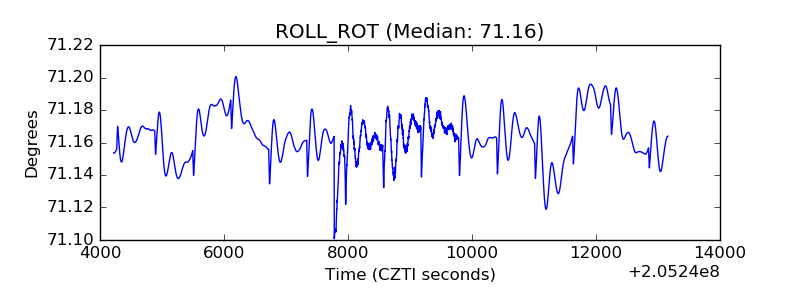 |
| _Roll_DEC | 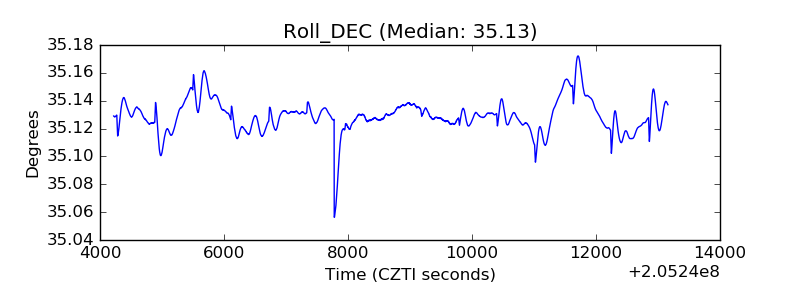 |
| _Roll_RA | 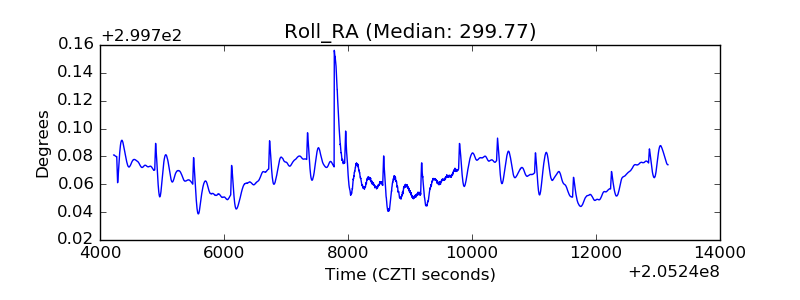 |
| Veto Counter | 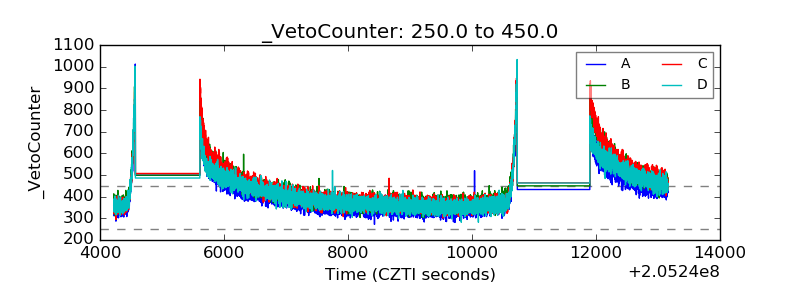 |