| Param | Original file | Final file |
|---|---|---|
| Filename | modeM0/AS1G05_245T01_9000000532_04138cztM0_level2.evt | modeM0/AS1G05_245T01_9000000532_04138cztM0_level2_quad_clean.evt |
| Size (bytes) | 200,698,560 | 39,516,480 |
| Size | 191.4 MB | 37.7 MB |
| Events in quadrant A | 1,417,097 | 255,248 |
| Events in quadrant B | 1,484,018 | 252,984 |
| Events in quadrant C | 1,391,350 | 248,836 |
| Events in quadrant D | 1,591,366 | 237,094 |
| Mode M0 | |||
|---|---|---|---|
| Quadrant | BADHDUFLAG | Total packets | Discarded packets |
| A | 0 | 5926 | 1 |
| B | 0 | 6123 | 1 |
| C | 0 | 5792 | 1 |
| D | 0 | 6539 | 1 |
| Mode SS | |||
|---|---|---|---|
| Quadrant | BADHDUFLAG | Total packets | Discarded packets |
| A | 0 | 58 | 0 |
| B | 0 | 58 | 0 |
| C | 0 | 58 | 0 |
| D | 0 | 58 | 0 |
| Quadrant | Total seconds | Saturated seconds | Saturation percentage |
|---|---|---|---|
| A | 2823 | 4 | 0.141693% |
| B | 2823 | 4 | 0.141693% |
| C | 2823 | 1 | 0.035423% |
| D | 2823 | 44 | 1.558626% |
Noise dominated data is calculated using 1-second bins in cleaned event files. If a bin has >2000 counts, and if more than 50% of those come from <1% of pixels, then it is considered to be noise-dominated and hence unusable.
| Quadrant | # 1 sec bins | Bins with >0 counts | Bins with >2000 counts | High rate bins dominated by noise | Noise dominated (total time) | Noise dominated (detector-on time) | Marked lightcurve |
|---|---|---|---|---|---|---|---|
| A | 2823 | 2823 | 2 | 2 | 0.07% | 0.07% | 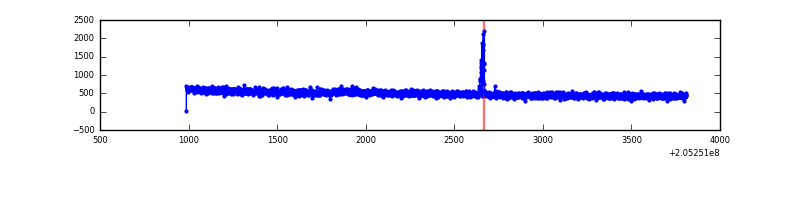 |
| B | 2823 | 2823 | 0 | 0 | 0.00% | 0.00% | 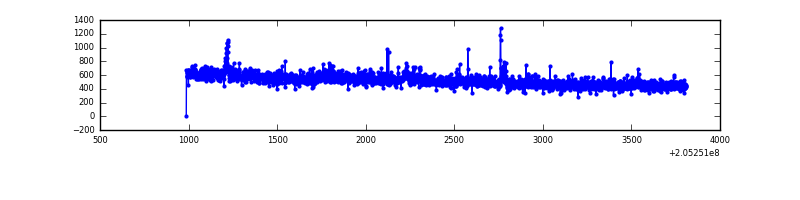 |
| C | 2823 | 2823 | 0 | 0 | 0.00% | 0.00% | 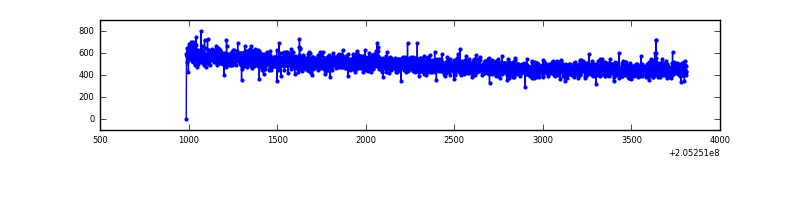 |
| D | 2823 | 2823 | 34 | 34 | 1.20% | 1.20% | 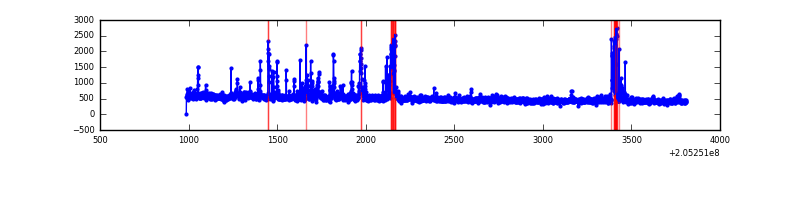 |
Top three noisy pixels from each quadrant. If the there are fewer than three noisy pixels in the level2.evt file, extra rows are filled as -1
| Pixel properties | Quadrant properties | ||||||
|---|---|---|---|---|---|---|---|
| Quadrant | DetID | PixID | Counts | Sigma | Mean | Median | Sigma |
| A | 0 | 50 | 21496 | 286.94 | 362 | 355 | 73.7 |
| A | 12 | 194 | 3739 | 45.93 | 362 | 355 | 73.7 |
| A | 0 | 226 | 3586 | 43.85 | 362 | 355 | 73.7 |
| B | 10 | 16 | 21450 | 303.65 | 363 | 357 | 69.5 |
| B | 15 | 204 | 21267 | 301.01 | 363 | 357 | 69.5 |
| B | 0 | 183 | 11698 | 163.26 | 363 | 357 | 69.5 |
| C | 10 | 65 | 3488 | 37.85 | 355 | 359 | 82.7 |
| C | 13 | 61 | 2914 | 30.91 | 355 | 359 | 82.7 |
| C | 3 | 202 | 867 | 6.14 | 355 | 359 | 82.7 |
| D | 10 | 172 | 211218 | 2490.5 | 352 | 344 | 84.7 |
| D | 13 | 238 | 16040 | 185.38 | 352 | 344 | 84.7 |
| D | 2 | 63 | 11387 | 130.42 | 352 | 344 | 84.7 |
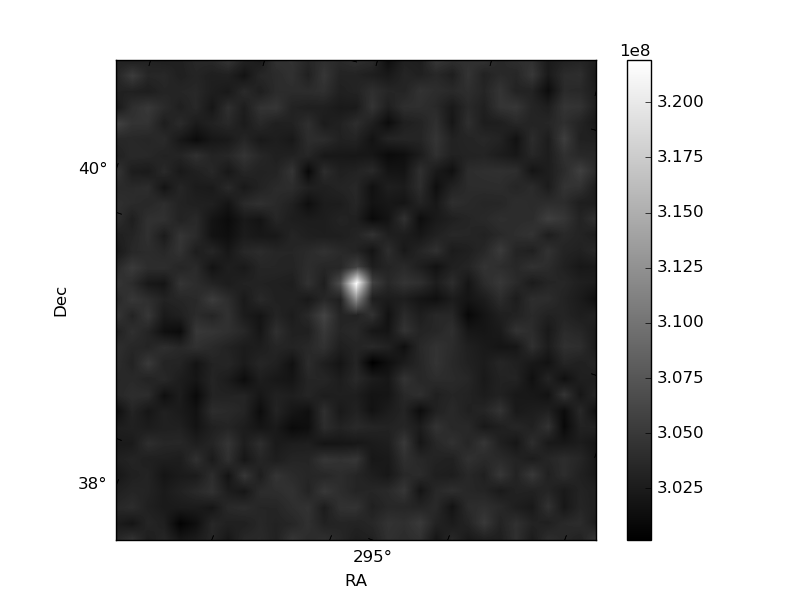
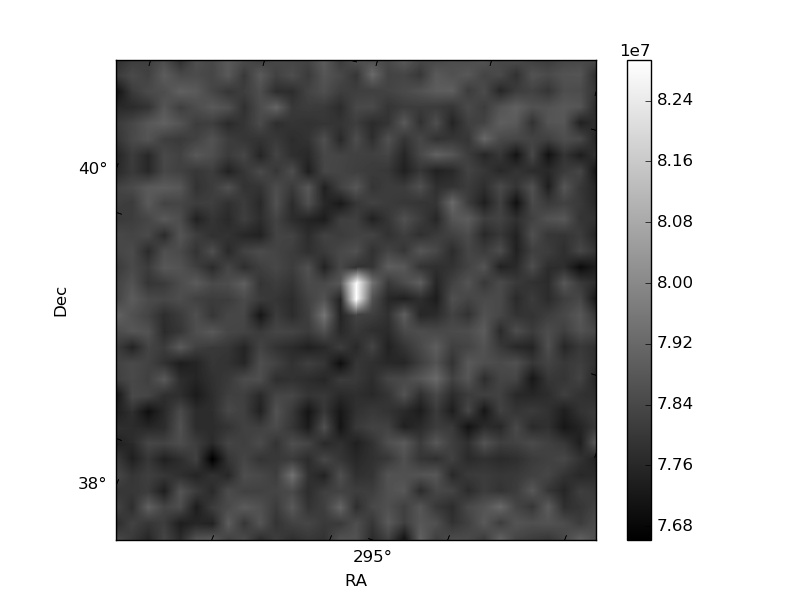
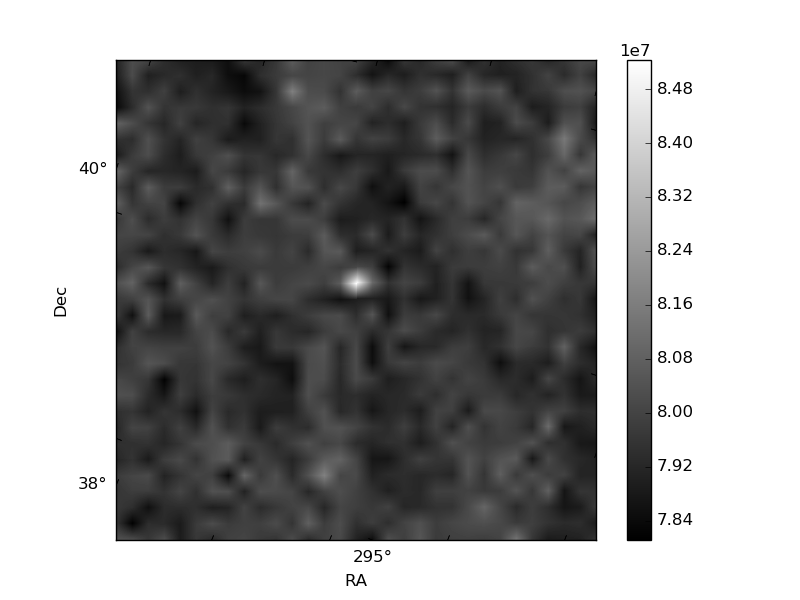
Histogram calculated using DETX and DETY for each event in the final _common_clean file
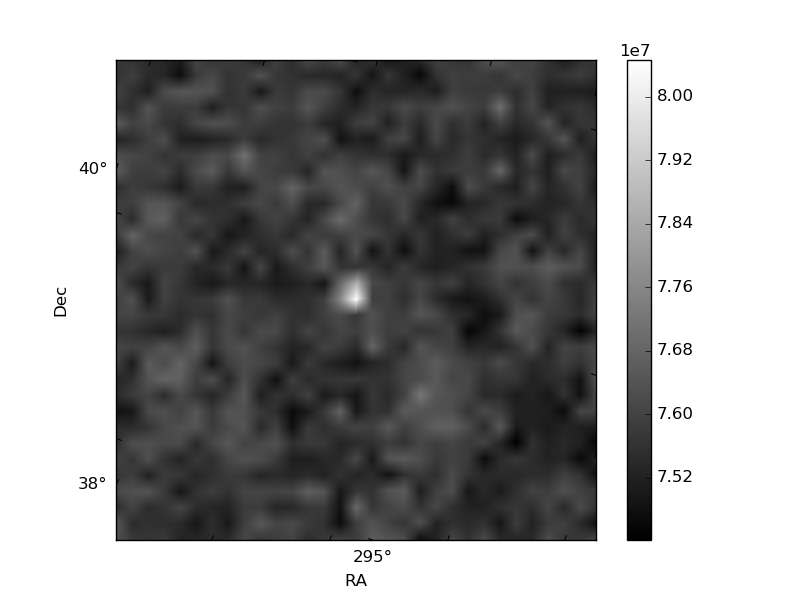
| Quadrant A | 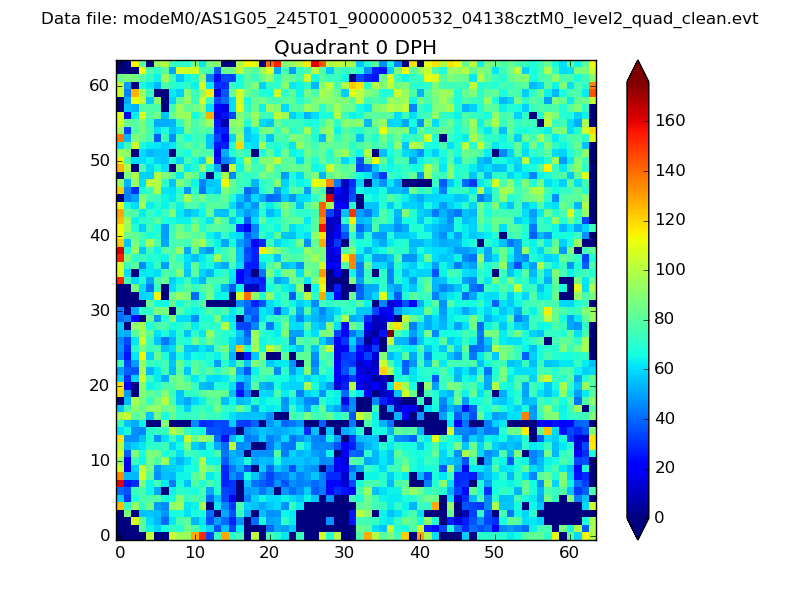 |
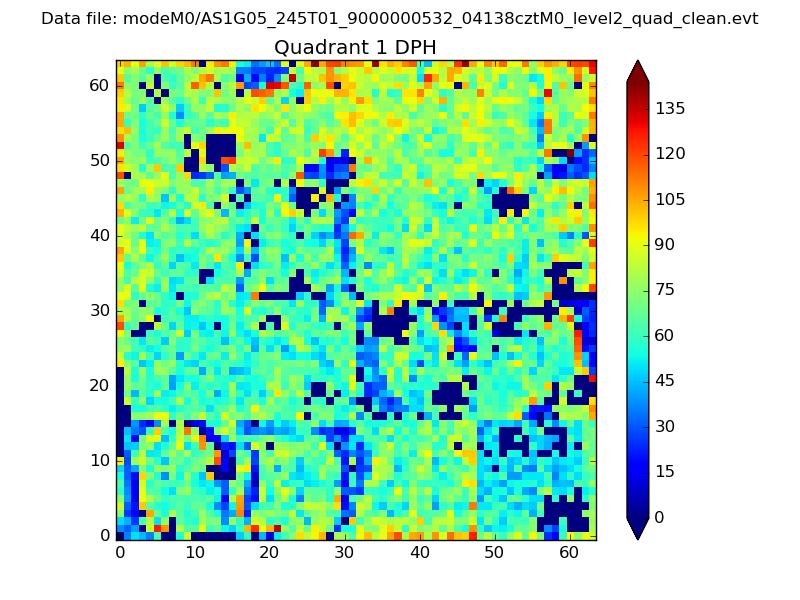 |
Quadrant B |
|---|---|---|---|
| Quadrant D | 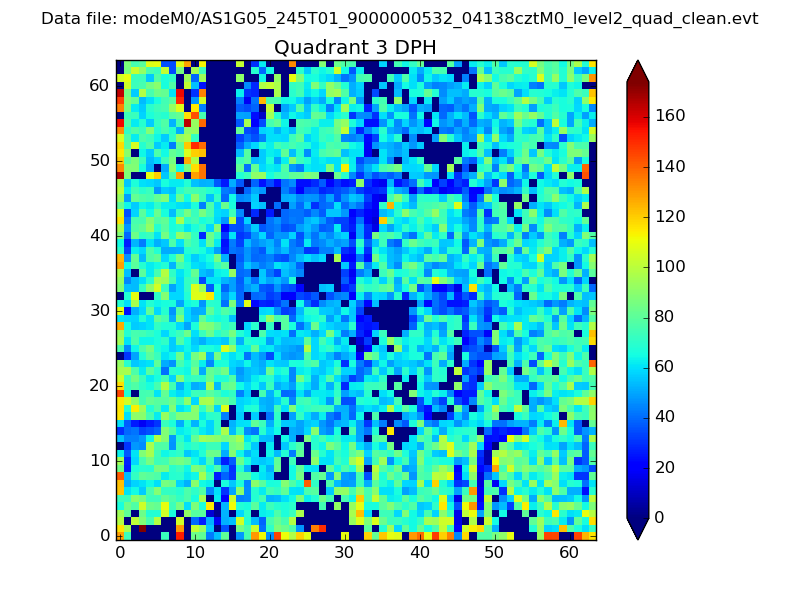 |
 |
Quadrant C |
| Plot type | Count rate plots | Images |
|---|---|---|
| Comparison with Poisson distribution Blue bars denote a histogram of data divided into 1 sec bins. Red curve is a Poisson curve with rate = median count rate of data. |
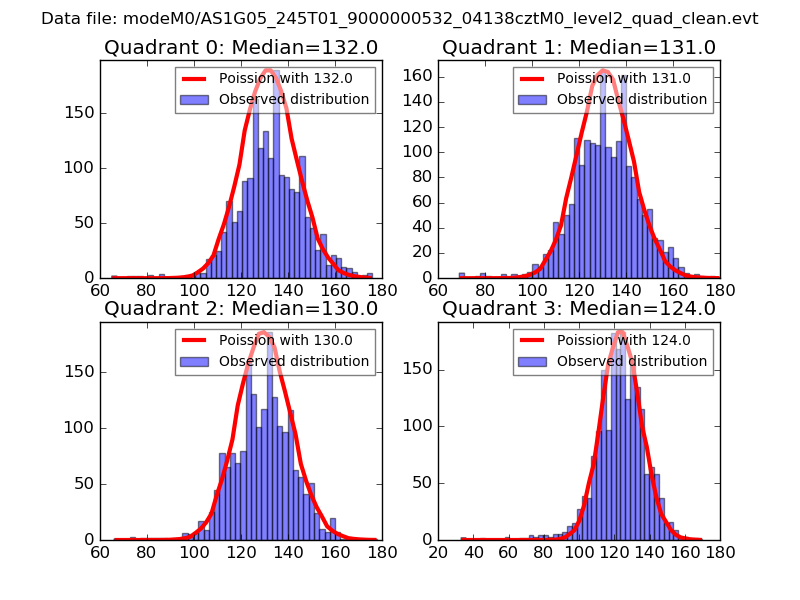 |
 |
| Quadrant-wise count rates Data is divided into 100 sec bins |
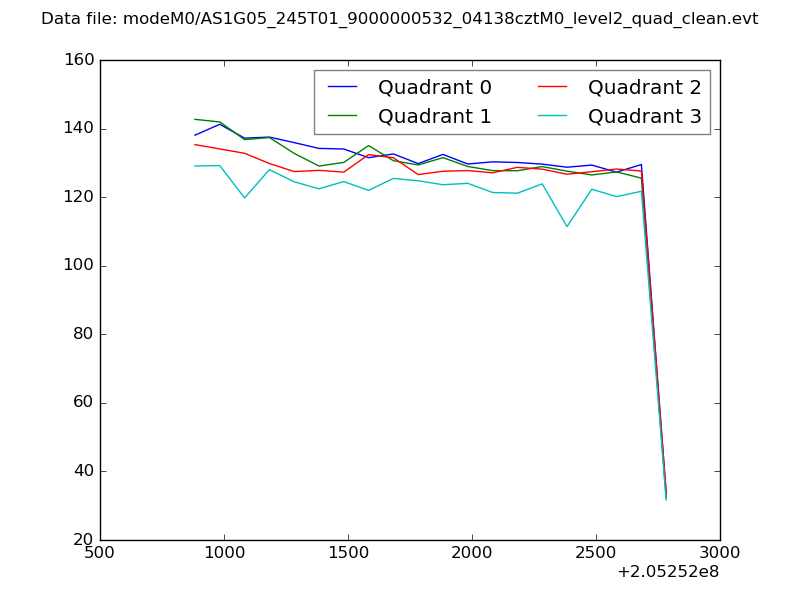 |
|
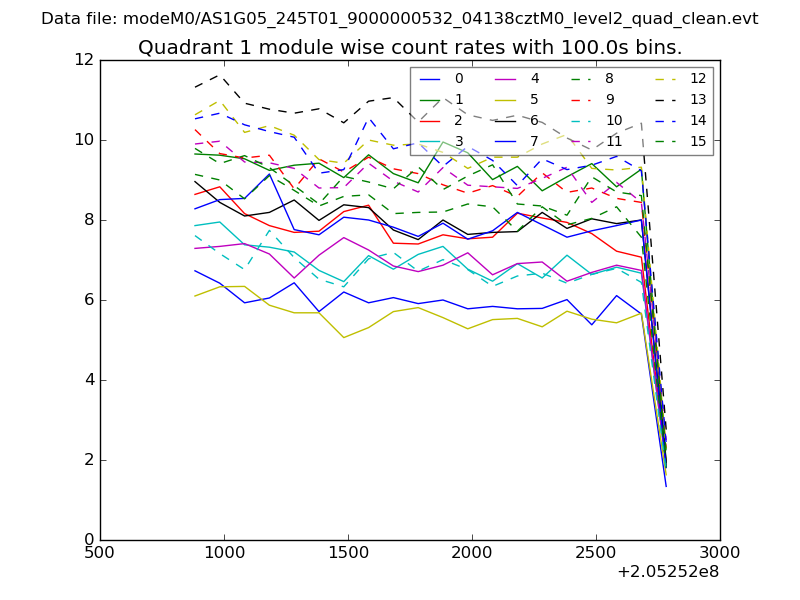
| Module-wise count rates for Quadrant A Data is divided into 100 sec bins |
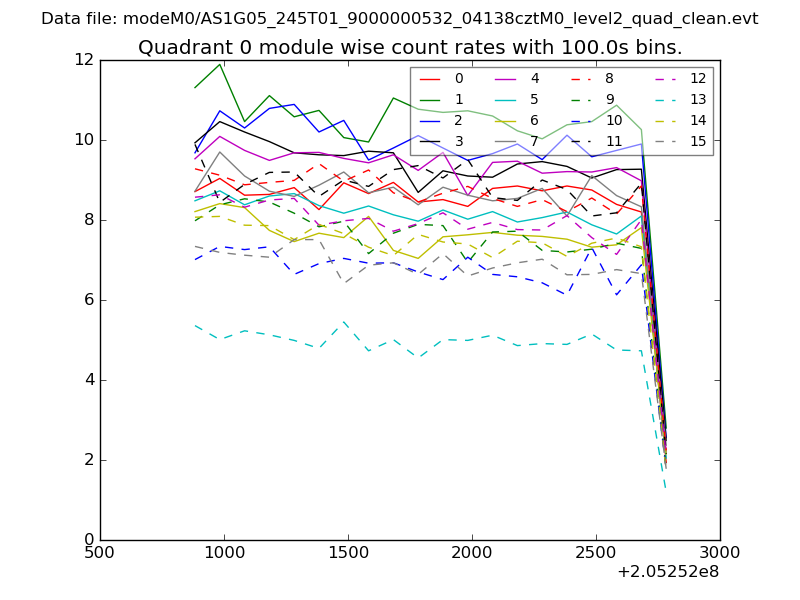 |
 |
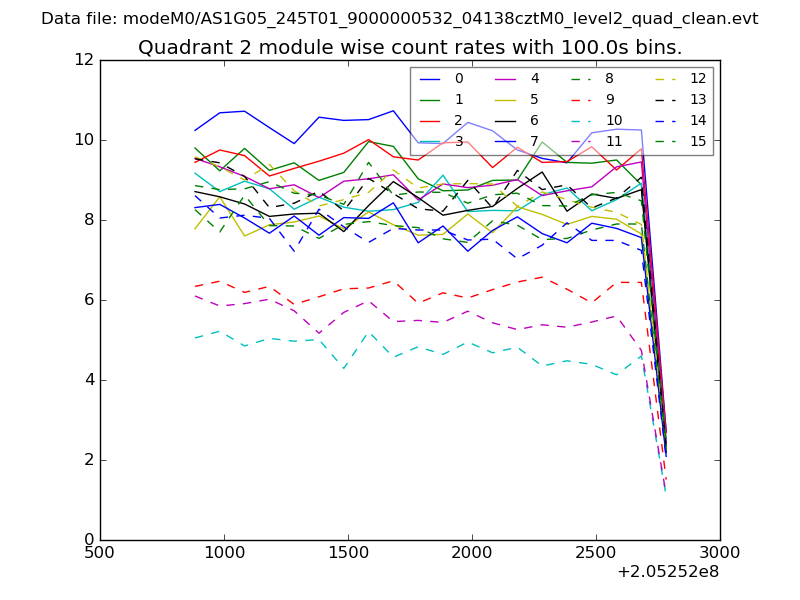
| Module-wise count rates for Quadrant B Data is divided into 100 sec bins |
 |
 |
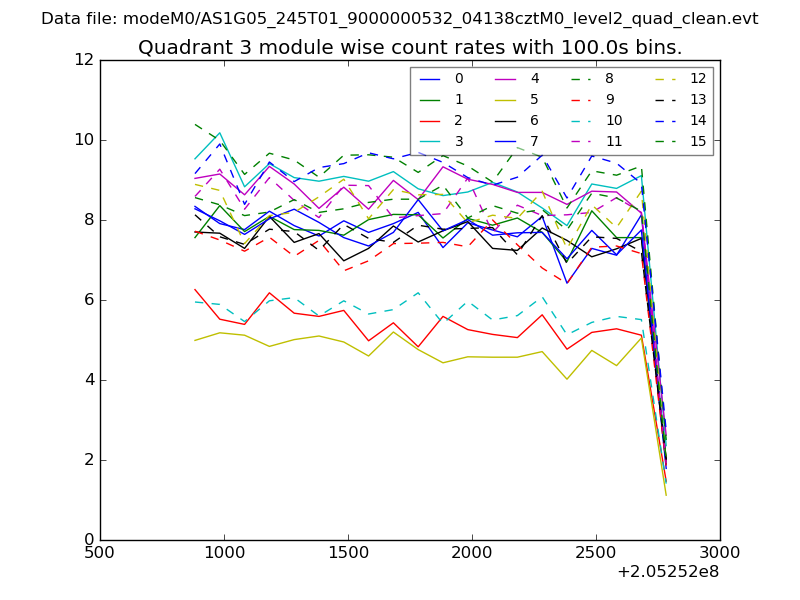
| Module-wise count rates for Quadrant C Data is divided into 100 sec bins |
 |
 |
| Module-wise count rates for Quadrant D Data is divided into 100 sec bins |
 |
 |
| Parameter | Plot |
|---|---|
| CZT HV Monitor | 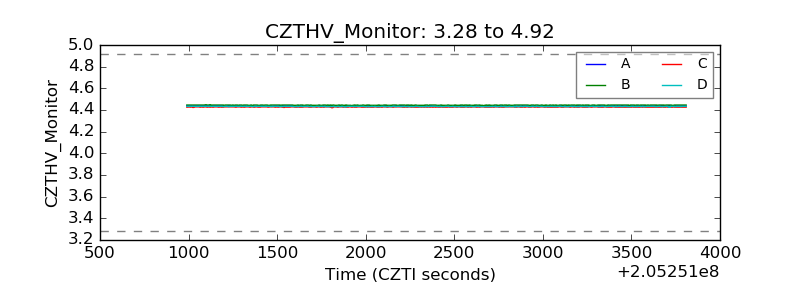 |
| D_VDD |  |
| Temperature 1 |  |
| Veto HV Monitor | 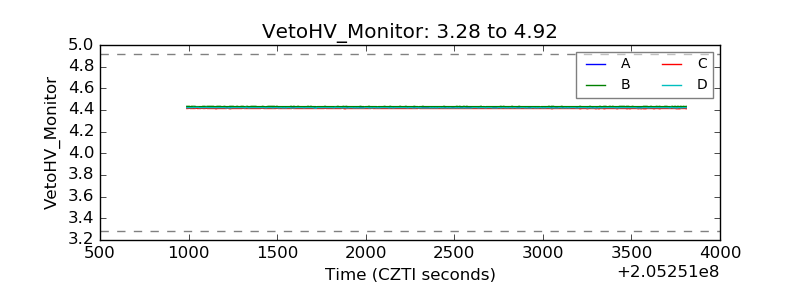 |
| Veto LLD | 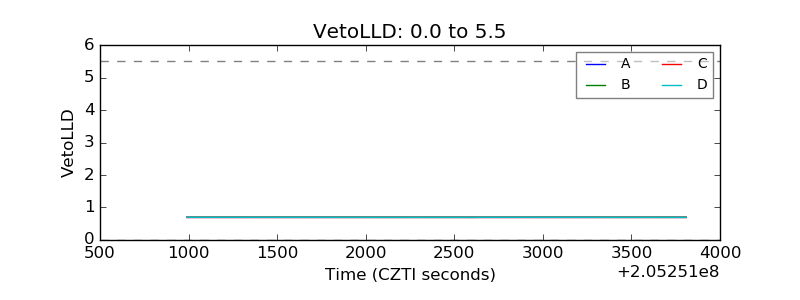 |
| Alpha Counter | 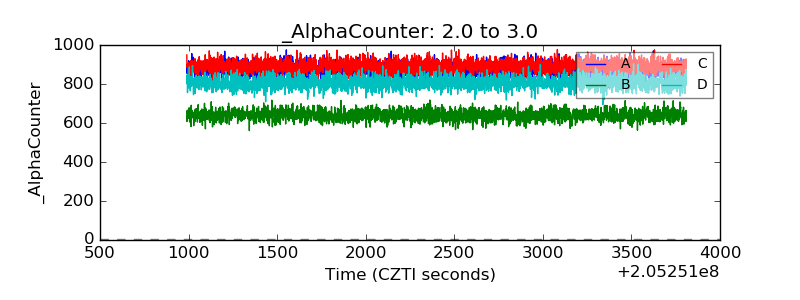 |
| _CPM_Rate | 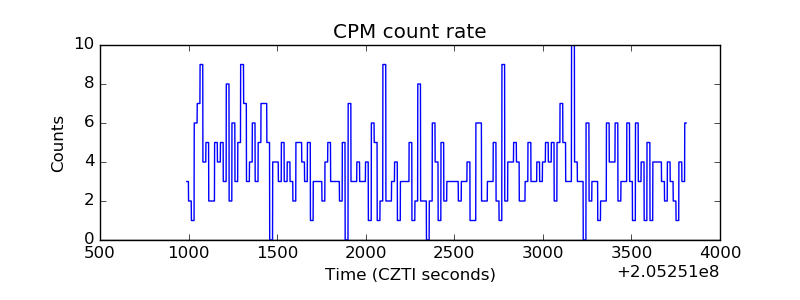 |
| CZT Counter | 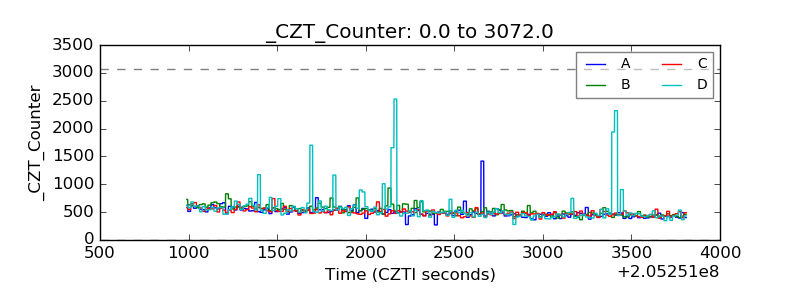 |
| +2.5 Volts monitor |  |
| +5 Volts monitor |  |
| _ROLL_ROT | 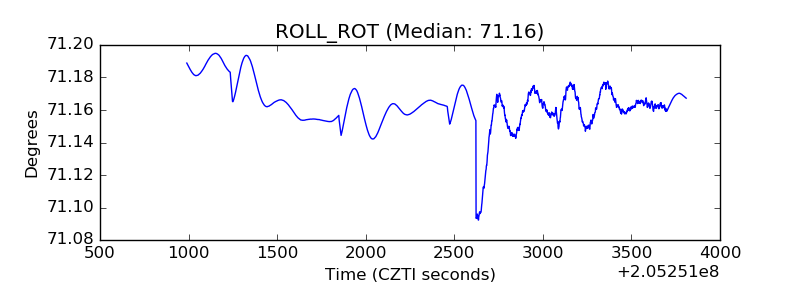 |
| _Roll_DEC | 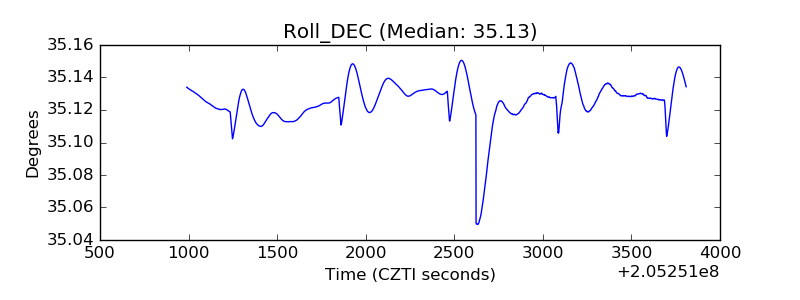 |
| _Roll_RA | 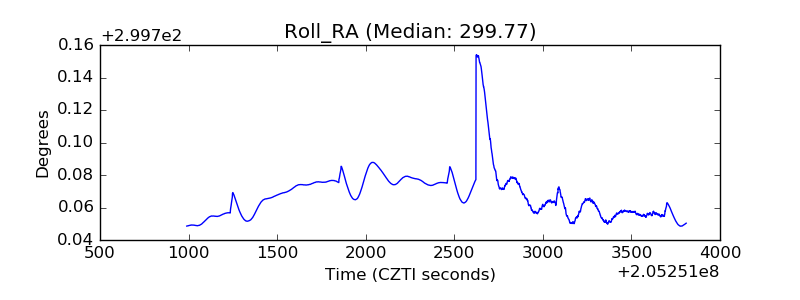 |
| Veto Counter | 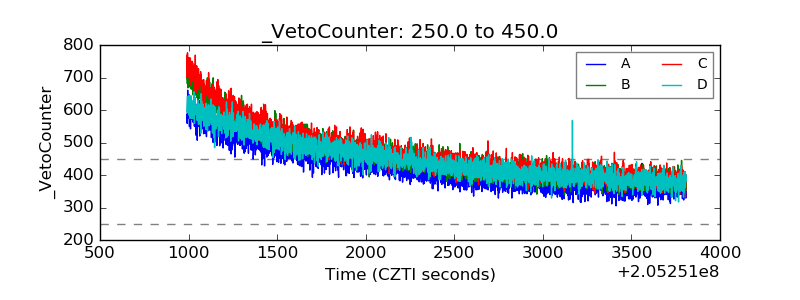 |