| Param | Original file | Final file |
|---|---|---|
| Filename | modeM0/AS1SLEW_01234_9000000531_04135cztM0_level2.evt | modeM0/AS1SLEW_01234_9000000531_04135cztM0_level2_quad_clean.evt |
| Size (bytes) | 118,681,920 | 9,348,480 |
| Size | 113.2 MB | 8.9 MB |
| Events in quadrant A | 725,264 | 43,615 |
| Events in quadrant B | 796,910 | 43,496 |
| Events in quadrant C | 686,947 | 41,611 |
| Events in quadrant D | 1,277,701 | 39,840 |
| Mode M0 | |||
|---|---|---|---|
| Quadrant | BADHDUFLAG | Total packets | Discarded packets |
| A | 0 | 3129 | 0 |
| B | 0 | 3267 | 0 |
| C | 0 | 3074 | 0 |
| D | 0 | 4787 | 0 |
| Mode SS | |||
|---|---|---|---|
| Quadrant | BADHDUFLAG | Total packets | Discarded packets |
| A | 0 | 32 | 0 |
| B | 0 | 32 | 0 |
| C | 0 | 32 | 0 |
| D | 0 | 32 | 0 |
| Quadrant | Total seconds | Saturated seconds | Saturation percentage |
|---|---|---|---|
| A | 1533 | 1 | 0.065232% |
| B | 1533 | 3 | 0.195695% |
| C | 1533 | 0 | 0.000000% |
| D | 1533 | 220 | 14.350946% |
Noise dominated data is calculated using 1-second bins in cleaned event files. If a bin has >2000 counts, and if more than 50% of those come from <1% of pixels, then it is considered to be noise-dominated and hence unusable.
| Quadrant | # 1 sec bins | Bins with >0 counts | Bins with >2000 counts | High rate bins dominated by noise | Noise dominated (total time) | Noise dominated (detector-on time) | Marked lightcurve |
|---|---|---|---|---|---|---|---|
| A | 1533 | 1533 | 1 | 1 | 0.07% | 0.07% | 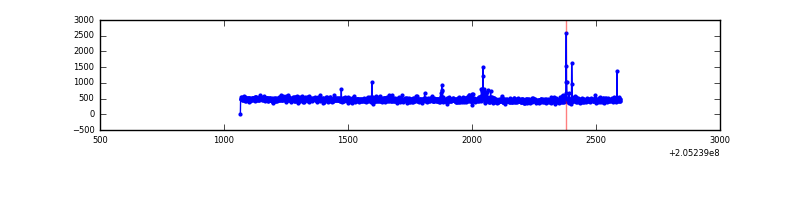 |
| B | 1533 | 1533 | 2 | 2 | 0.13% | 0.13% | 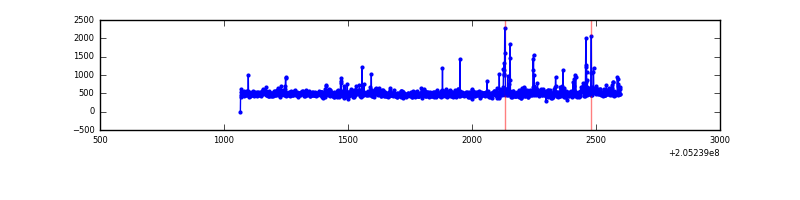 |
| C | 1533 | 1533 | 0 | 0 | 0.00% | 0.00% | 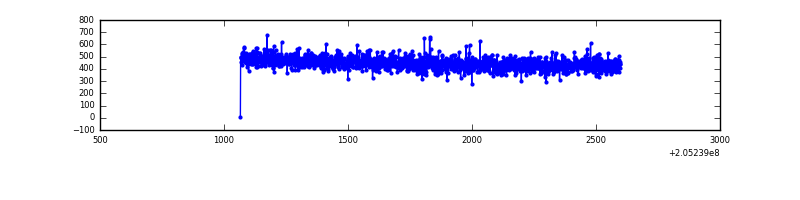 |
| D | 1533 | 1533 | 215 | 215 | 14.02% | 14.02% | 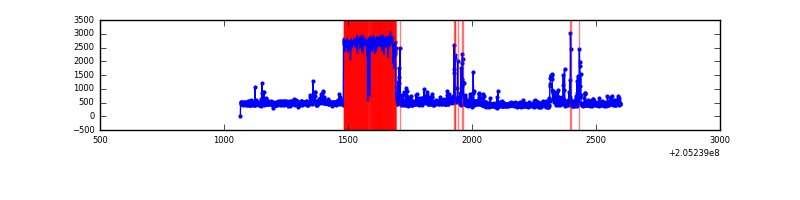 |
Top three noisy pixels from each quadrant. If the there are fewer than three noisy pixels in the level2.evt file, extra rows are filled as -1
| Pixel properties | Quadrant properties | ||||||
|---|---|---|---|---|---|---|---|
| Quadrant | DetID | PixID | Counts | Sigma | Mean | Median | Sigma |
| A | 0 | 118 | 14563 | 371.32 | 179 | 175 | 38.7 |
| A | 13 | 14 | 12004 | 305.28 | 179 | 175 | 38.7 |
| A | 15 | 234 | 4030 | 99.49 | 179 | 175 | 38.7 |
| B | 15 | 204 | 25547 | 699.34 | 179 | 174 | 36.3 |
| B | 4 | 81 | 21892 | 598.6 | 179 | 174 | 36.3 |
| B | 15 | 54 | 14986 | 408.25 | 179 | 174 | 36.3 |
| C | 10 | 65 | 2634 | 58.33 | 174 | 175 | 42.2 |
| C | 13 | 61 | 1468 | 30.67 | 174 | 175 | 42.2 |
| C | 12 | 4 | 1297 | 26.61 | 174 | 175 | 42.2 |
| D | 13 | 53 | 531308 | 13264.31 | 158 | 153 | 40.0 |
| D | 2 | 63 | 54029 | 1345.42 | 158 | 153 | 40.0 |
| D | 12 | 233 | 39996 | 994.98 | 158 | 153 | 40.0 |
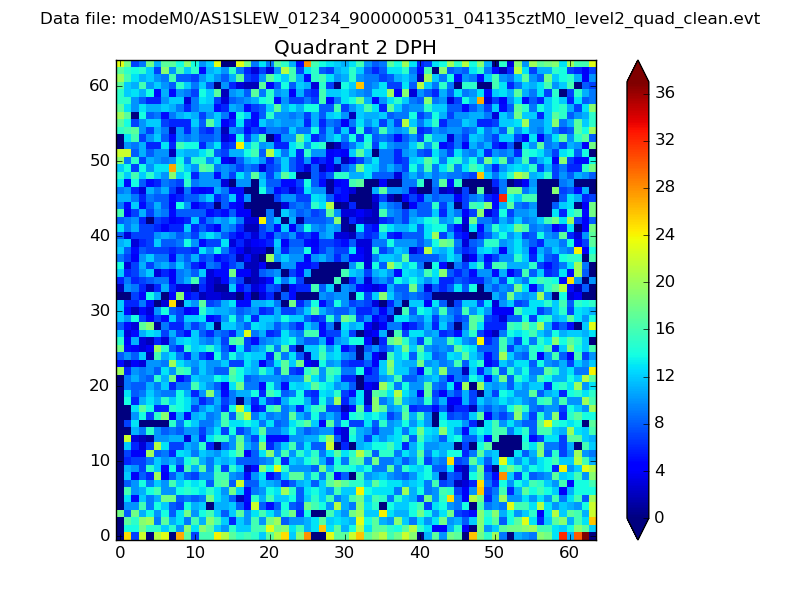
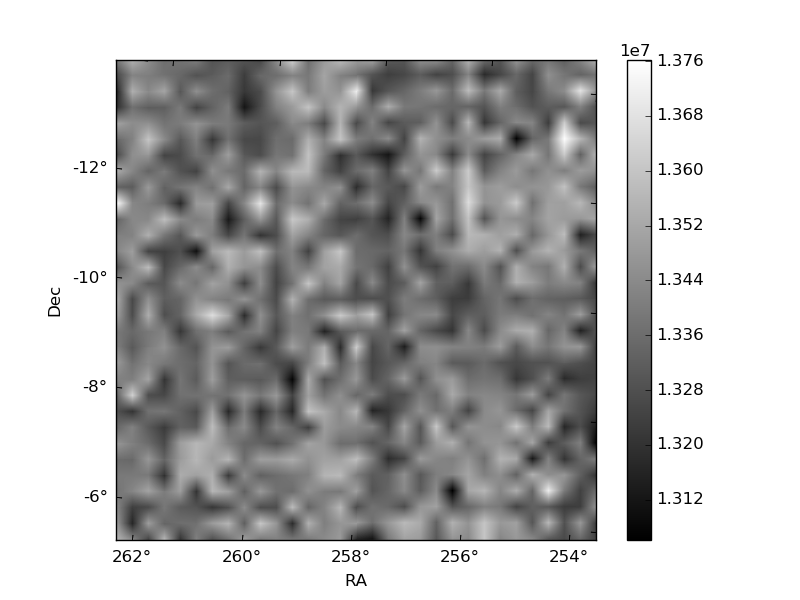
Histogram calculated using DETX and DETY for each event in the final _common_clean file
| Quadrant A | 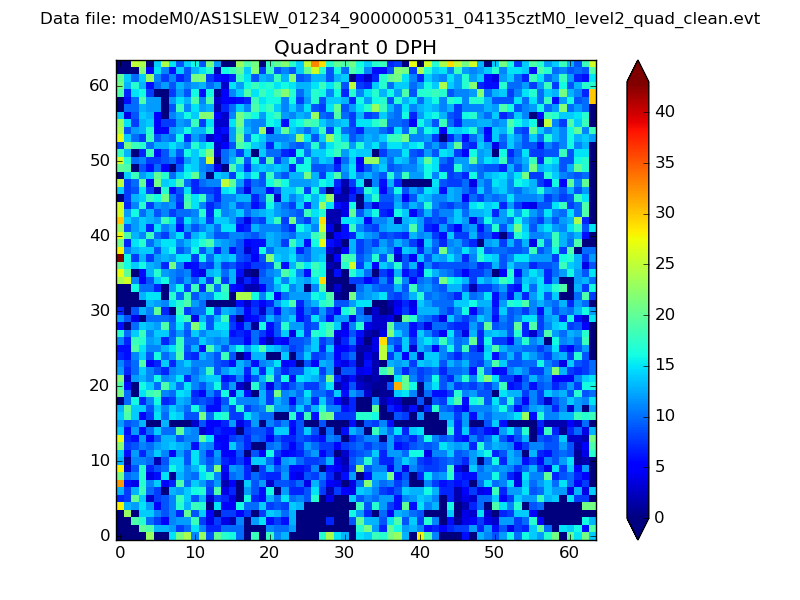 |
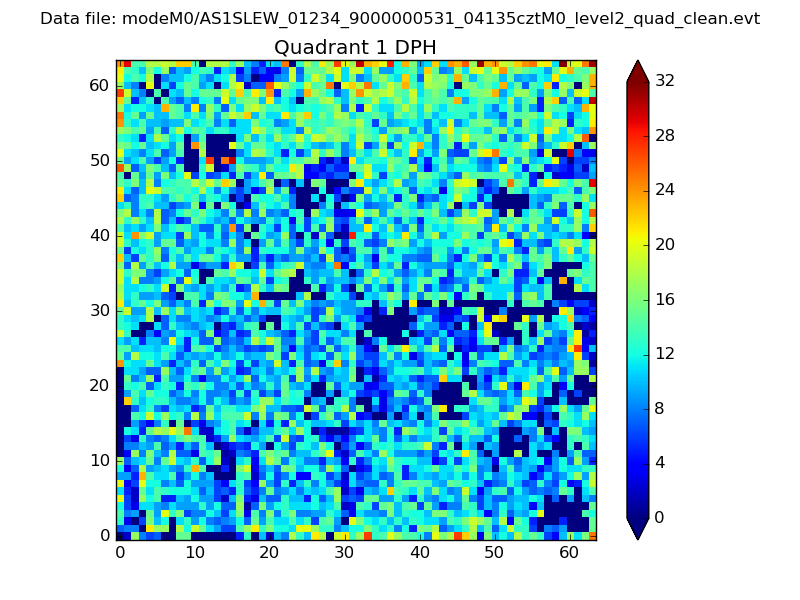 |
Quadrant B |
|---|---|---|---|
| Quadrant D | 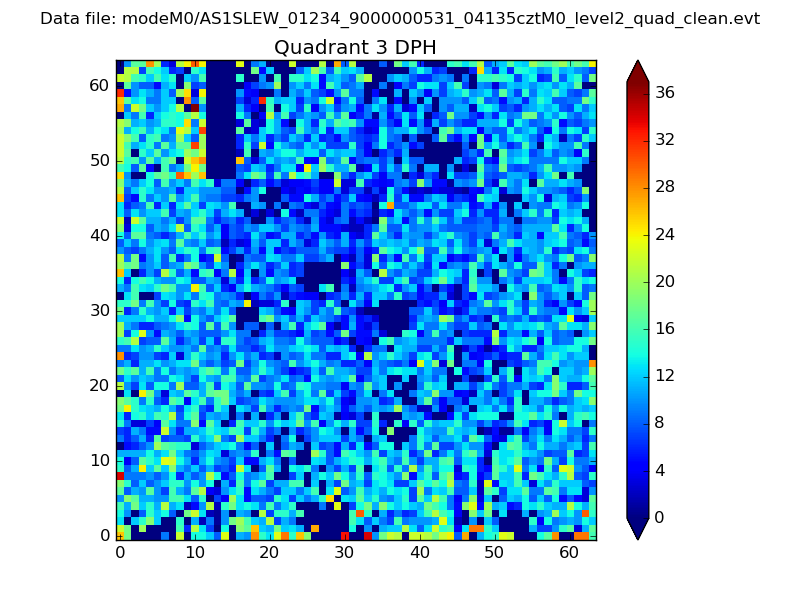 |
 |
Quadrant C |
| Plot type | Count rate plots | Images |
|---|---|---|
| Comparison with Poisson distribution Blue bars denote a histogram of data divided into 1 sec bins. Red curve is a Poisson curve with rate = median count rate of data. |
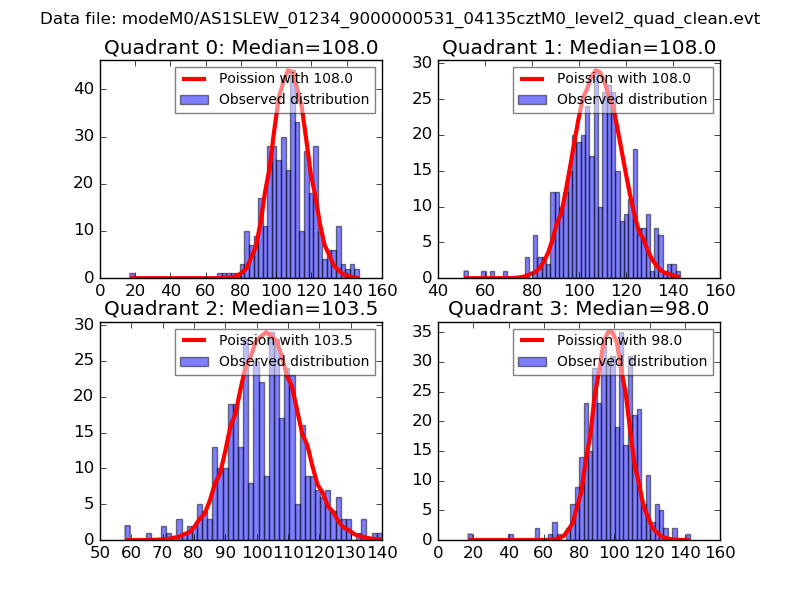 |
 |
| Quadrant-wise count rates Data is divided into 100 sec bins |
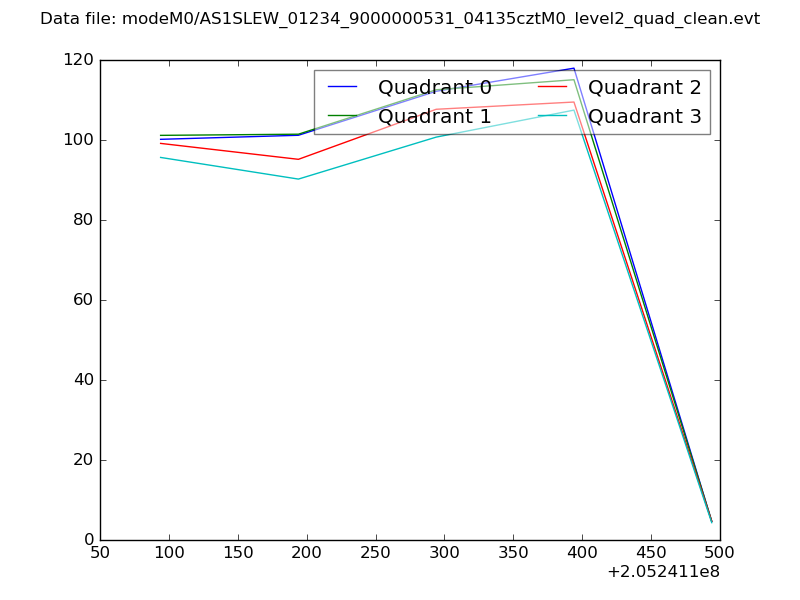 |
|
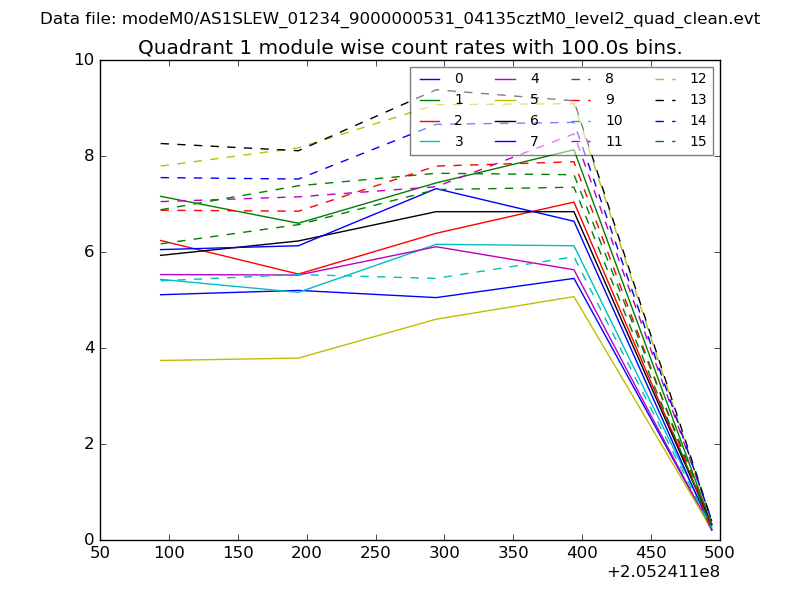
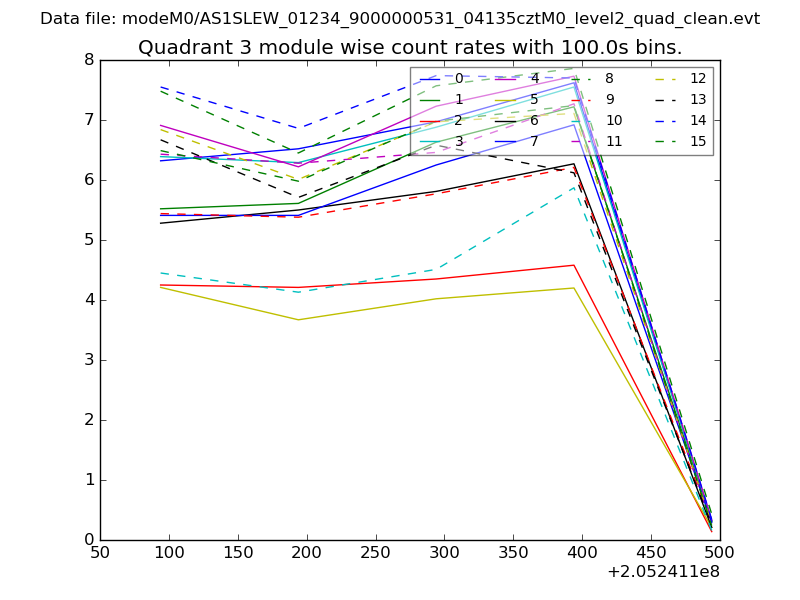
| Module-wise count rates for Quadrant A Data is divided into 100 sec bins |
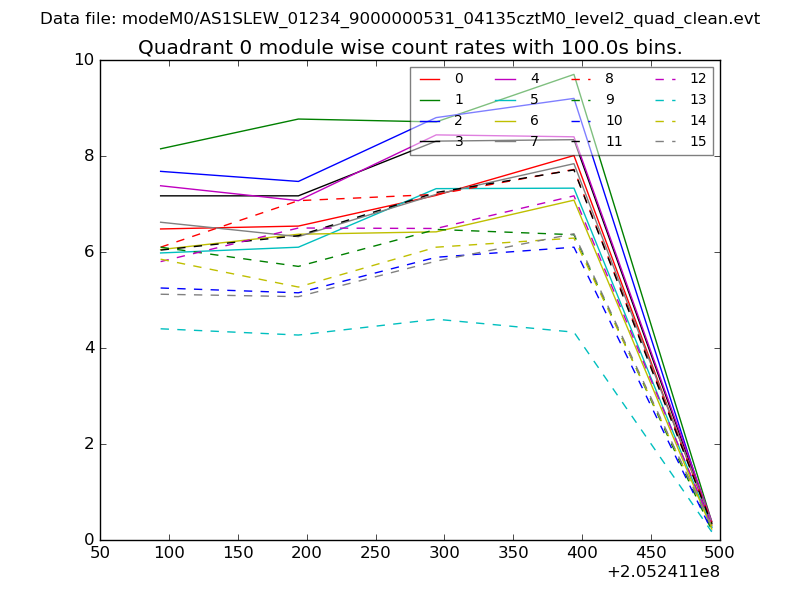 |
 |
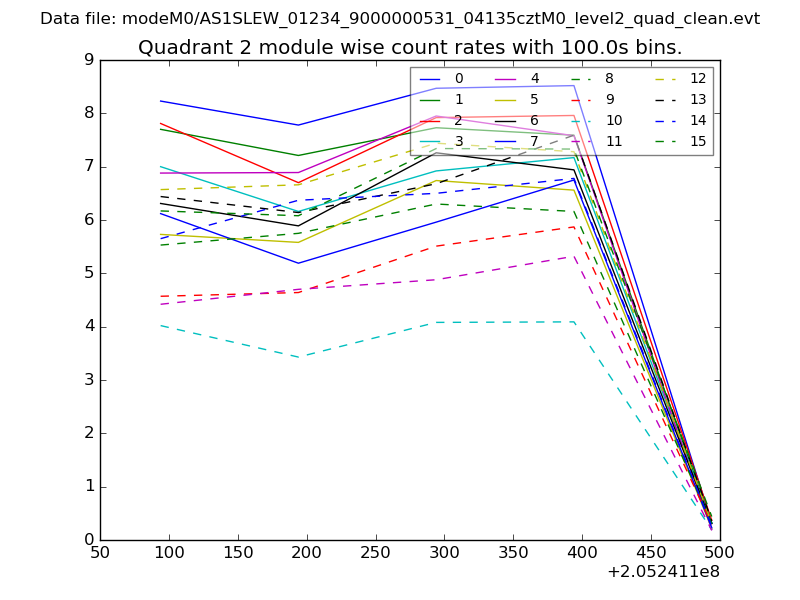
| Module-wise count rates for Quadrant B Data is divided into 100 sec bins |
 |
 |
| Module-wise count rates for Quadrant C Data is divided into 100 sec bins |
 |
 |
| Module-wise count rates for Quadrant D Data is divided into 100 sec bins |
 |
 |
| Parameter | Plot |
|---|---|
| CZT HV Monitor | 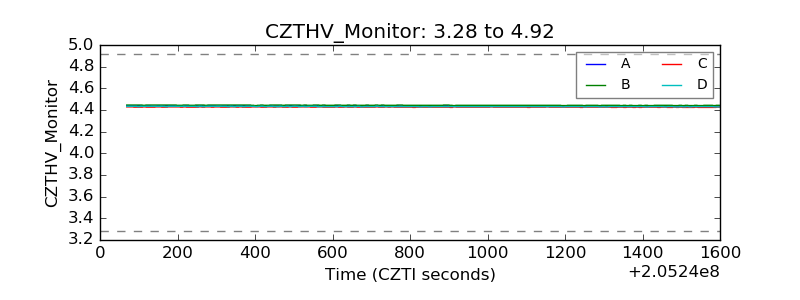 |
| D_VDD | 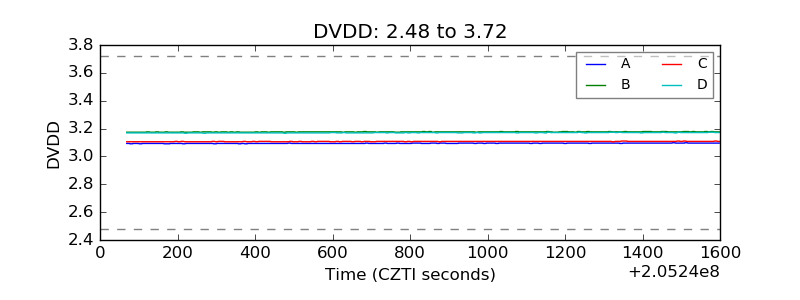 |
| Temperature 1 |  |
| Veto HV Monitor | 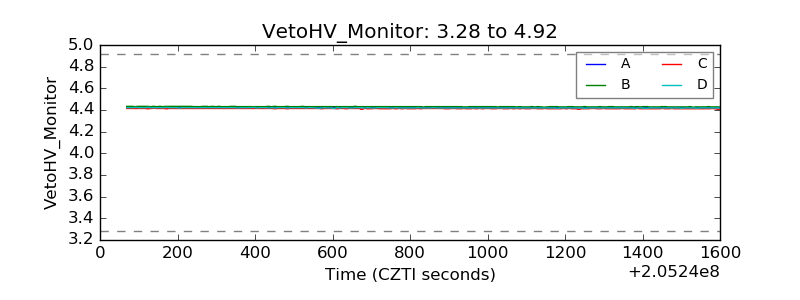 |
| Veto LLD |  |
| Alpha Counter | 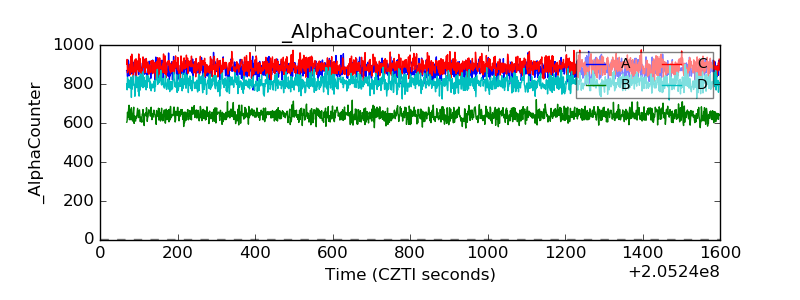 |
| _CPM_Rate | 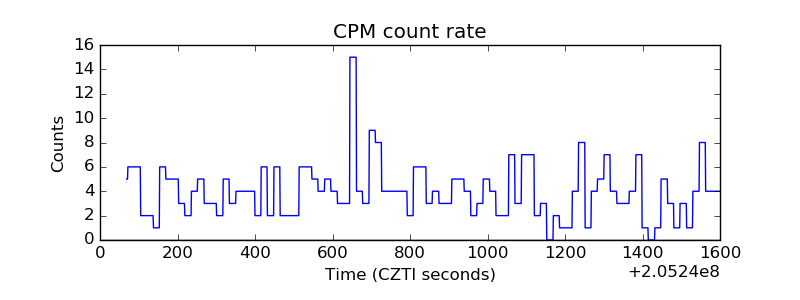 |
| CZT Counter | 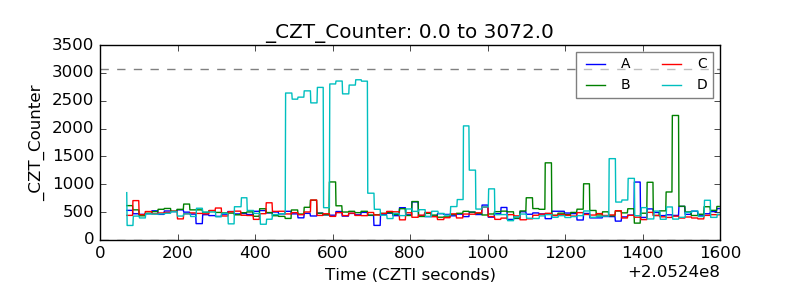 |
| +2.5 Volts monitor |  |
| +5 Volts monitor |  |
| _ROLL_ROT | 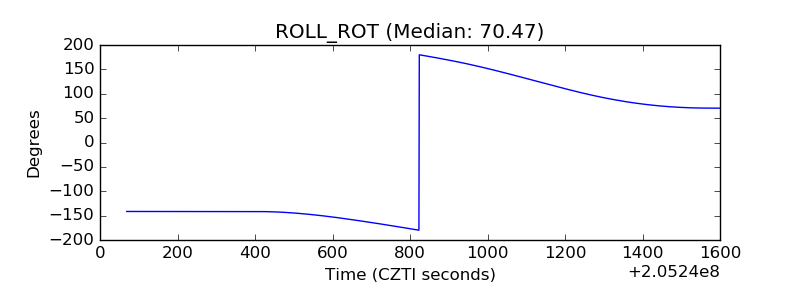 |
| _Roll_DEC | 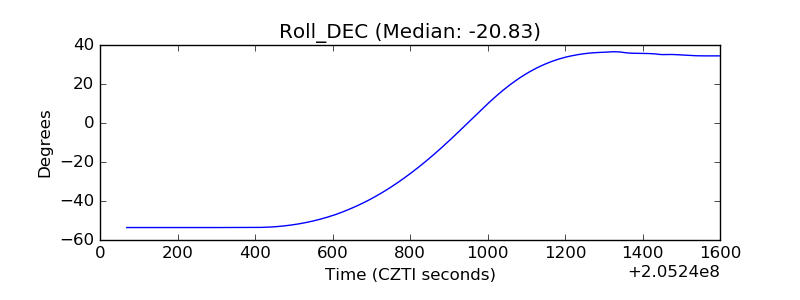 |
| _Roll_RA |  |
| Veto Counter | 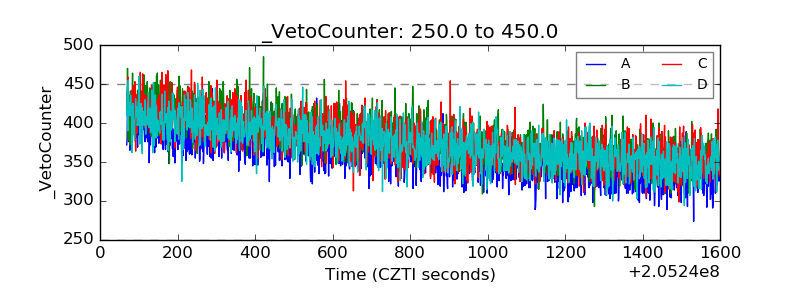 |