| Param | Original file | Final file |
|---|---|---|
| Filename | modeM0/AS1SLEW_01234_9000000533_04138cztM0_level2.evt | modeM0/AS1SLEW_01234_9000000533_04138cztM0_level2_quad_clean.evt |
| Size (bytes) | 99,264,960 | 5,374,080 |
| Size | 94.7 MB | 5.1 MB |
| Events in quadrant A | 688,565 | 12,061 |
| Events in quadrant B | 706,087 | 12,459 |
| Events in quadrant C | 698,166 | 11,864 |
| Events in quadrant D | 805,827 | 11,683 |
| Mode M0 | |||
|---|---|---|---|
| Quadrant | BADHDUFLAG | Total packets | Discarded packets |
| A | 0 | 3095 | 0 |
| B | 0 | 3106 | 0 |
| C | 0 | 3100 | 0 |
| D | 0 | 3466 | 0 |
| Mode SS | |||
|---|---|---|---|
| Quadrant | BADHDUFLAG | Total packets | Discarded packets |
| A | 0 | 30 | 0 |
| B | 0 | 30 | 0 |
| C | 0 | 30 | 0 |
| D | 0 | 30 | 0 |
| Quadrant | Total seconds | Saturated seconds | Saturation percentage |
|---|---|---|---|
| A | 1542 | 0 | 0.000000% |
| B | 1542 | 0 | 0.000000% |
| C | 1542 | 0 | 0.000000% |
| D | 1542 | 17 | 1.102464% |
Noise dominated data is calculated using 1-second bins in cleaned event files. If a bin has >2000 counts, and if more than 50% of those come from <1% of pixels, then it is considered to be noise-dominated and hence unusable.
| Quadrant | # 1 sec bins | Bins with >0 counts | Bins with >2000 counts | High rate bins dominated by noise | Noise dominated (total time) | Noise dominated (detector-on time) | Marked lightcurve |
|---|---|---|---|---|---|---|---|
| A | 1542 | 1542 | 0 | 0 | 0.00% | 0.00% |  |
| B | 1542 | 1542 | 0 | 0 | 0.00% | 0.00% | 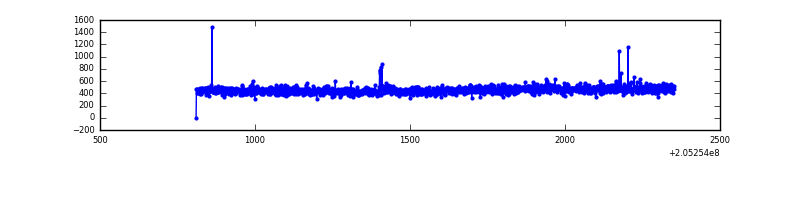 |
| C | 1542 | 1542 | 0 | 0 | 0.00% | 0.00% | 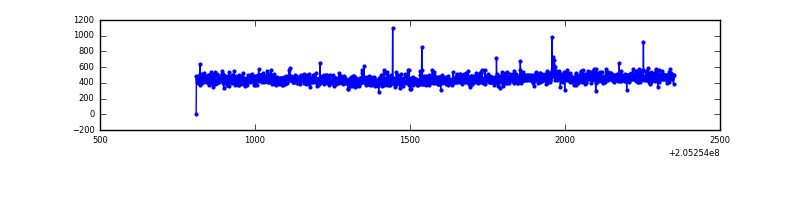 |
| D | 1541 | 1541 | 18 | 18 | 1.17% | 1.17% | 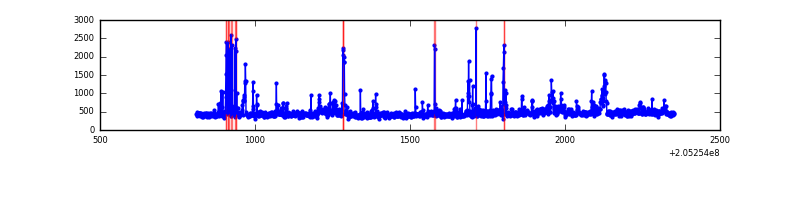 |
Top three noisy pixels from each quadrant. If the there are fewer than three noisy pixels in the level2.evt file, extra rows are filled as -1
| Pixel properties | Quadrant properties | ||||||
|---|---|---|---|---|---|---|---|
| Quadrant | DetID | PixID | Counts | Sigma | Mean | Median | Sigma |
| A | 13 | 14 | 9163 | 237.26 | 175 | 172 | 37.9 |
| A | 0 | 226 | 1743 | 41.46 | 175 | 172 | 37.9 |
| A | 12 | 194 | 1709 | 40.56 | 175 | 172 | 37.9 |
| B | 4 | 81 | 4041 | 106.65 | 179 | 175 | 36.2 |
| B | 10 | 16 | 3275 | 85.52 | 179 | 175 | 36.2 |
| B | 12 | 111 | 3048 | 79.26 | 179 | 175 | 36.2 |
| C | 10 | 65 | 14370 | 332.62 | 174 | 175 | 42.7 |
| C | 13 | 61 | 1519 | 31.49 | 174 | 175 | 42.7 |
| C | 5 | 251 | 551 | 8.81 | 174 | 175 | 42.7 |
| D | 10 | 172 | 75777 | 1776.09 | 170 | 165 | 42.6 |
| D | 13 | 239 | 41218 | 964.31 | 170 | 165 | 42.6 |
| D | 13 | 137 | 28052 | 655.05 | 170 | 165 | 42.6 |
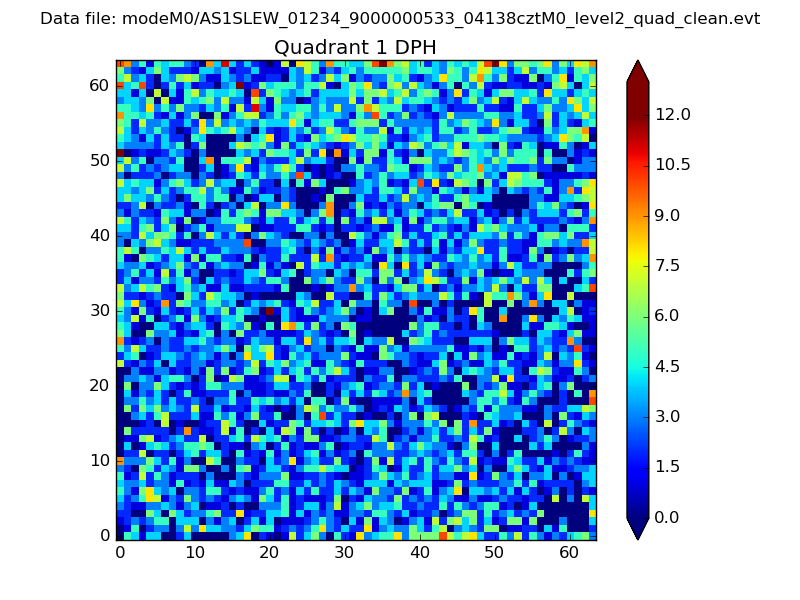
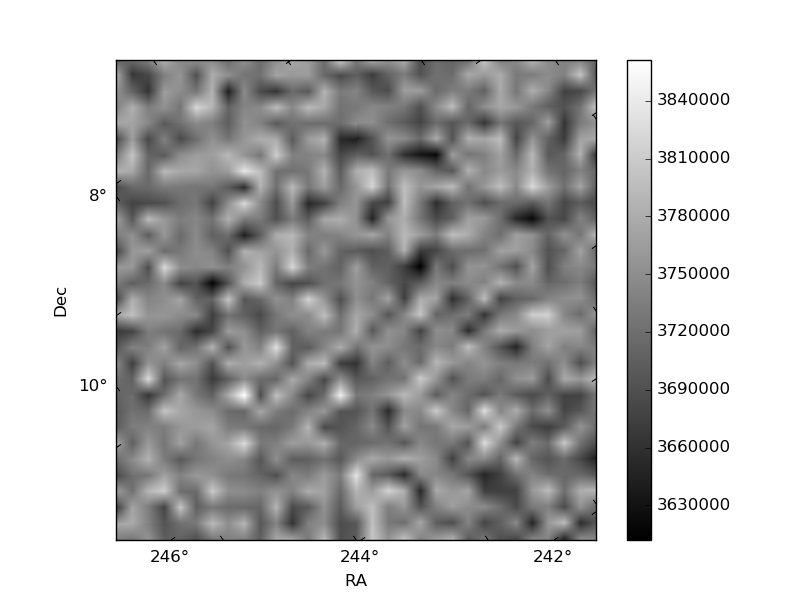
Histogram calculated using DETX and DETY for each event in the final _common_clean file
| Quadrant A |  |
 |
Quadrant B |
|---|---|---|---|
| Quadrant D | 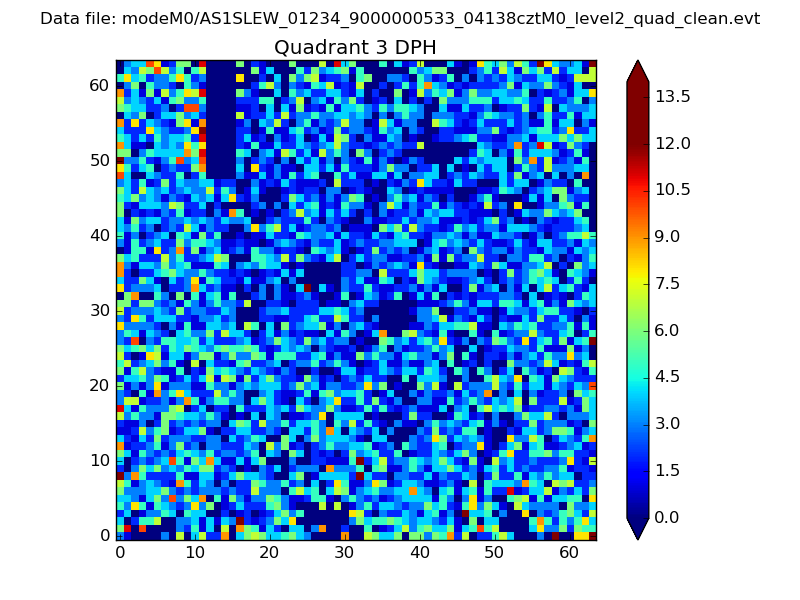 |
 |
Quadrant C |
| Plot type | Count rate plots | Images |
|---|---|---|
| Comparison with Poisson distribution Blue bars denote a histogram of data divided into 1 sec bins. Red curve is a Poisson curve with rate = median count rate of data. |
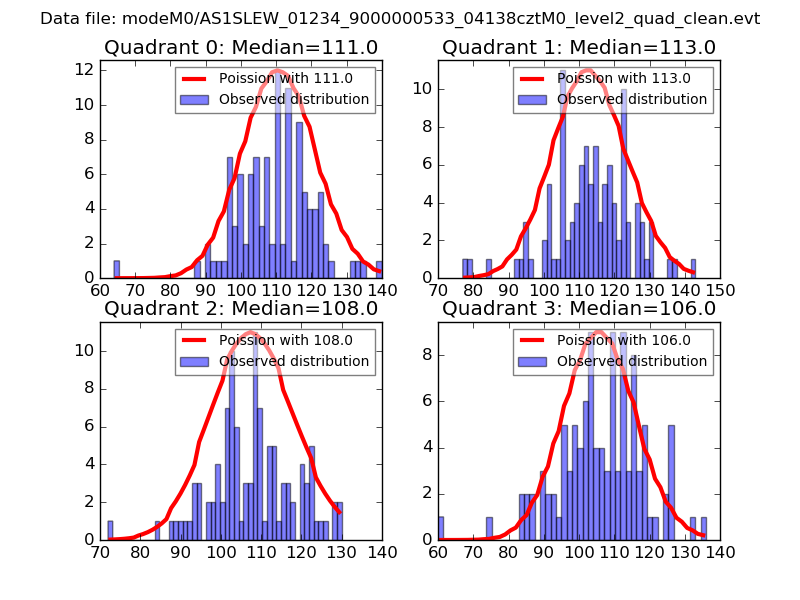 |
 |
| Quadrant-wise count rates Data is divided into 100 sec bins |
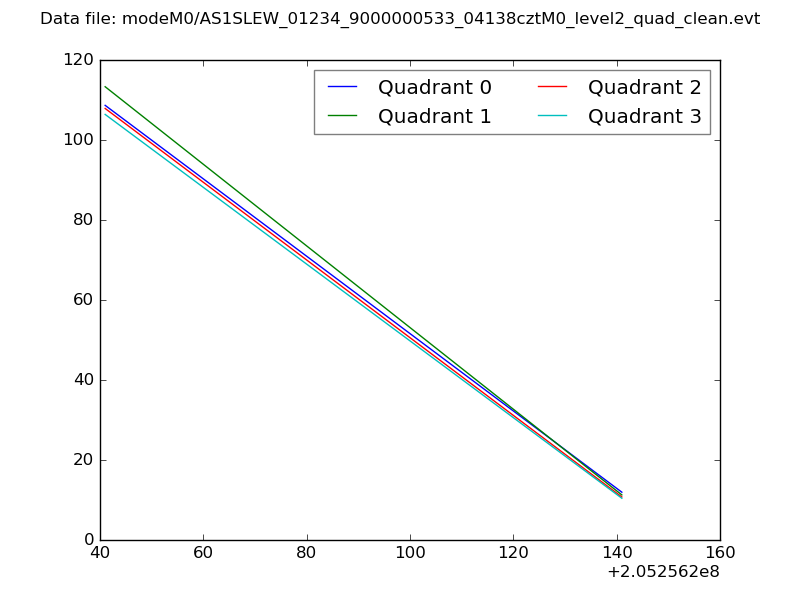 |
|
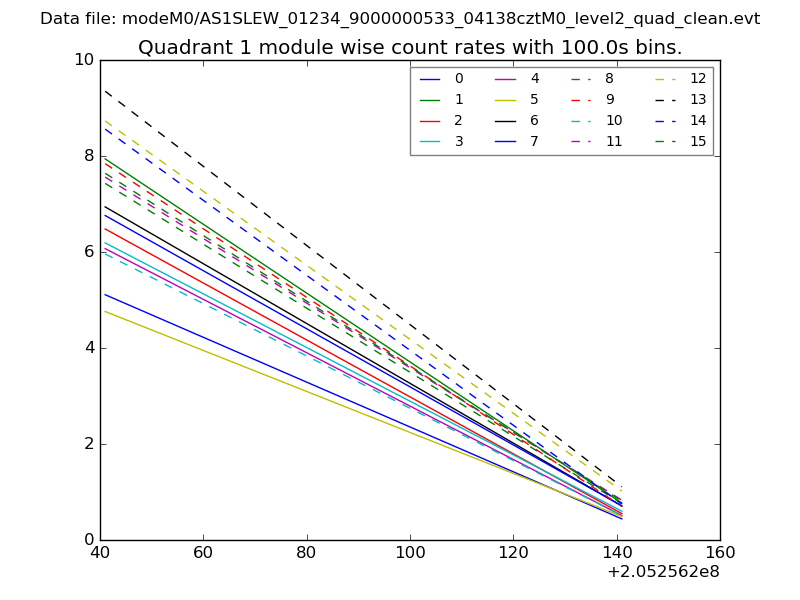
| Module-wise count rates for Quadrant A Data is divided into 100 sec bins |
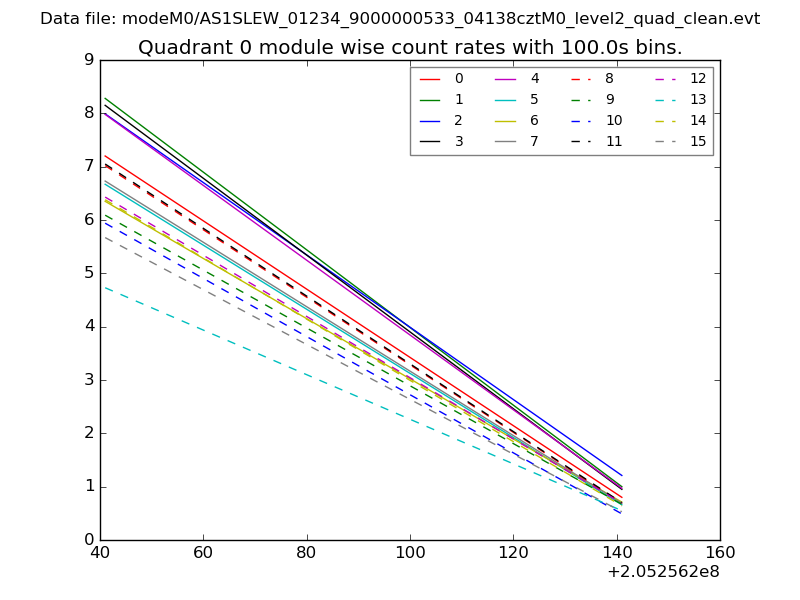 |
 |
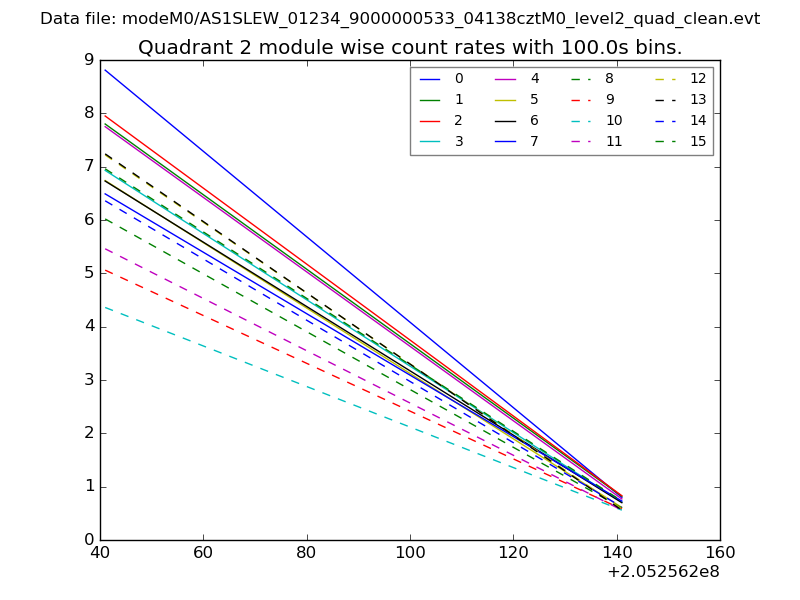
| Module-wise count rates for Quadrant B Data is divided into 100 sec bins |
 |
 |
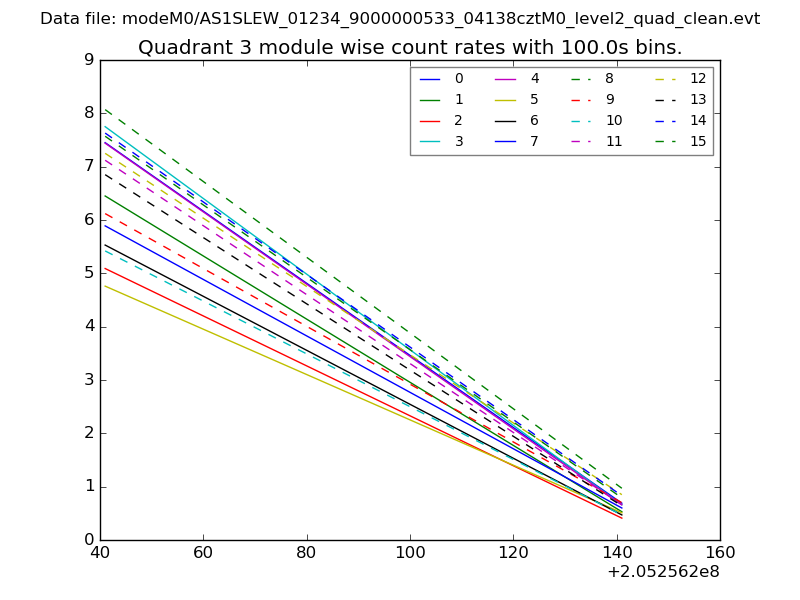
| Module-wise count rates for Quadrant C Data is divided into 100 sec bins |
 |
 |
| Module-wise count rates for Quadrant D Data is divided into 100 sec bins |
 |
 |
| Parameter | Plot |
|---|---|
| CZT HV Monitor | 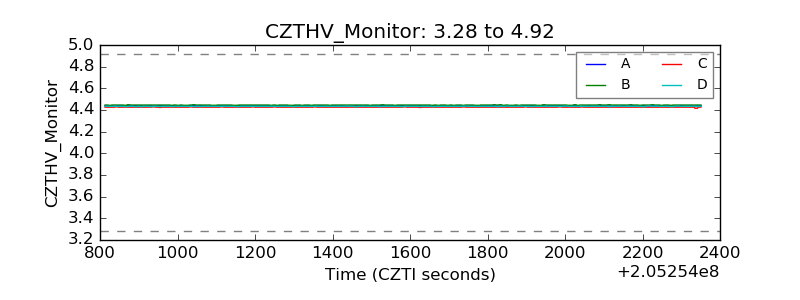 |
| D_VDD | 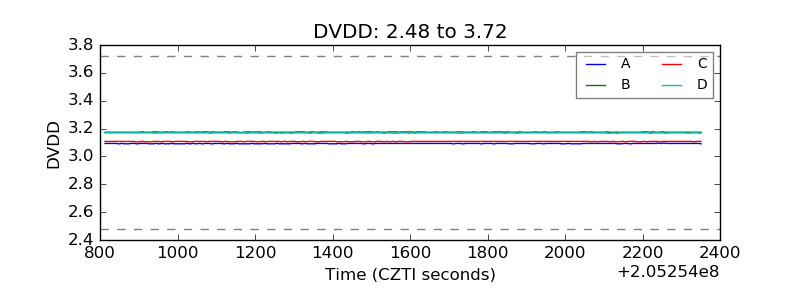 |
| Temperature 1 | 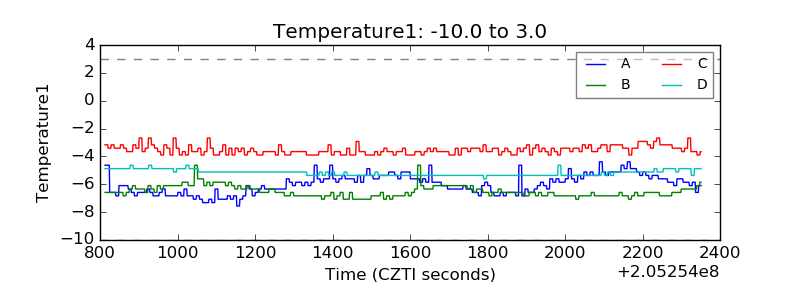 |
| Veto HV Monitor | 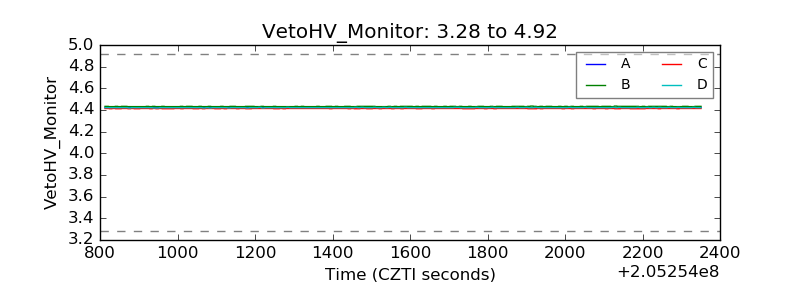 |
| Veto LLD | 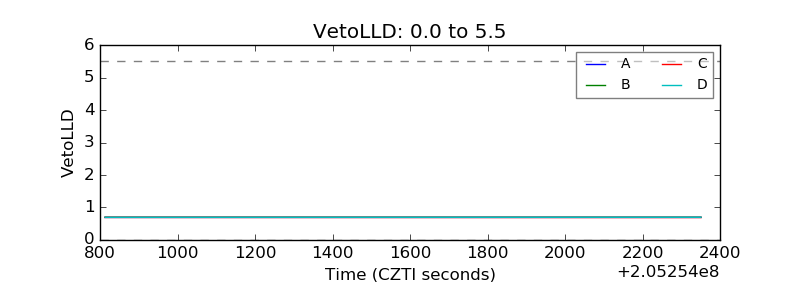 |
| Alpha Counter | 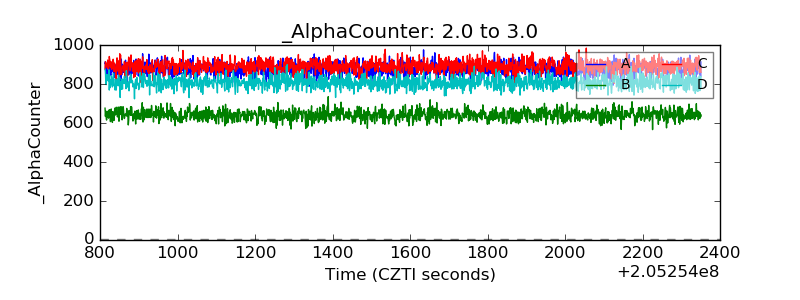 |
| _CPM_Rate | 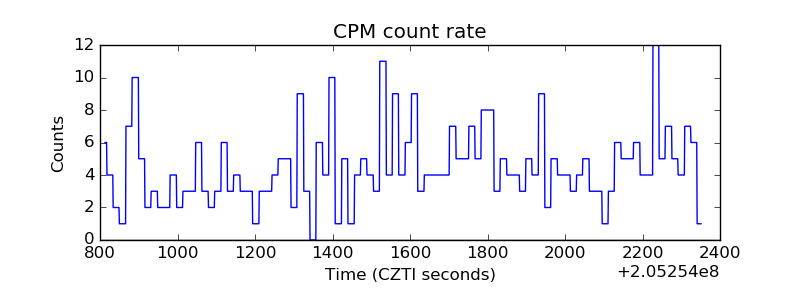 |
| CZT Counter | 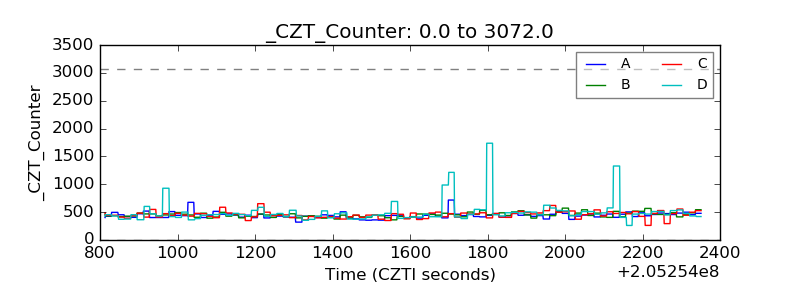 |
| +2.5 Volts monitor |  |
| +5 Volts monitor |  |
| _ROLL_ROT | 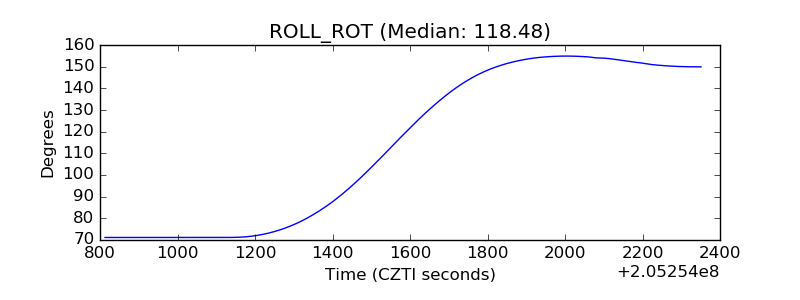 |
| _Roll_DEC | 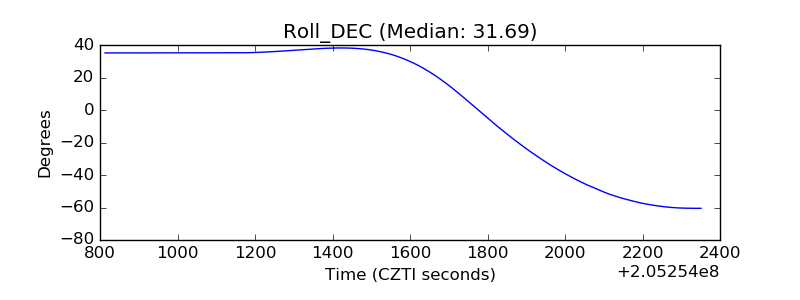 |
| _Roll_RA |  |
| Veto Counter | 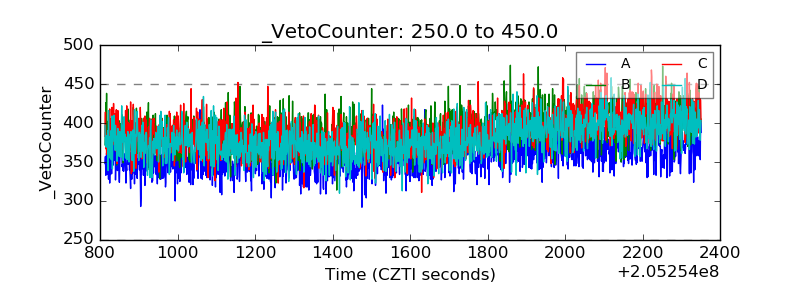 |