| Param | Original file | Final file |
|---|---|---|
| Filename | modeM0/AS1G05_256T01_9000000538cztM0_level2.fits | modeM0/AS1G05_256T01_9000000538cztM0_level2_quad_clean.evt |
| Size (bytes) | 474,287,040 | 662,169,600 |
| Size | 452.3 MB | 631.5 MB |
| Events in quadrant A | 2,866,884 | 4,486,707 |
| Events in quadrant B | 2,762,928 | 4,450,106 |
| Events in quadrant C | 2,531,374 | 3,460,334 |
| Events in quadrant D | 2,355,204 | 3,819,981 |
| Mode SS | |||
|---|---|---|---|
| Quadrant | BADHDUFLAG | Total packets | Discarded packets |
| A | 0 | 1190 | 0 |
| B | 0 | 1192 | 0 |
| C | 0 | 1192 | 0 |
| D | 0 | 1192 | 0 |
| Mode M0 | |||
|---|---|---|---|
| Quadrant | BADHDUFLAG | Total packets | Discarded packets |
| A | 0 | 133705 | 0 |
| B | 0 | 132477 | 0 |
| C | 0 | 187577 | 0 |
| D | 0 | 177358 | 0 |
| Mode M9 | |||
|---|---|---|---|
| Quadrant | BADHDUFLAG | Total packets | Discarded packets |
| A | 0 | 65 | 0 |
| B | 0 | 65 | 0 |
| C | 0 | 65 | 0 |
| D | 0 | 65 | 0 |
| Quadrant | Total seconds | Saturated seconds | Saturation percentage |
|---|---|---|---|
| A | 55747 | 2026 | 3.634276% |
| B | 55758 | 1575 | 2.824707% |
| C | 55751 | 10951 | 19.642697% |
| D | 55751 | 5836 | 10.467974% |
Noise dominated data is calculated using 1-second bins in cleaned event files. If a bin has >2000 counts, and if more than 50% of those come from <1% of pixels, then it is considered to be noise-dominated and hence unusable.
| Quadrant | # 1 sec bins | Bins with >0 counts | Bins with >2000 counts | High rate bins dominated by noise | Noise dominated (total time) | Noise dominated (detector-on time) | Marked lightcurve |
|---|---|---|---|---|---|---|---|
| A | 62516 | 55794 | 0 | 0 | 0.00% | 0.00% |  |
| B | 62516 | 55801 | 0 | 0 | 0.00% | 0.00% |  |
| C | 62515 | 55793 | 0 | 0 | 0.00% | 0.00% |  |
| D | 62516 | 55765 | 0 | 0 | 0.00% | 0.00% |  |
Top three noisy pixels from each quadrant. If the there are fewer than three noisy pixels in the level2.evt file, extra rows are filled as -1
| Pixel properties | Quadrant properties | ||||||
|---|---|---|---|---|---|---|---|
| Quadrant | DetID | PixID | Counts | Sigma | Mean | Median | Sigma |
| A | 0 | 29 | 2930 | 11.62 | 744 | 696 | 192.2 |
| A | 14 | 188 | 2896 | 11.45 | 744 | 696 | 192.2 |
| A | 14 | 204 | 2456 | 9.16 | 744 | 696 | 192.2 |
| B | 2 | 9 | 2364 | 11.42 | 729 | 695 | 146.1 |
| B | 14 | 254 | 2035 | 9.17 | 729 | 695 | 146.1 |
| B | 12 | 226 | 2035 | 9.17 | 729 | 695 | 146.1 |
| C | 1 | 81 | 1864 | 6.99 | 670 | 622 | 177.7 |
| C | 1 | 80 | 1850 | 6.91 | 670 | 622 | 177.7 |
| C | 2 | 191 | 1747 | 6.33 | 670 | 622 | 177.7 |
| D | 11 | 82 | 2076 | 7.96 | 672 | 608 | 184.3 |
| D | 7 | 5 | 1803 | 6.48 | 672 | 608 | 184.3 |
| D | 3 | 14 | 1732 | 6.1 | 672 | 608 | 184.3 |
Histogram calculated using DETX and DETY for each event in the final _common_clean file
| Quadrant A | 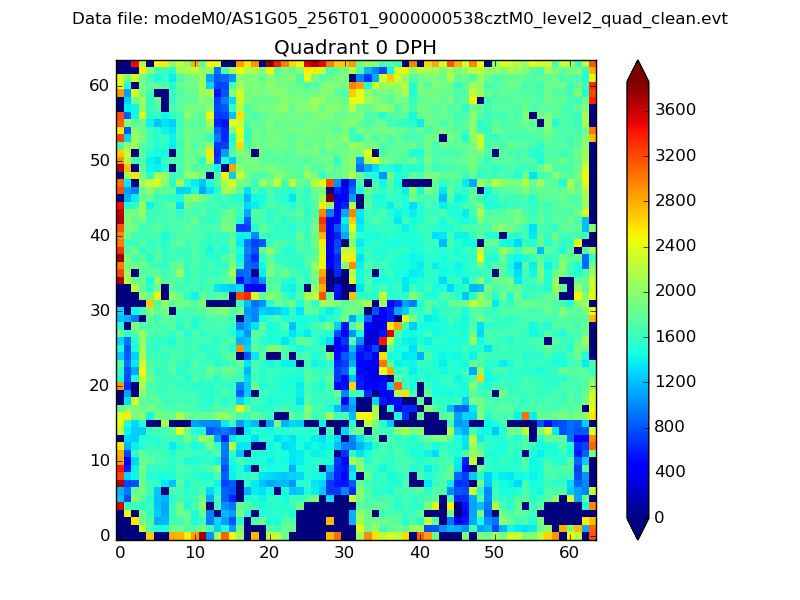 |
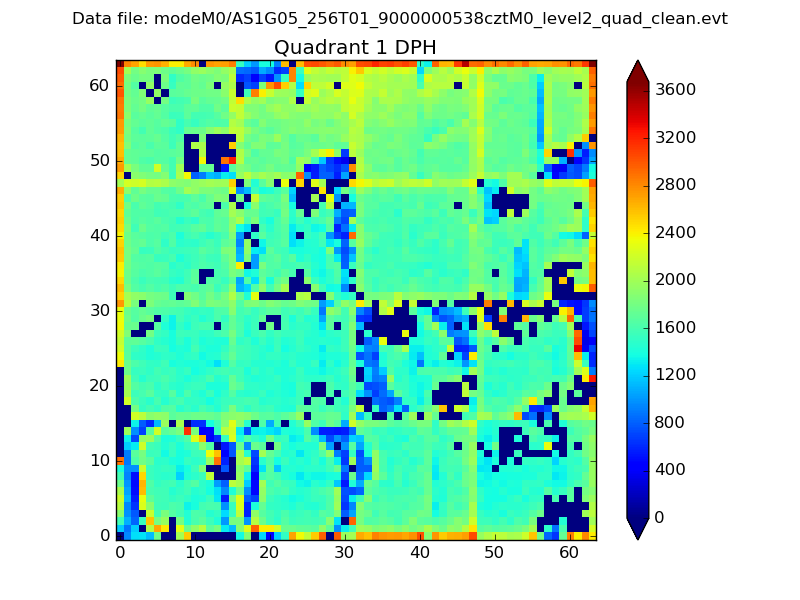 |
Quadrant B |
|---|---|---|---|
| Quadrant D | 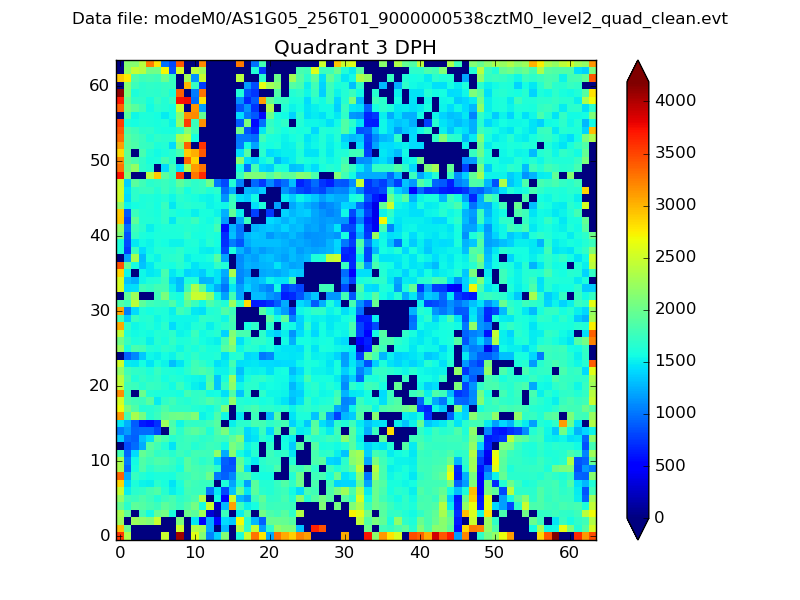 |
 |
Quadrant C |
| Plot type | Count rate plots | Images |
|---|---|---|
| Comparison with Poisson distribution Blue bars denote a histogram of data divided into 1 sec bins. Red curve is a Poisson curve with rate = median count rate of data. |
 |
 |
| Quadrant-wise count rates Data is divided into 100 sec bins |
 |
|
| Module-wise count rates for Quadrant A Data is divided into 100 sec bins |
 |
 |
| Module-wise count rates for Quadrant B Data is divided into 100 sec bins |
 |
 |
| Module-wise count rates for Quadrant C Data is divided into 100 sec bins |
 |
 |
| Module-wise count rates for Quadrant D Data is divided into 100 sec bins |
 |
 |
| Parameter | Plot |
|---|---|
| CZT HV Monitor |  |
| D_VDD |  |
| Temperature 1 |  |
| Veto HV Monitor |  |
| Veto LLD |  |
| Alpha Counter |  |
| _CPM_Rate |  |
| CZT Counter |  |
| +2.5 Volts monitor |  |
| +5 Volts monitor |  |
| _ROLL_ROT |  |
| _Roll_DEC |  |
| _Roll_RA |  |
| Veto Counter |  |