| Param | Original file | Final file |
|---|---|---|
| Filename | modeM0/AS1G05_256T01_9000000538_04286cztM0_level2.evt | modeM0/AS1G05_256T01_9000000538_04286cztM0_level2_quad_clean.evt |
| Size (bytes) | 479,787,840 | 78,376,320 |
| Size | 457.6 MB | 74.7 MB |
| Events in quadrant A | 2,704,403 | 534,325 |
| Events in quadrant B | 3,918,544 | 498,827 |
| Events in quadrant C | 2,202,082 | 513,838 |
| Events in quadrant D | 5,358,082 | 467,493 |
| Mode SS | |||
|---|---|---|---|
| Quadrant | BADHDUFLAG | Total packets | Discarded packets |
| A | 0 | 104 | 0 |
| B | 0 | 104 | 0 |
| C | 0 | 104 | 0 |
| D | 0 | 104 | 0 |
| Mode M0 | |||
|---|---|---|---|
| Quadrant | BADHDUFLAG | Total packets | Discarded packets |
| A | 0 | 11531 | 2 |
| B | 0 | 15268 | 1 |
| C | 0 | 10412 | 1 |
| D | 0 | 19486 | 1 |
| Mode M9 | |||
|---|---|---|---|
| Quadrant | BADHDUFLAG | Total packets | Discarded packets |
| A | 0 | 10 | 0 |
| B | 0 | 10 | 0 |
| C | 0 | 10 | 0 |
| D | 0 | 10 | 0 |
| Quadrant | Total seconds | Saturated seconds | Saturation percentage |
|---|---|---|---|
| A | 5112 | 128 | 2.503912% |
| B | 5112 | 514 | 10.054773% |
| C | 5112 | 52 | 1.017214% |
| D | 5112 | 1167 | 22.828638% |
Noise dominated data is calculated using 1-second bins in cleaned event files. If a bin has >2000 counts, and if more than 50% of those come from <1% of pixels, then it is considered to be noise-dominated and hence unusable.
| Quadrant | # 1 sec bins | Bins with >0 counts | Bins with >2000 counts | High rate bins dominated by noise | Noise dominated (total time) | Noise dominated (detector-on time) | Marked lightcurve |
|---|---|---|---|---|---|---|---|
| A | 6172 | 5113 | 39 | 39 | 0.63% | 0.76% |  |
| B | 6172 | 5112 | 364 | 364 | 5.90% | 7.12% | 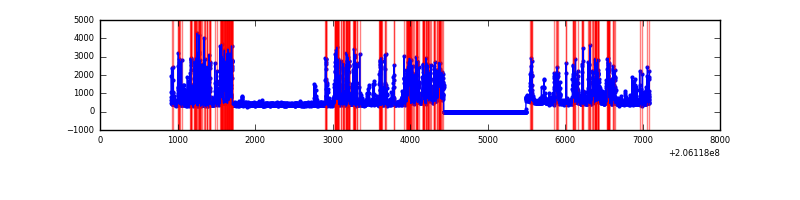 |
| C | 6172 | 5112 | 3 | 3 | 0.05% | 0.06% | 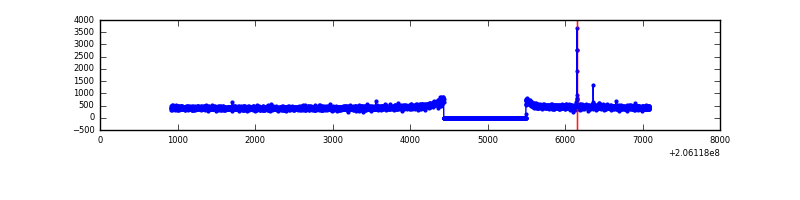 |
| D | 6172 | 5113 | 800 | 800 | 12.96% | 15.65% | 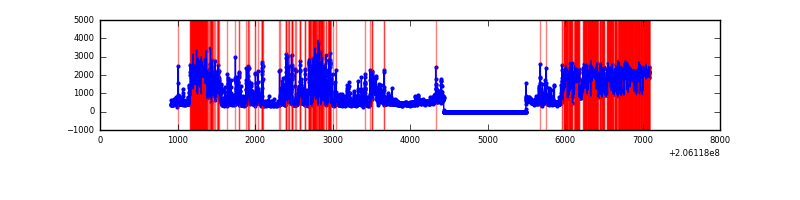 |
Top three noisy pixels from each quadrant. If the there are fewer than three noisy pixels in the level2.evt file, extra rows are filled as -1
| Pixel properties | Quadrant properties | ||||||
|---|---|---|---|---|---|---|---|
| Quadrant | DetID | PixID | Counts | Sigma | Mean | Median | Sigma |
| A | 0 | 50 | 246146 | 2111.67 | 573 | 561 | 116.3 |
| A | 8 | 15 | 129144 | 1105.62 | 573 | 561 | 116.3 |
| A | 0 | 199 | 80432 | 686.77 | 573 | 561 | 116.3 |
| B | 14 | 167 | 1595756 | 15000.31 | 559 | 545 | 106.3 |
| B | 10 | 16 | 102337 | 957.18 | 559 | 545 | 106.3 |
| B | 5 | 184 | 18970 | 173.26 | 559 | 545 | 106.3 |
| C | 15 | 224 | 13027 | 96.49 | 558 | 559 | 129.2 |
| C | 10 | 65 | 8640 | 62.54 | 558 | 559 | 129.2 |
| C | 13 | 61 | 4651 | 31.67 | 558 | 559 | 129.2 |
| D | 2 | 232 | 2716183 | 21847.05 | 520 | 504 | 124.3 |
| D | 2 | 63 | 468615 | 3765.85 | 520 | 504 | 124.3 |
| D | 2 | 136 | 87319 | 698.41 | 520 | 504 | 124.3 |
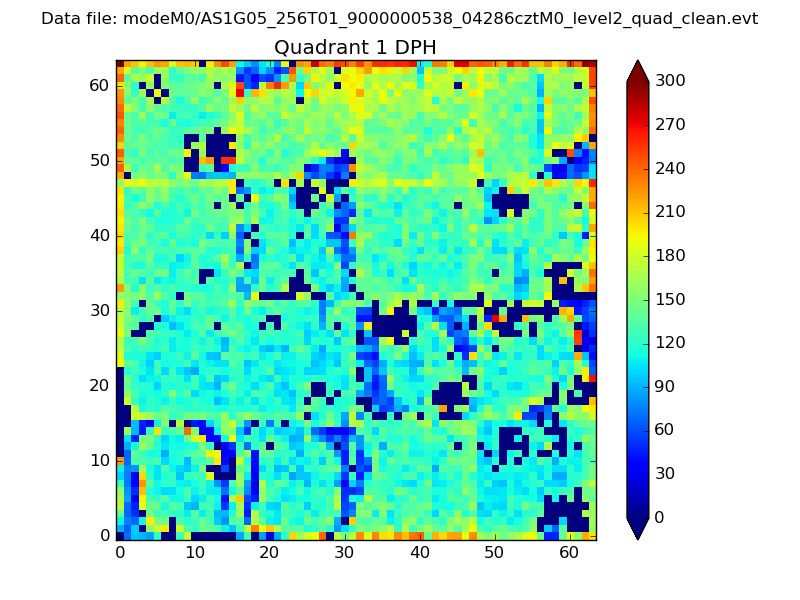
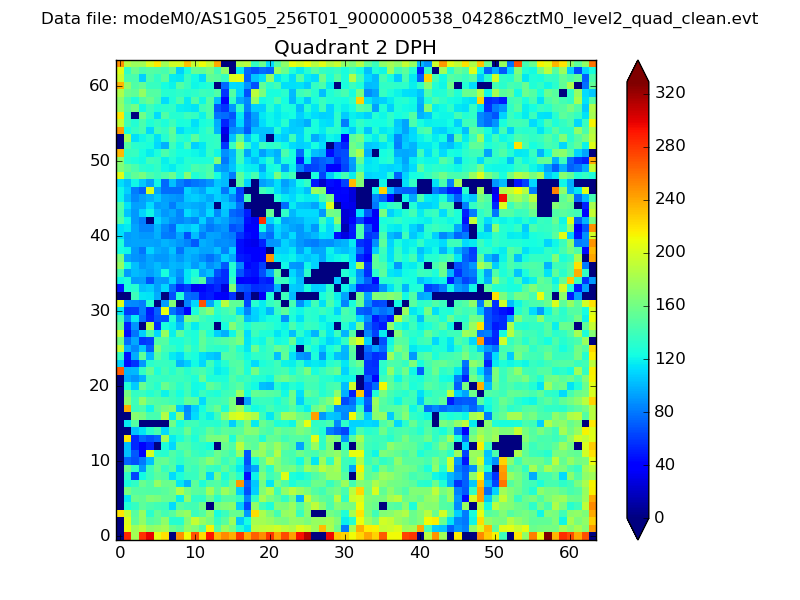
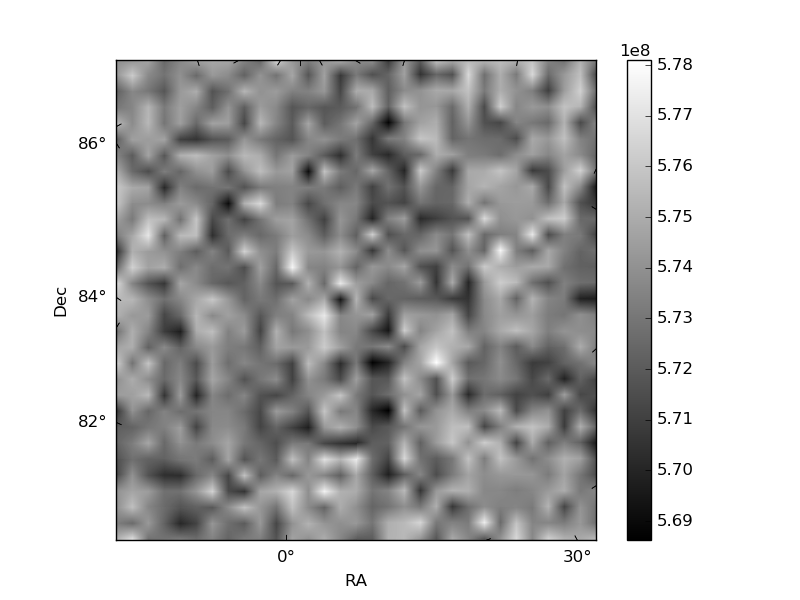
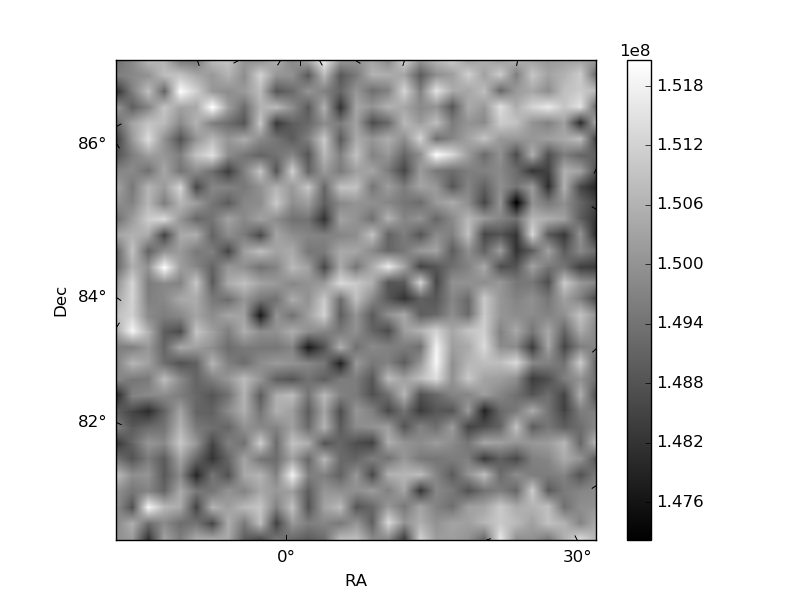
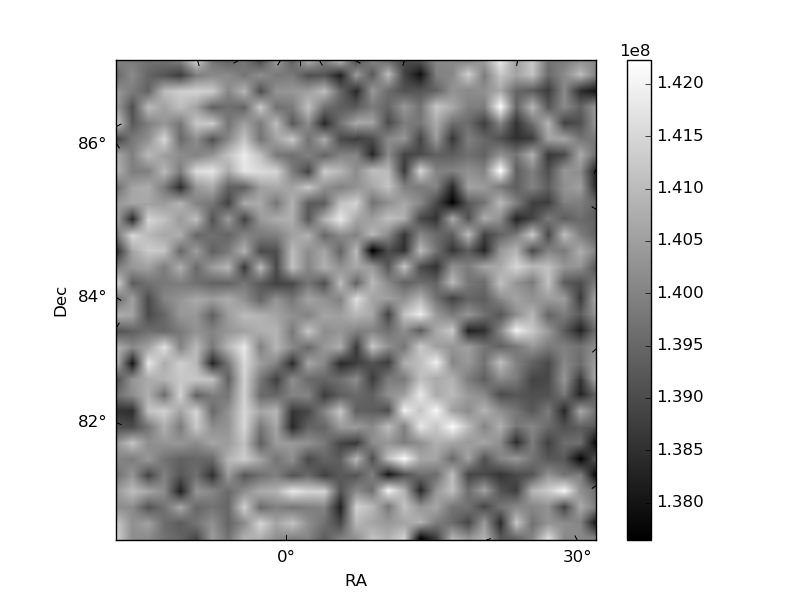
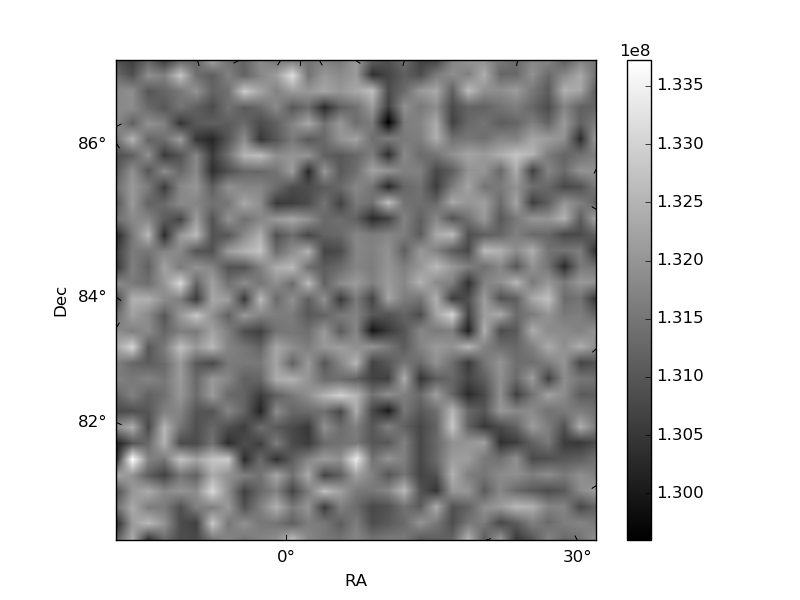
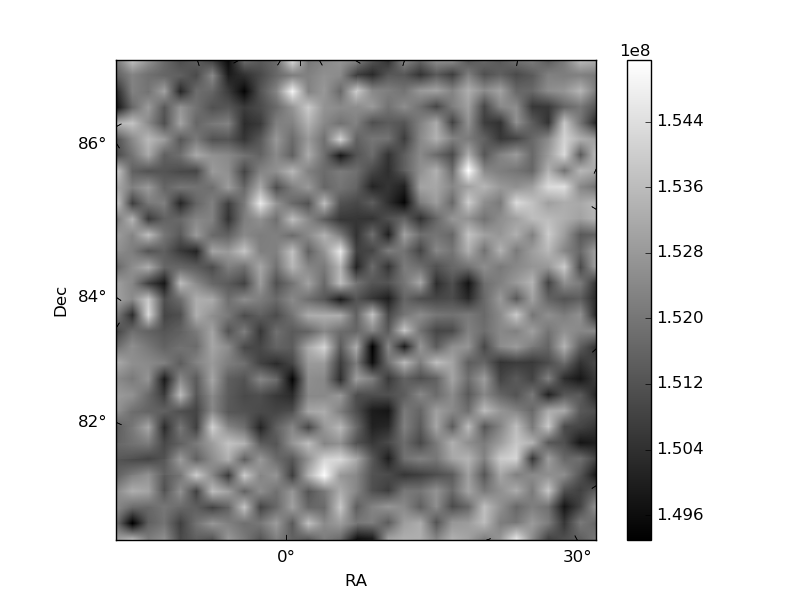
Histogram calculated using DETX and DETY for each event in the final _common_clean file
| Quadrant A | 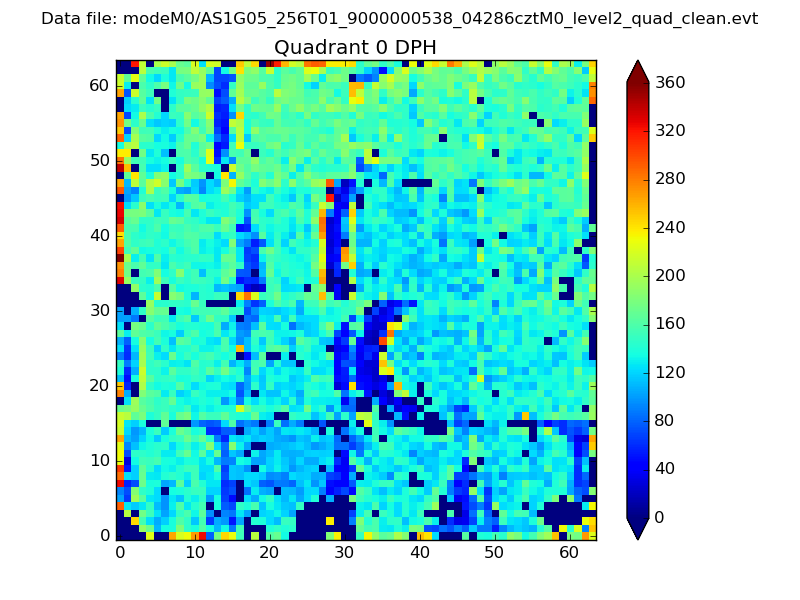 |
 |
Quadrant B |
|---|---|---|---|
| Quadrant D | 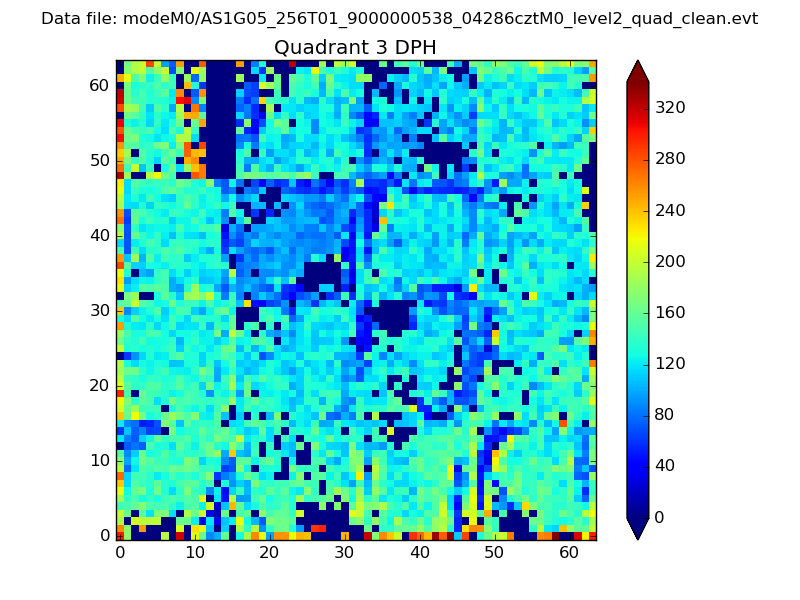 |
 |
Quadrant C |
| Plot type | Count rate plots | Images |
|---|---|---|
| Comparison with Poisson distribution Blue bars denote a histogram of data divided into 1 sec bins. Red curve is a Poisson curve with rate = median count rate of data. |
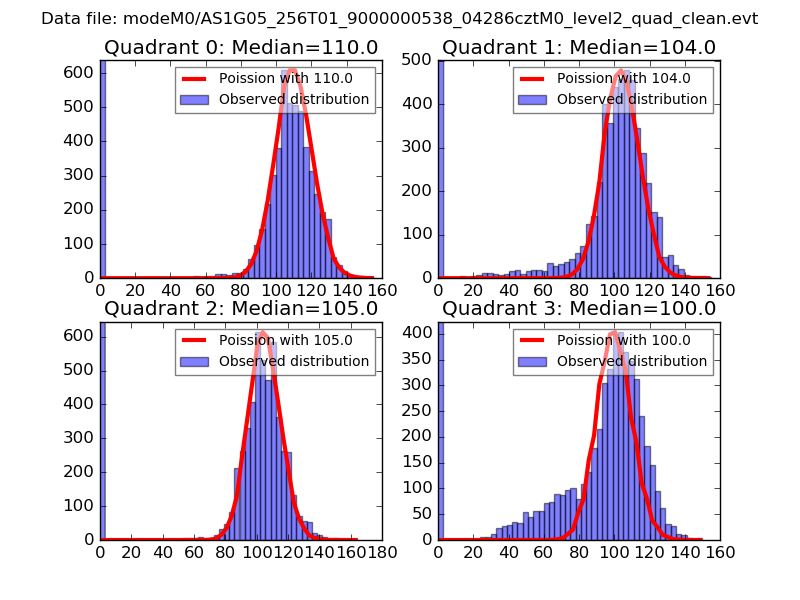 |
 |
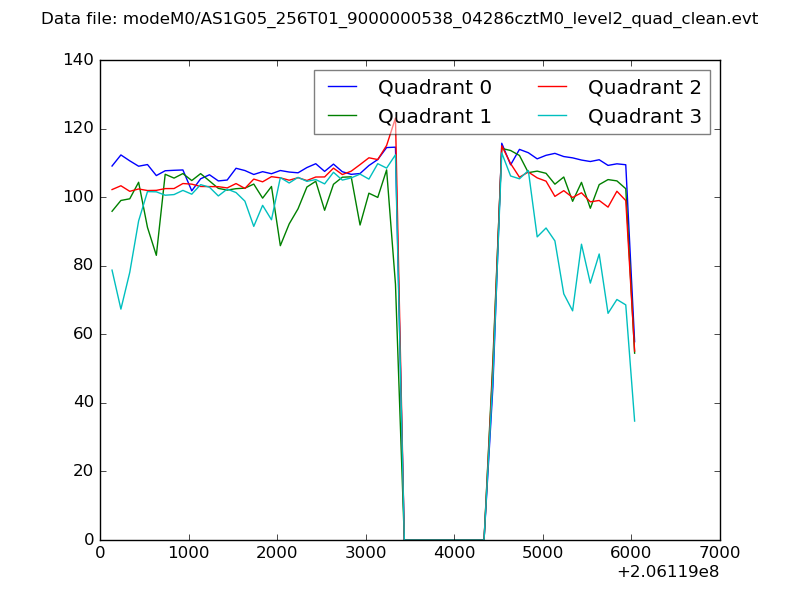
| Quadrant-wise count rates Data is divided into 100 sec bins |
 |
|
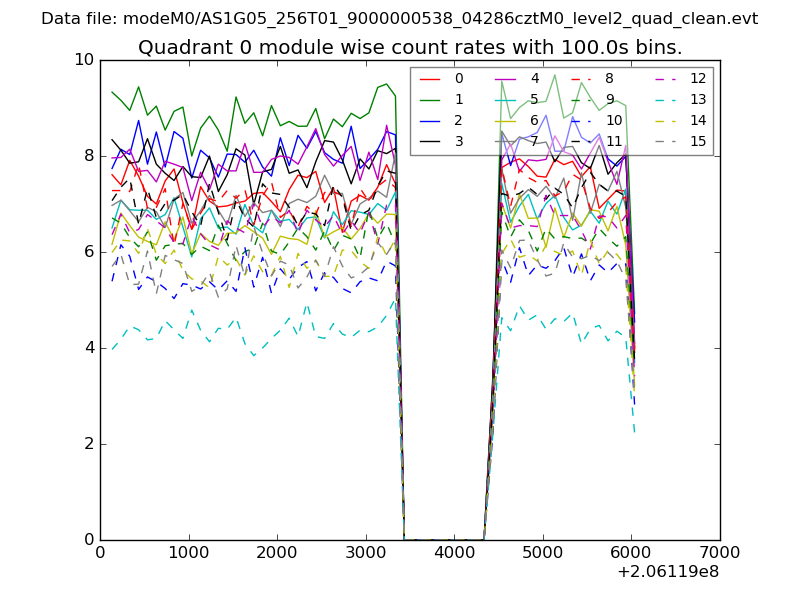
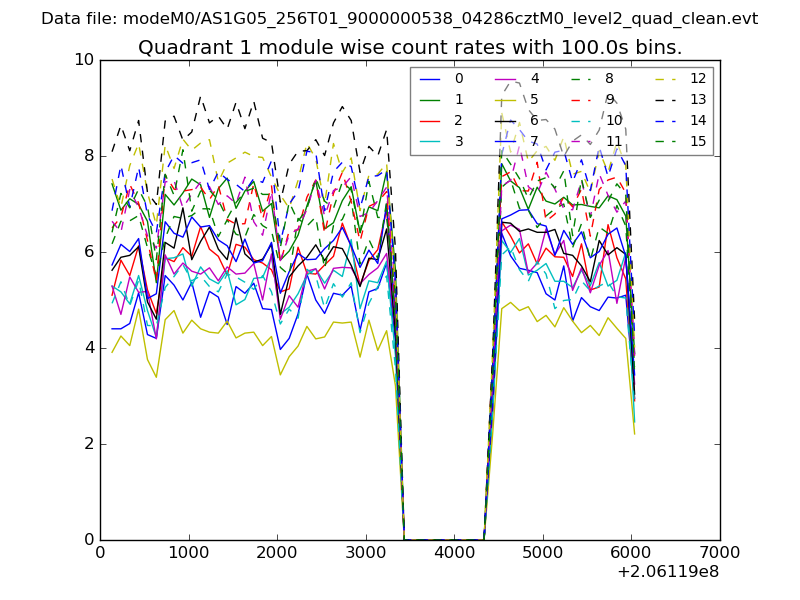
| Module-wise count rates for Quadrant A Data is divided into 100 sec bins |
 |
 |
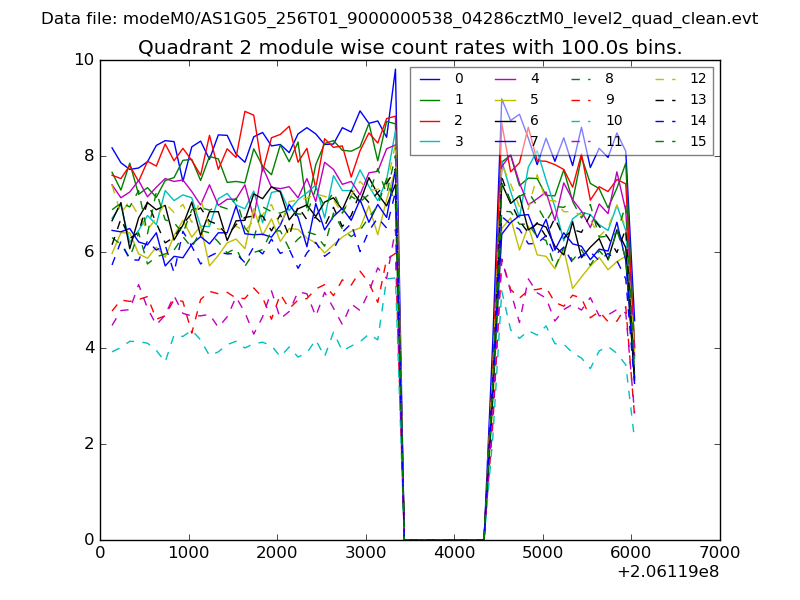
| Module-wise count rates for Quadrant B Data is divided into 100 sec bins |
 |
 |
| Module-wise count rates for Quadrant C Data is divided into 100 sec bins |
 |
 |
| Module-wise count rates for Quadrant D Data is divided into 100 sec bins |
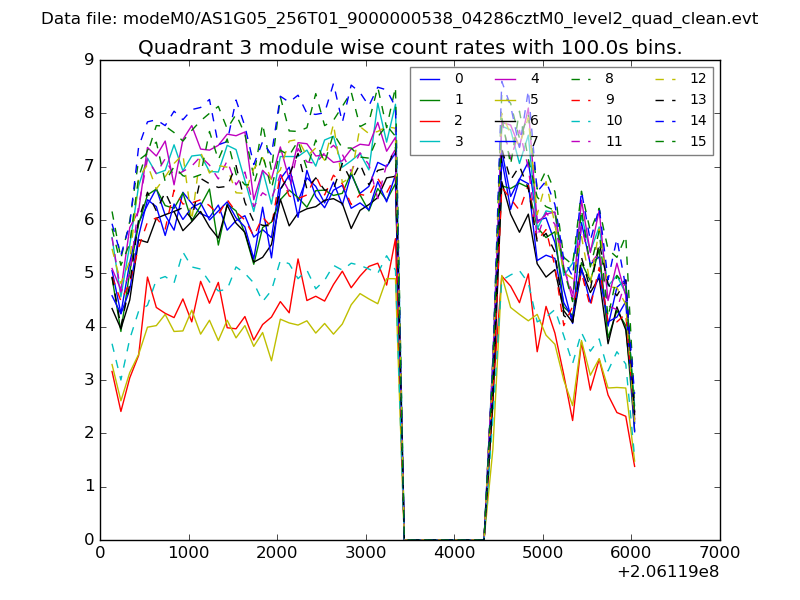 |
 |
| Parameter | Plot |
|---|---|
| CZT HV Monitor | 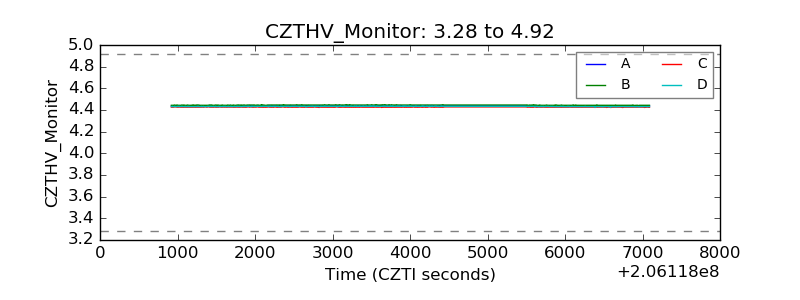 |
| D_VDD | 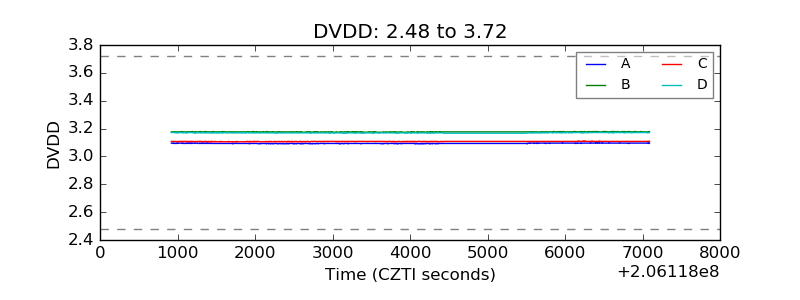 |
| Temperature 1 | 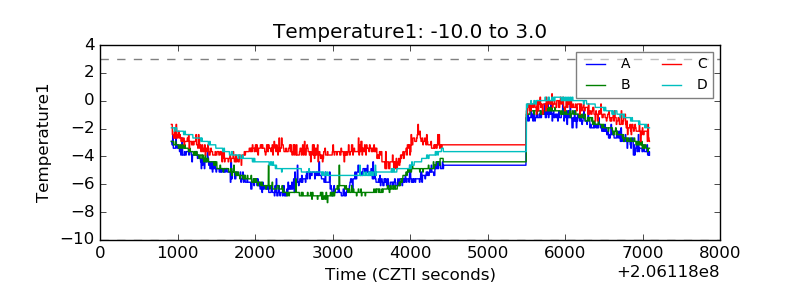 |
| Veto HV Monitor | 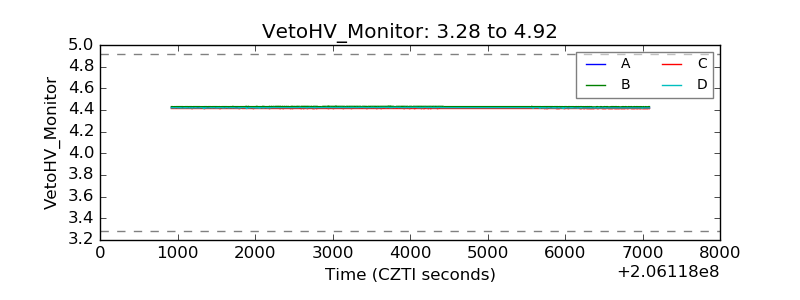 |
| Veto LLD | 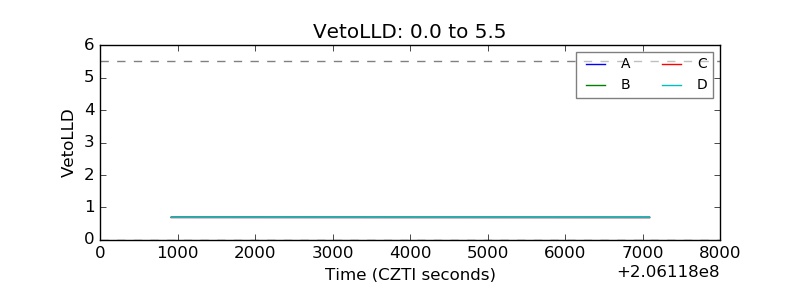 |
| Alpha Counter | 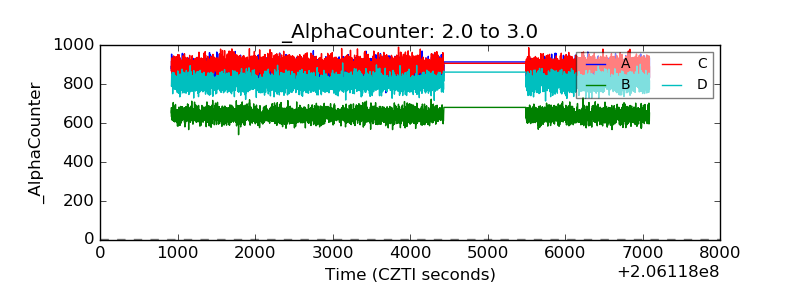 |
| _CPM_Rate | 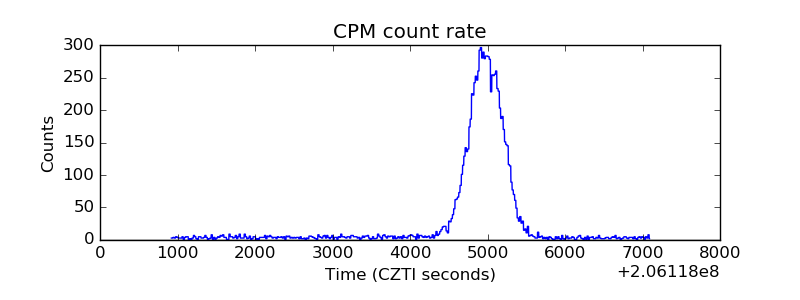 |
| CZT Counter | 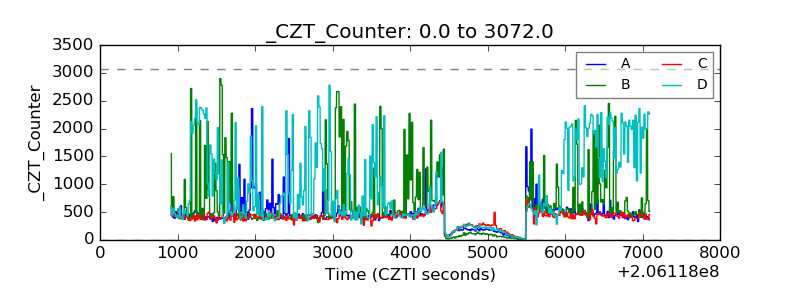 |
| +2.5 Volts monitor |  |
| +5 Volts monitor |  |
| _ROLL_ROT | 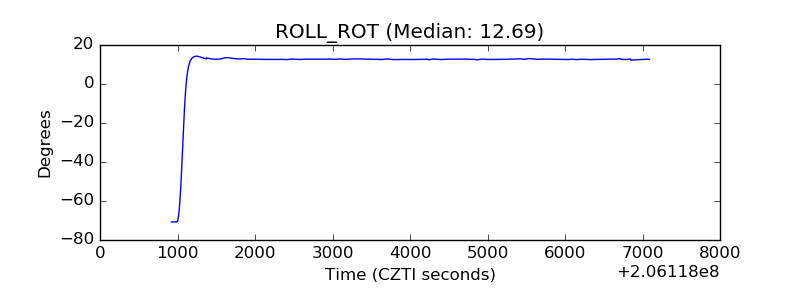 |
| _Roll_DEC | 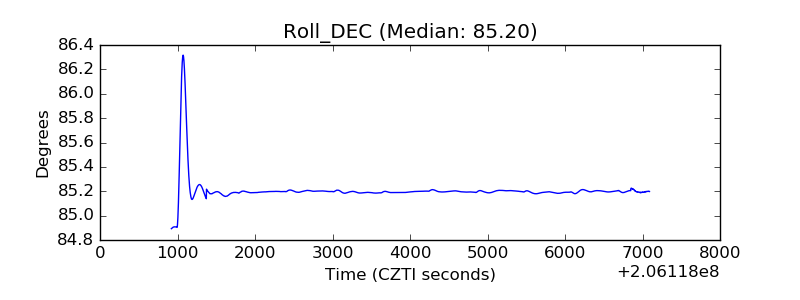 |
| _Roll_RA | 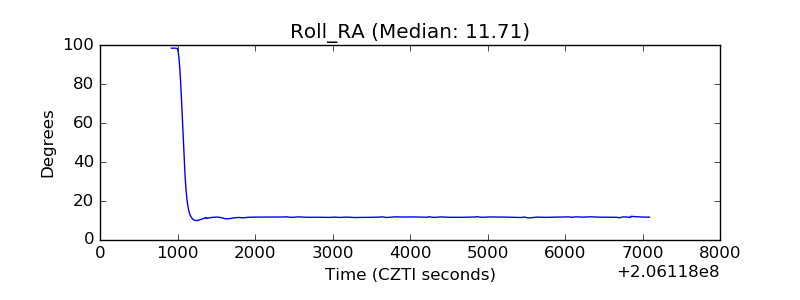 |
| Veto Counter | 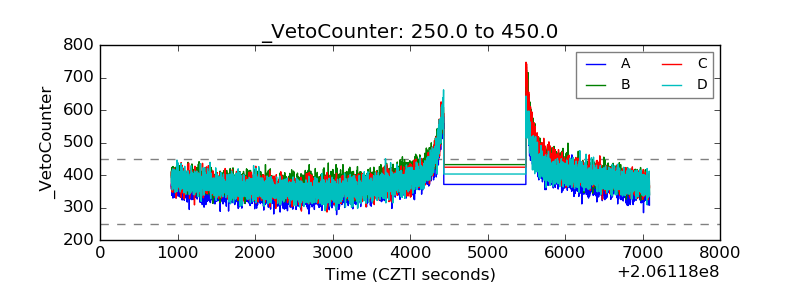 |