| Param | Original file | Final file |
|---|---|---|
| Filename | modeM0/AS1G05_256T01_9000000538_04287cztM0_level2.evt | modeM0/AS1G05_256T01_9000000538_04287cztM0_level2_quad_clean.evt |
| Size (bytes) | 565,315,200 | 101,831,040 |
| Size | 539.1 MB | 97.1 MB |
| Events in quadrant A | 3,121,254 | 695,151 |
| Events in quadrant B | 3,758,125 | 670,304 |
| Events in quadrant C | 2,764,866 | 666,814 |
| Events in quadrant D | 7,032,389 | 594,849 |
| Mode SS | |||
|---|---|---|---|
| Quadrant | BADHDUFLAG | Total packets | Discarded packets |
| A | 0 | 132 | 0 |
| B | 0 | 132 | 0 |
| C | 0 | 132 | 0 |
| D | 0 | 132 | 0 |
| Mode M0 | |||
|---|---|---|---|
| Quadrant | BADHDUFLAG | Total packets | Discarded packets |
| A | 0 | 13825 | 2 |
| B | 0 | 15708 | 1 |
| C | 0 | 13251 | 1 |
| D | 0 | 25636 | 1 |
| Mode M9 | |||
|---|---|---|---|
| Quadrant | BADHDUFLAG | Total packets | Discarded packets |
| A | 0 | 8 | 0 |
| B | 0 | 8 | 0 |
| C | 0 | 8 | 0 |
| D | 0 | 8 | 0 |
| Quadrant | Total seconds | Saturated seconds | Saturation percentage |
|---|---|---|---|
| A | 6542 | 53 | 0.810150% |
| B | 6542 | 129 | 1.971874% |
| C | 6542 | 23 | 0.351574% |
| D | 6542 | 1665 | 25.450932% |
Noise dominated data is calculated using 1-second bins in cleaned event files. If a bin has >2000 counts, and if more than 50% of those come from <1% of pixels, then it is considered to be noise-dominated and hence unusable.
| Quadrant | # 1 sec bins | Bins with >0 counts | Bins with >2000 counts | High rate bins dominated by noise | Noise dominated (total time) | Noise dominated (detector-on time) | Marked lightcurve |
|---|---|---|---|---|---|---|---|
| A | 7302 | 6543 | 22 | 22 | 0.30% | 0.34% | 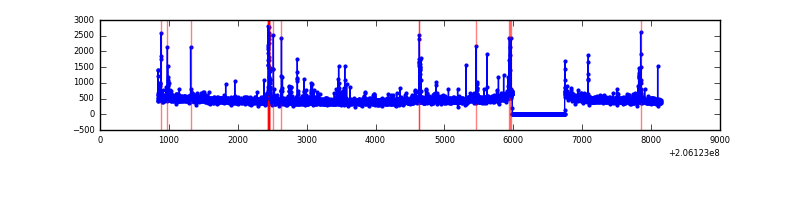 |
| B | 7302 | 6543 | 100 | 100 | 1.37% | 1.53% | 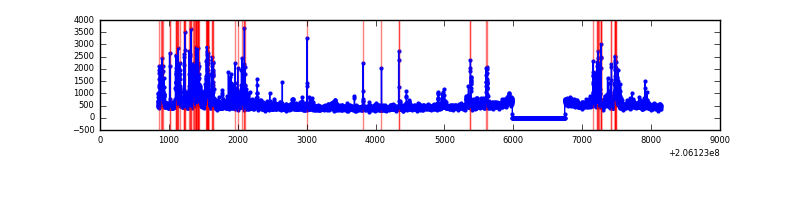 |
| C | 7302 | 6543 | 3 | 3 | 0.04% | 0.05% | 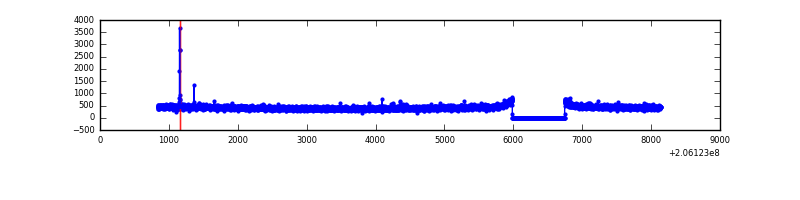 |
| D | 7302 | 6543 | 1073 | 1073 | 14.69% | 16.40% | 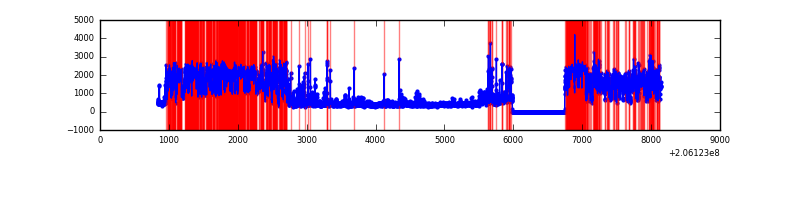 |
Top three noisy pixels from each quadrant. If the there are fewer than three noisy pixels in the level2.evt file, extra rows are filled as -1
| Pixel properties | Quadrant properties | ||||||
|---|---|---|---|---|---|---|---|
| Quadrant | DetID | PixID | Counts | Sigma | Mean | Median | Sigma |
| A | 8 | 15 | 114053 | 767.39 | 726 | 710 | 147.7 |
| A | 15 | 234 | 89429 | 600.68 | 726 | 710 | 147.7 |
| A | 0 | 50 | 85804 | 576.13 | 726 | 710 | 147.7 |
| B | 14 | 167 | 710552 | 5117.34 | 725 | 708 | 138.7 |
| B | 10 | 16 | 104896 | 751.1 | 725 | 708 | 138.7 |
| B | 5 | 184 | 36643 | 259.06 | 725 | 708 | 138.7 |
| C | 15 | 224 | 13227 | 77.64 | 701 | 704 | 161.3 |
| C | 10 | 65 | 10461 | 60.49 | 701 | 704 | 161.3 |
| C | 13 | 61 | 5830 | 31.78 | 701 | 704 | 161.3 |
| D | 2 | 232 | 4030227 | 25880.43 | 642 | 623 | 155.7 |
| D | 2 | 136 | 176339 | 1128.55 | 642 | 623 | 155.7 |
| D | 4 | 95 | 143245 | 916.0 | 642 | 623 | 155.7 |
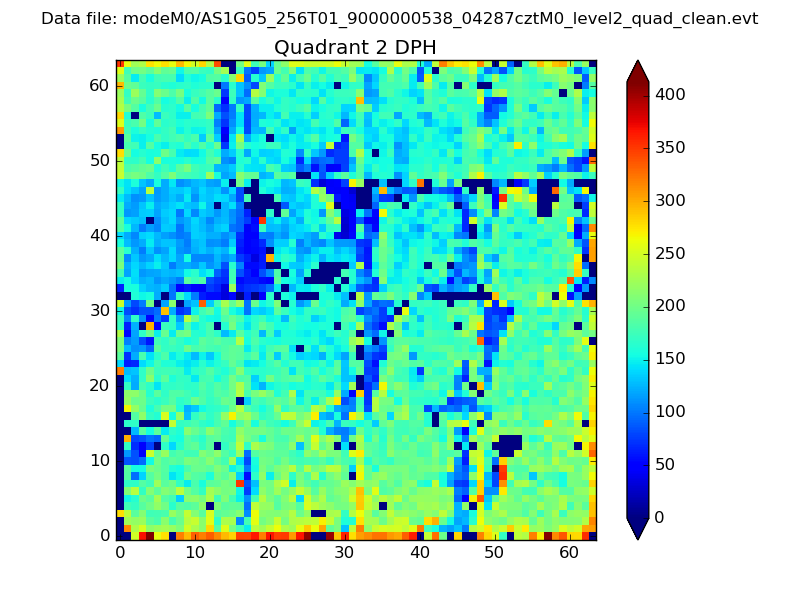
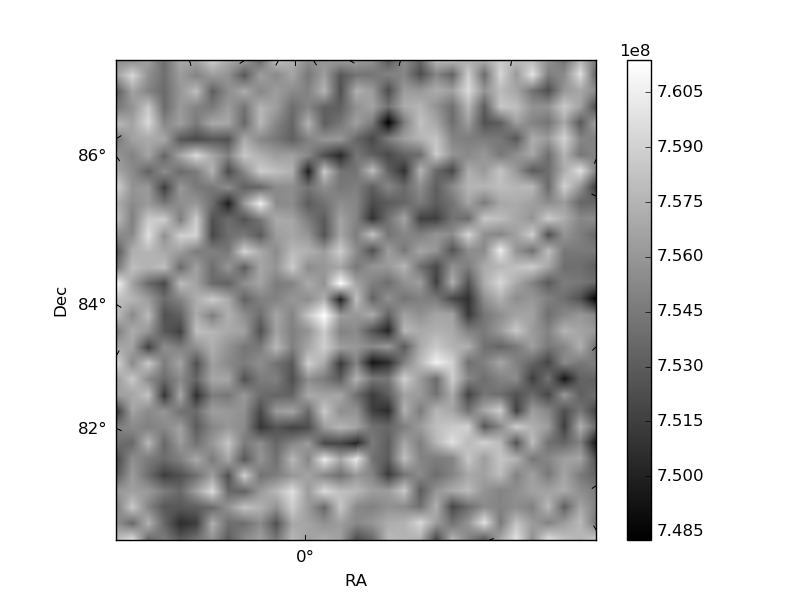
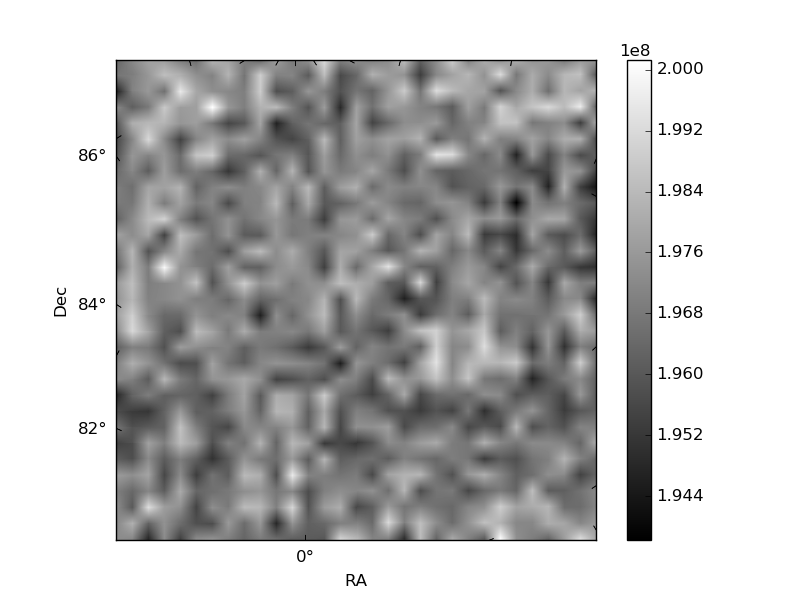
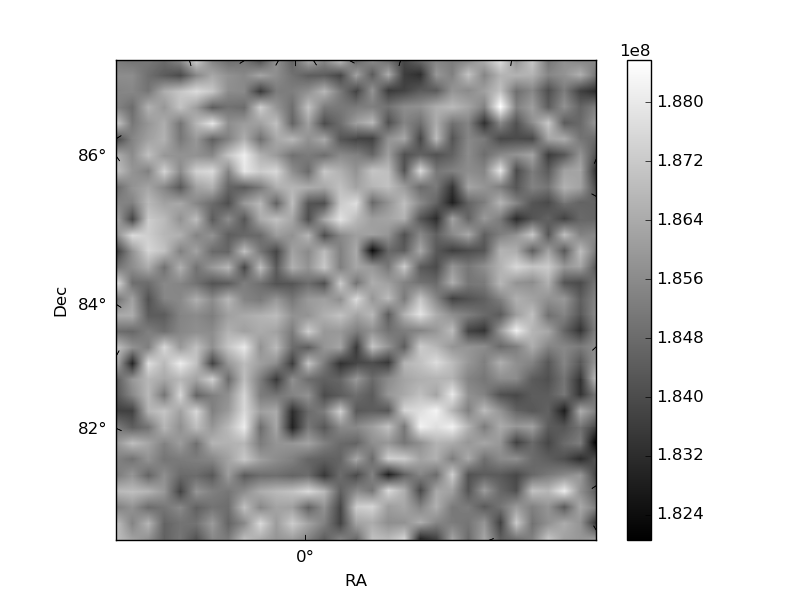
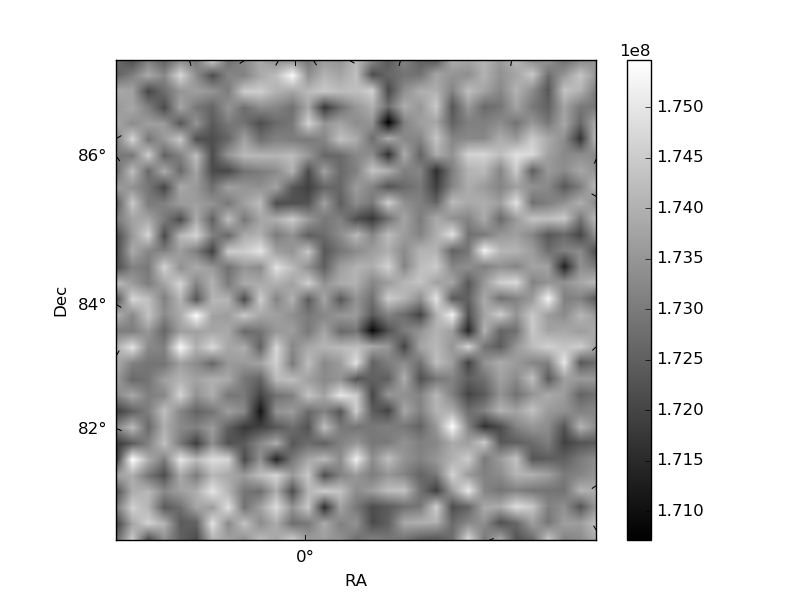
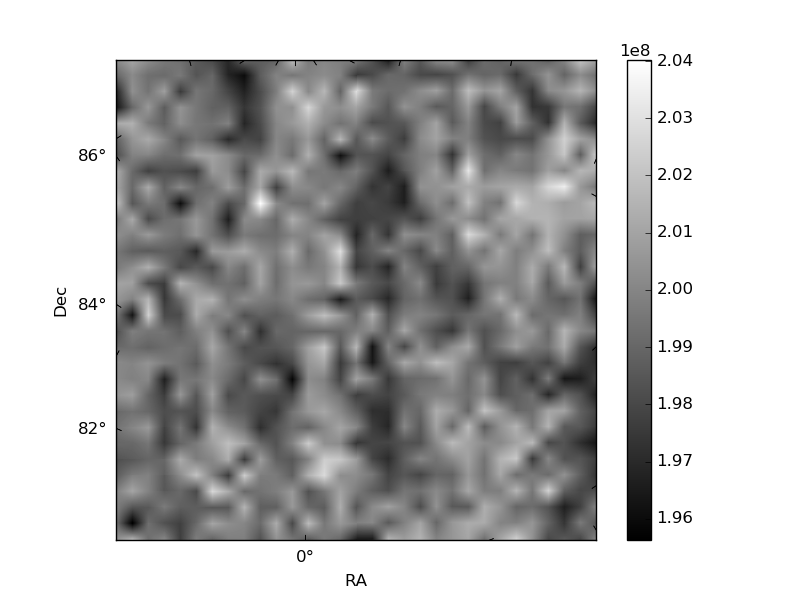
Histogram calculated using DETX and DETY for each event in the final _common_clean file
| Quadrant A | 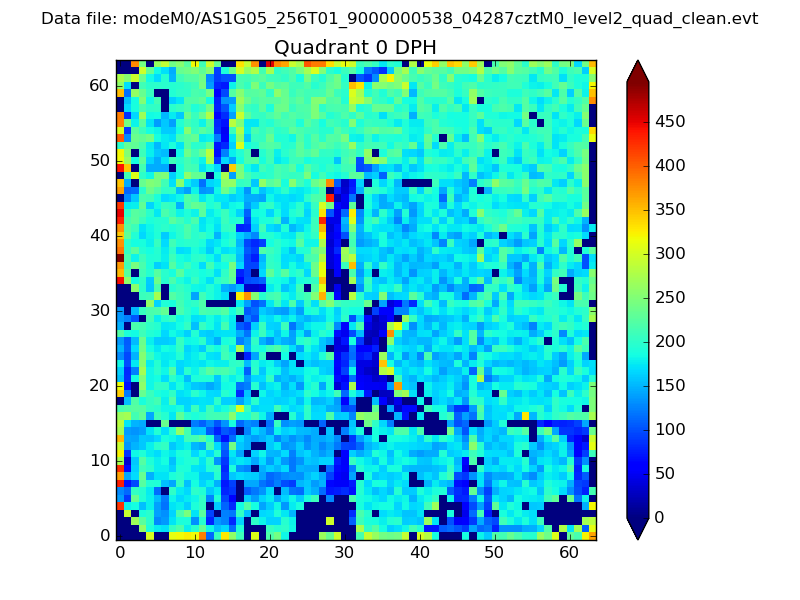 |
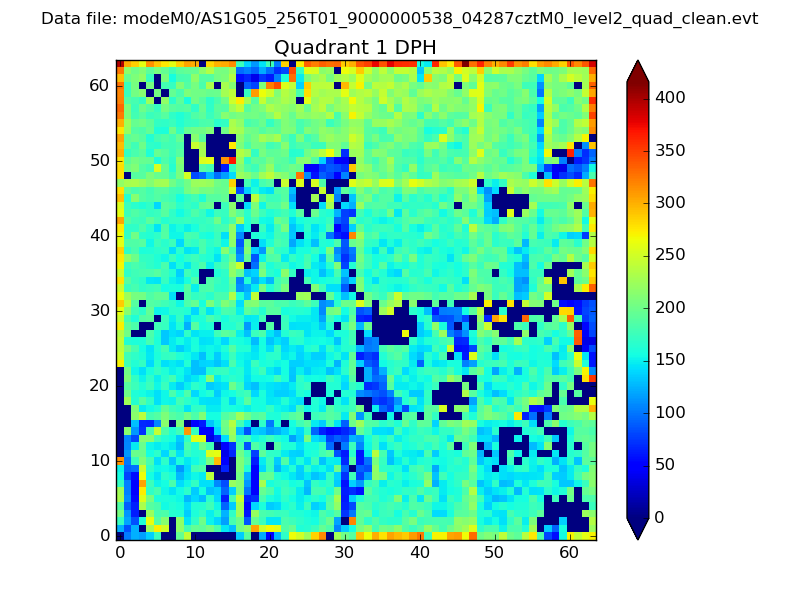 |
Quadrant B |
|---|---|---|---|
| Quadrant D | 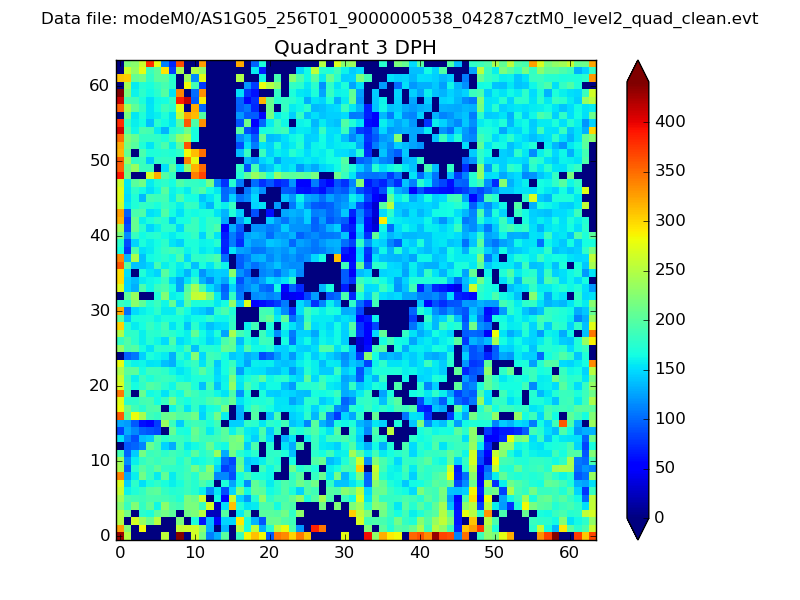 |
 |
Quadrant C |
| Plot type | Count rate plots | Images |
|---|---|---|
| Comparison with Poisson distribution Blue bars denote a histogram of data divided into 1 sec bins. Red curve is a Poisson curve with rate = median count rate of data. |
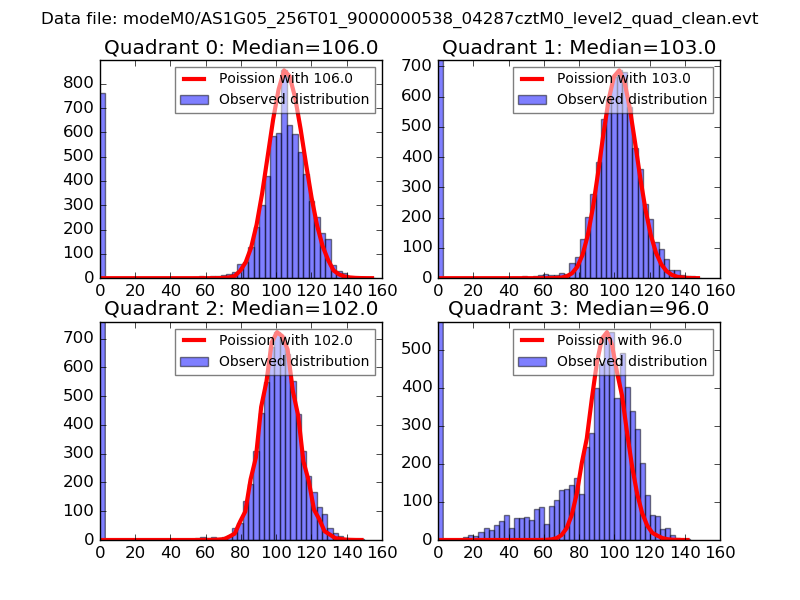 |
 |
| Quadrant-wise count rates Data is divided into 100 sec bins |
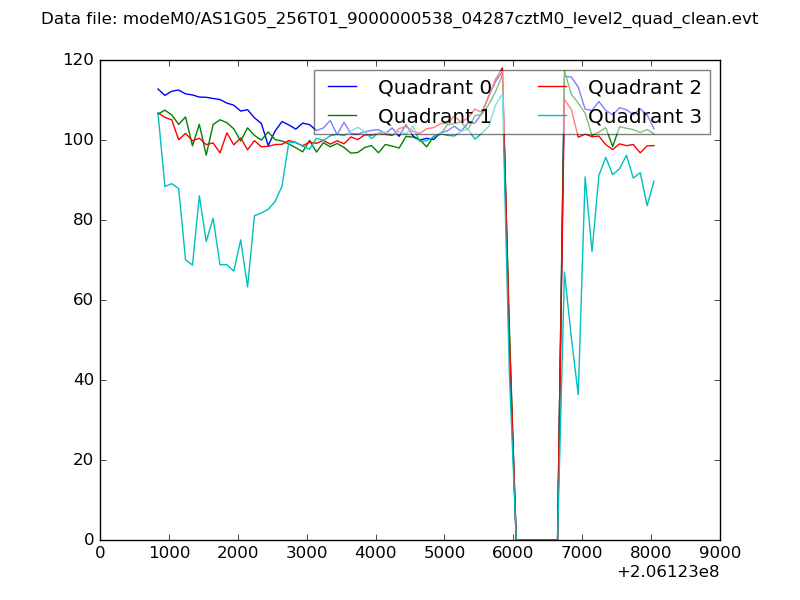 |
|
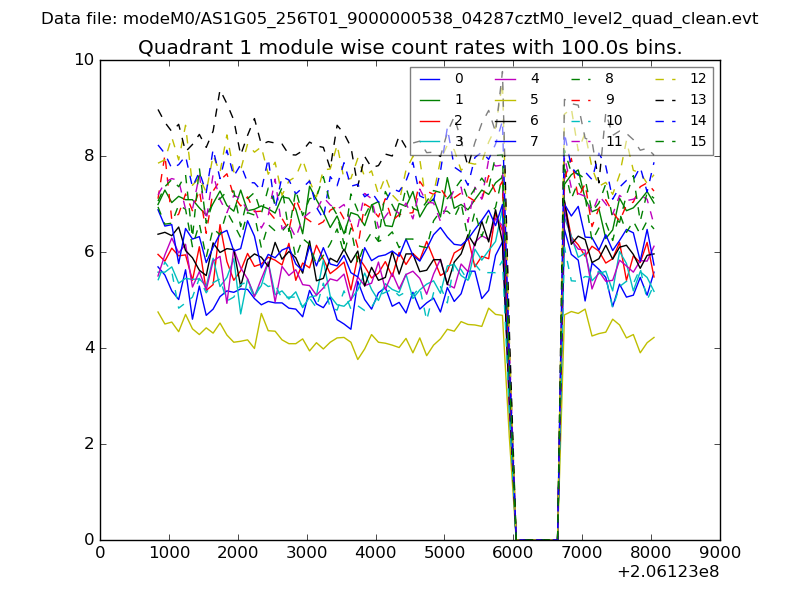
| Module-wise count rates for Quadrant A Data is divided into 100 sec bins |
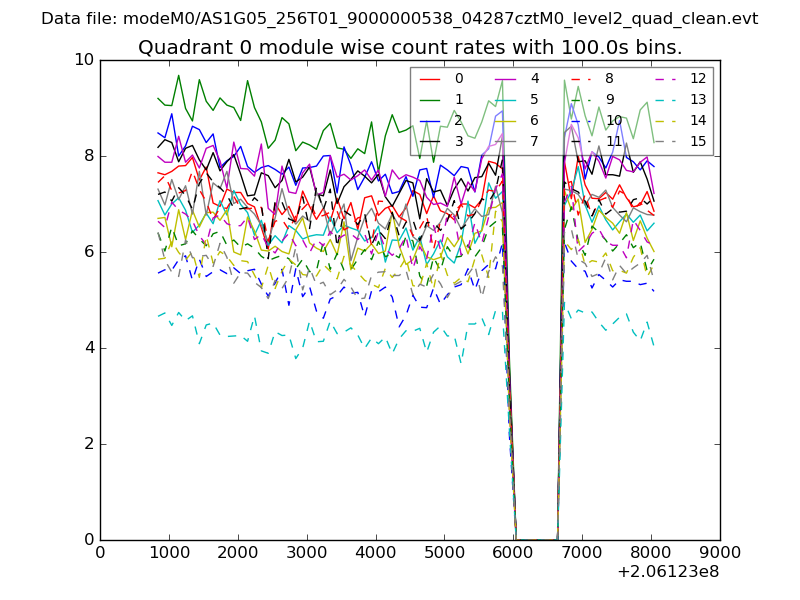 |
 |
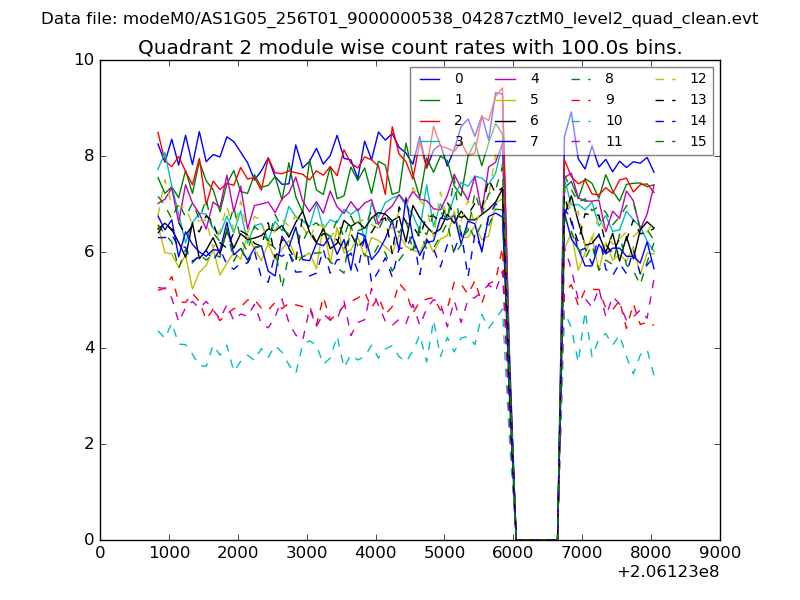
| Module-wise count rates for Quadrant B Data is divided into 100 sec bins |
 |
 |
| Module-wise count rates for Quadrant C Data is divided into 100 sec bins |
 |
 |
| Module-wise count rates for Quadrant D Data is divided into 100 sec bins |
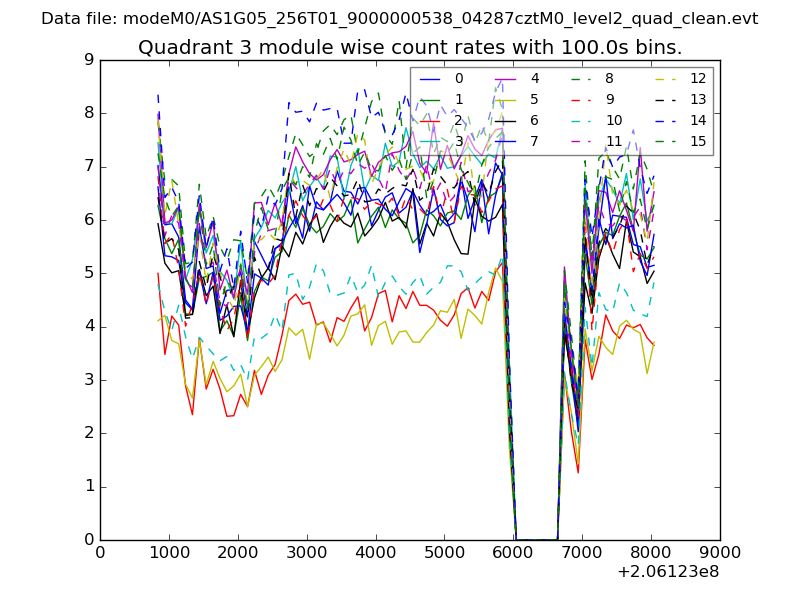 |
 |
| Parameter | Plot |
|---|---|
| CZT HV Monitor | 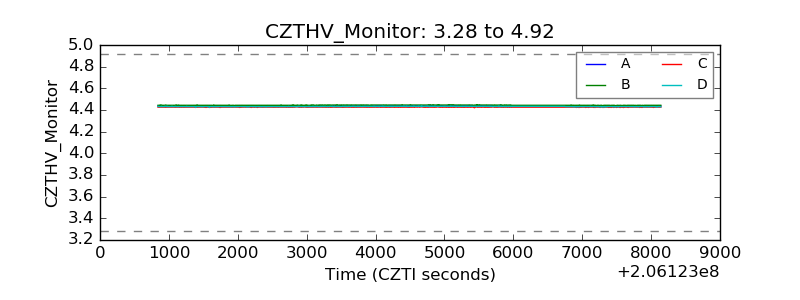 |
| D_VDD | 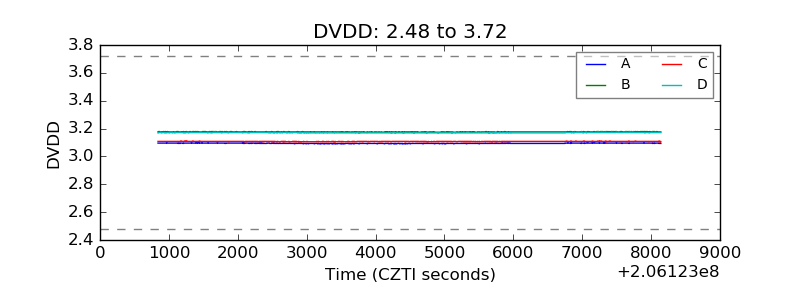 |
| Temperature 1 | 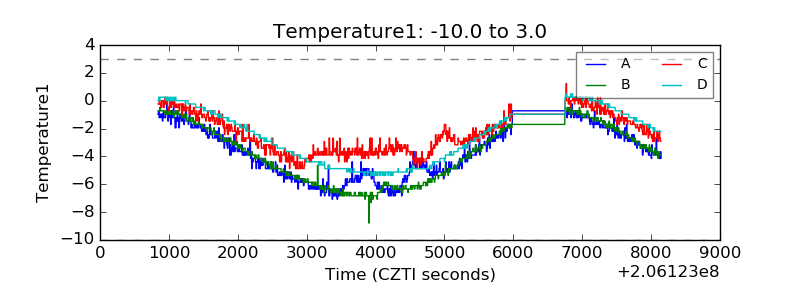 |
| Veto HV Monitor | 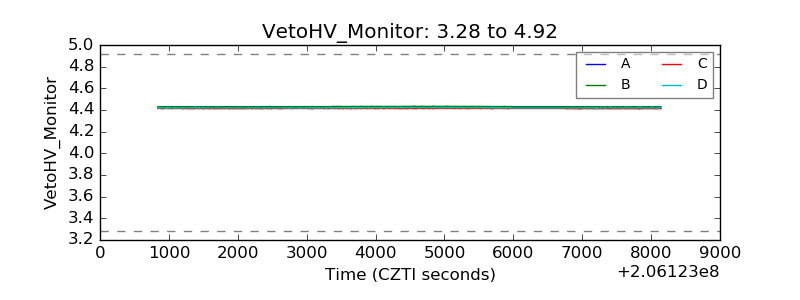 |
| Veto LLD | 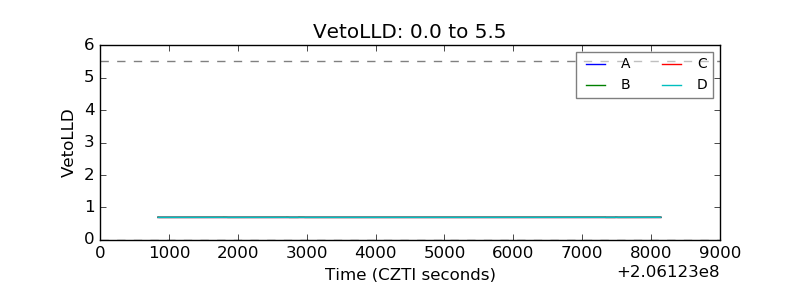 |
| Alpha Counter | 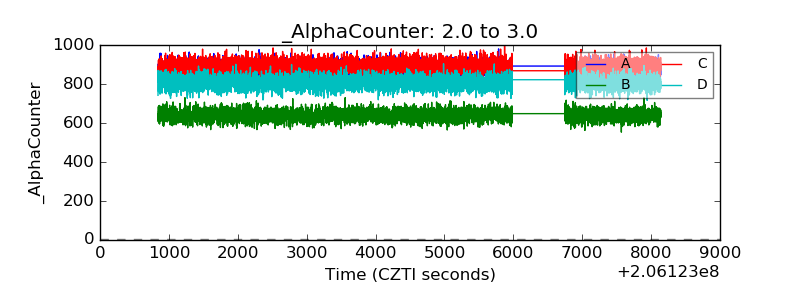 |
| _CPM_Rate | 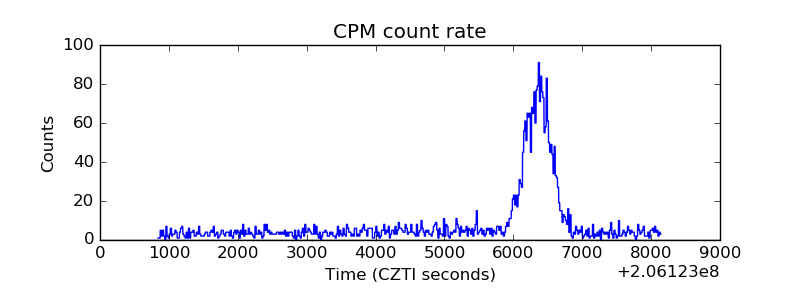 |
| CZT Counter | 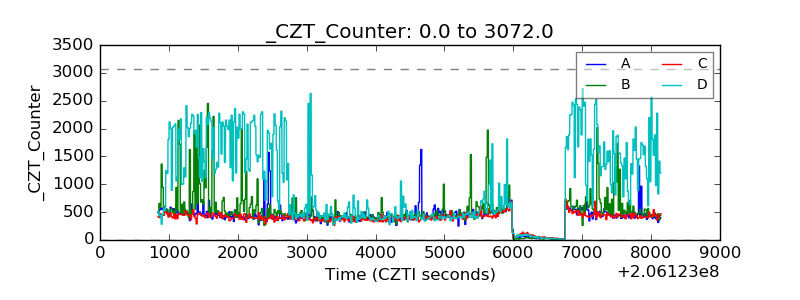 |
| +2.5 Volts monitor |  |
| +5 Volts monitor |  |
| _ROLL_ROT | 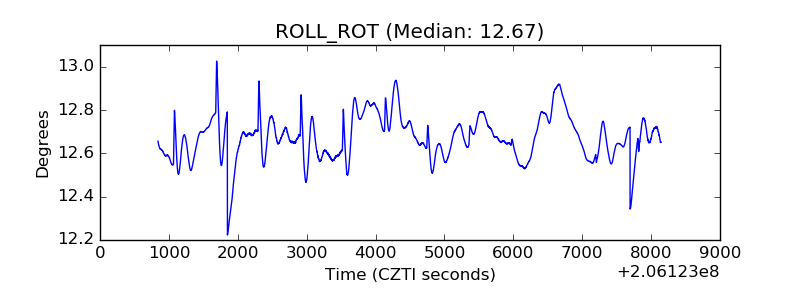 |
| _Roll_DEC | 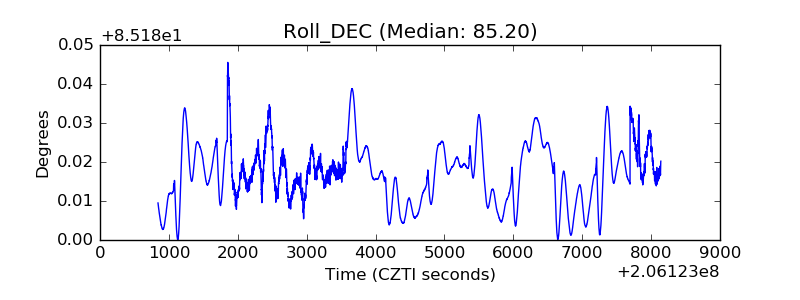 |
| _Roll_RA | 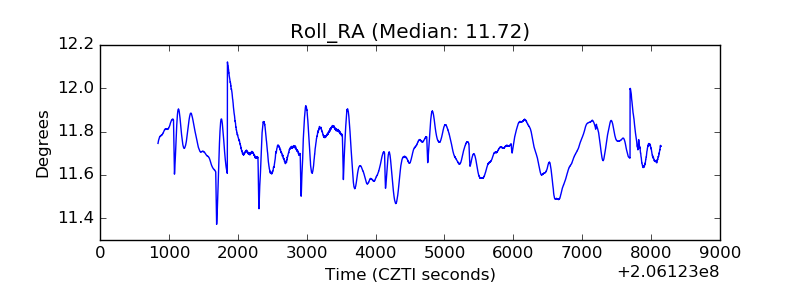 |
| Veto Counter | 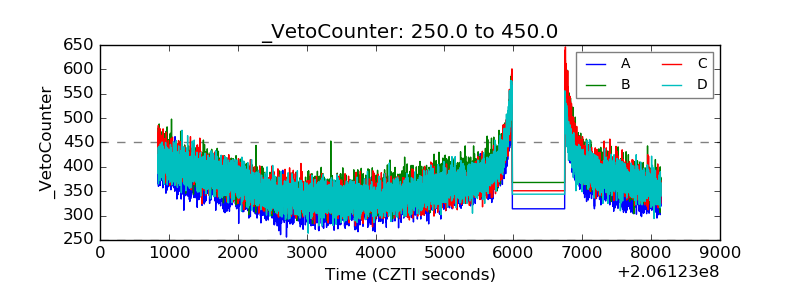 |