| Param | Original file | Final file |
|---|---|---|
| Filename | modeM0/AS1G05_256T01_9000000538_04289cztM0_level2.evt | modeM0/AS1G05_256T01_9000000538_04289cztM0_level2_quad_clean.evt |
| Size (bytes) | 670,855,680 | 117,495,360 |
| Size | 639.8 MB | 112.1 MB |
| Events in quadrant A | 5,220,004 | 772,232 |
| Events in quadrant B | 4,184,173 | 765,272 |
| Events in quadrant C | 4,381,094 | 746,834 |
| Events in quadrant D | 6,013,221 | 740,942 |
| Mode SS | |||
|---|---|---|---|
| Quadrant | BADHDUFLAG | Total packets | Discarded packets |
| A | 0 | 154 | 0 |
| B | 0 | 154 | 0 |
| C | 0 | 154 | 0 |
| D | 0 | 154 | 0 |
| Mode M0 | |||
|---|---|---|---|
| Quadrant | BADHDUFLAG | Total packets | Discarded packets |
| A | 0 | 21000 | 4 |
| B | 0 | 17612 | 1 |
| C | 0 | 18545 | 1 |
| D | 0 | 23345 | 1 |
| Quadrant | Total seconds | Saturated seconds | Saturation percentage |
|---|---|---|---|
| A | 7655 | 477 | 6.231221% |
| B | 7656 | 128 | 1.671891% |
| C | 7656 | 342 | 4.467085% |
| D | 7656 | 467 | 6.099791% |
Noise dominated data is calculated using 1-second bins in cleaned event files. If a bin has >2000 counts, and if more than 50% of those come from <1% of pixels, then it is considered to be noise-dominated and hence unusable.
| Quadrant | # 1 sec bins | Bins with >0 counts | Bins with >2000 counts | High rate bins dominated by noise | Noise dominated (total time) | Noise dominated (detector-on time) | Marked lightcurve |
|---|---|---|---|---|---|---|---|
| A | 7701 | 7657 | 351 | 351 | 4.56% | 4.58% | 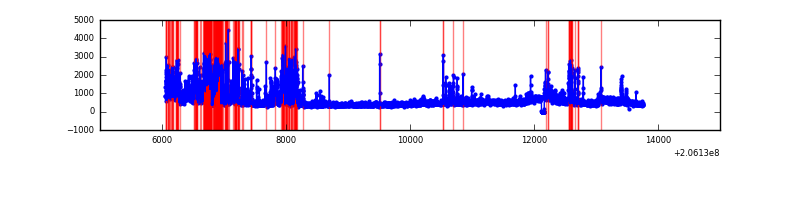 |
| B | 7701 | 7657 | 27 | 27 | 0.35% | 0.35% | 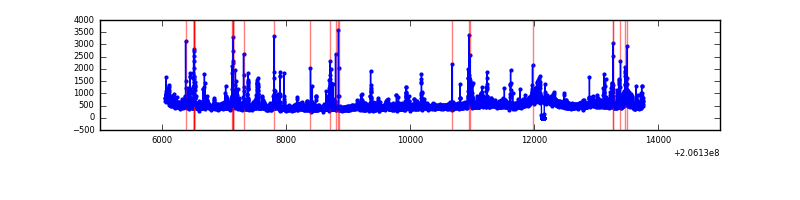 |
| C | 7701 | 7656 | 202 | 202 | 2.62% | 2.64% | 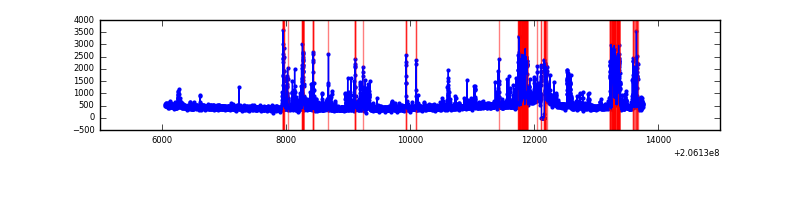 |
| D | 7701 | 7657 | 210 | 210 | 2.73% | 2.74% | 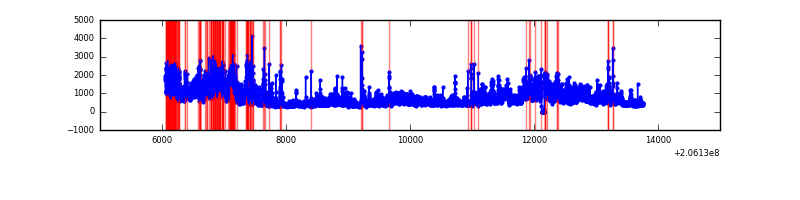 |
Top three noisy pixels from each quadrant. If the there are fewer than three noisy pixels in the level2.evt file, extra rows are filled as -1
| Pixel properties | Quadrant properties | ||||||
|---|---|---|---|---|---|---|---|
| Quadrant | DetID | PixID | Counts | Sigma | Mean | Median | Sigma |
| A | 0 | 199 | 1435129 | 8291.02 | 844 | 824 | 173.0 |
| A | 15 | 234 | 224148 | 1290.93 | 844 | 824 | 173.0 |
| A | 0 | 226 | 148334 | 852.68 | 844 | 824 | 173.0 |
| B | 14 | 167 | 240673 | 1448.51 | 867 | 845 | 165.6 |
| B | 10 | 16 | 207608 | 1248.81 | 867 | 845 | 165.6 |
| B | 0 | 184 | 74764 | 446.46 | 867 | 845 | 165.6 |
| C | 9 | 144 | 1015785 | 5301.52 | 823 | 826 | 191.4 |
| C | 9 | 247 | 122608 | 636.11 | 823 | 826 | 191.4 |
| C | 6 | 80 | 12381 | 60.36 | 823 | 826 | 191.4 |
| D | 2 | 232 | 1939570 | 9756.74 | 826 | 801 | 198.7 |
| D | 13 | 53 | 380628 | 1911.46 | 826 | 801 | 198.7 |
| D | 2 | 136 | 213234 | 1069.05 | 826 | 801 | 198.7 |
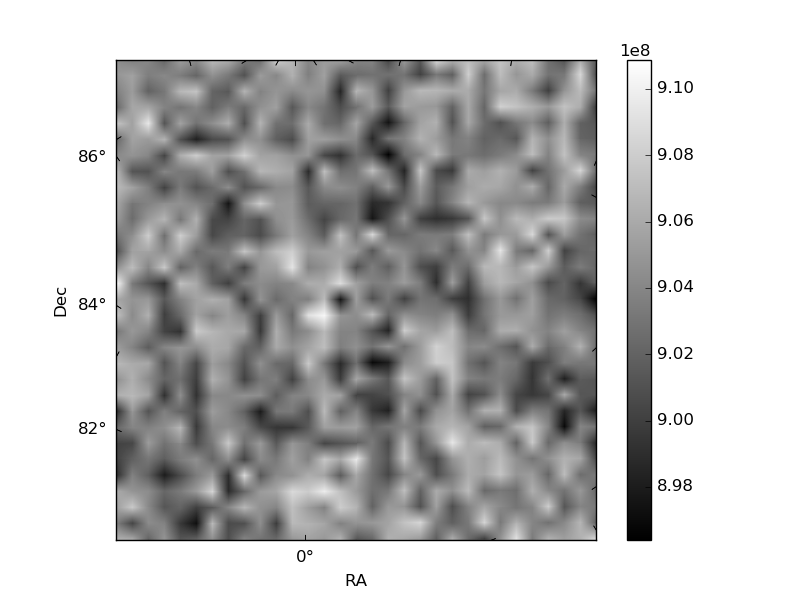
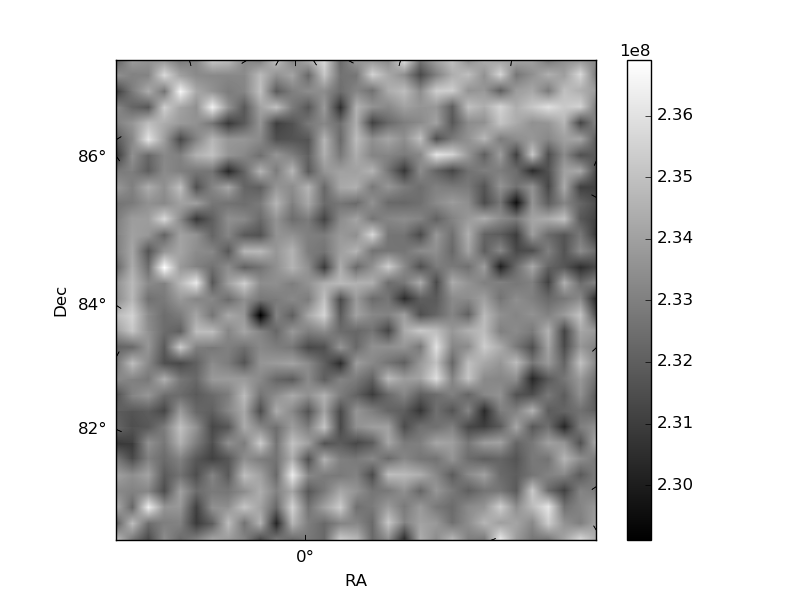
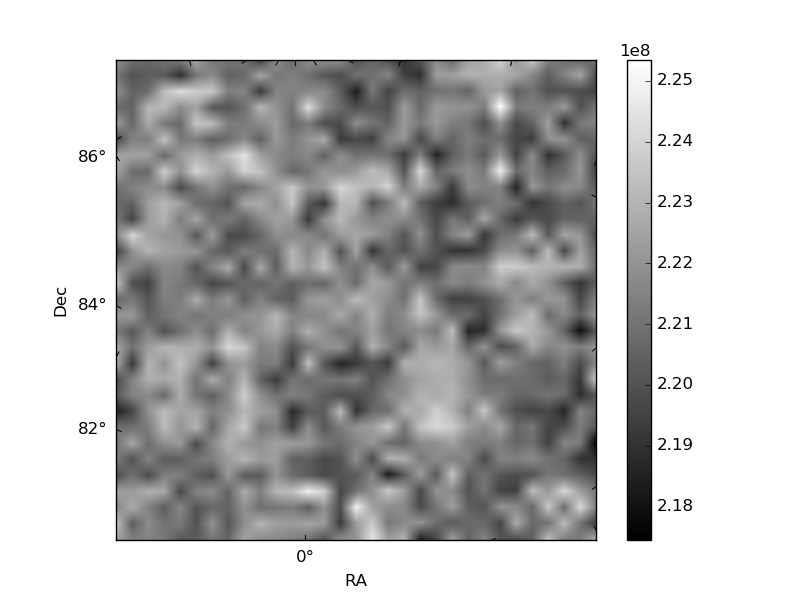
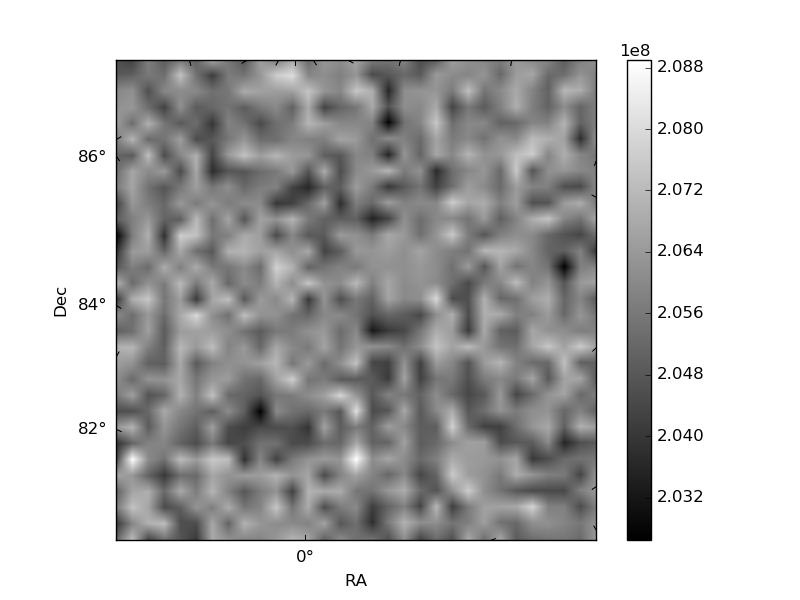
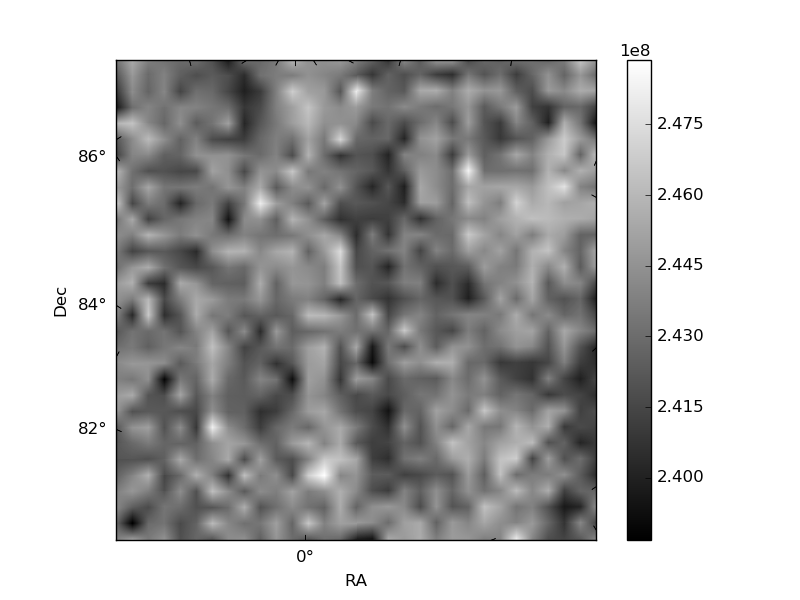
Histogram calculated using DETX and DETY for each event in the final _common_clean file
| Quadrant A | 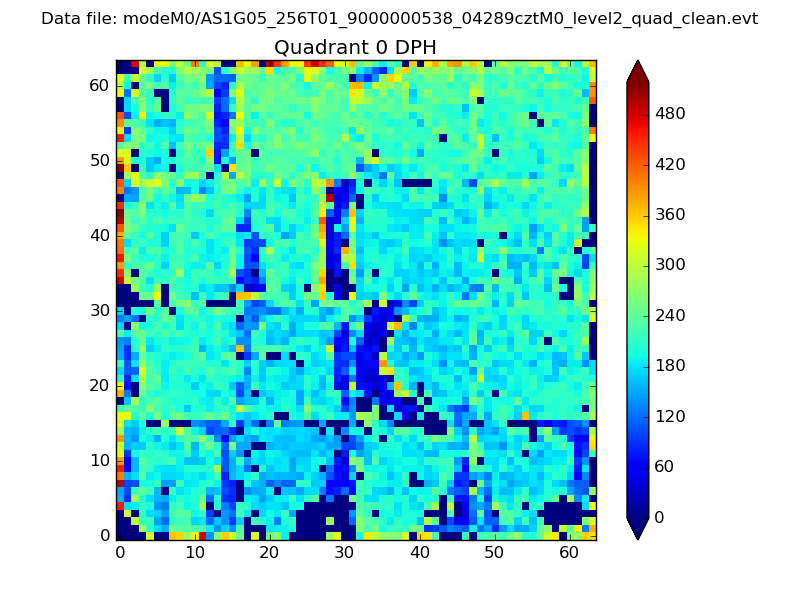 |
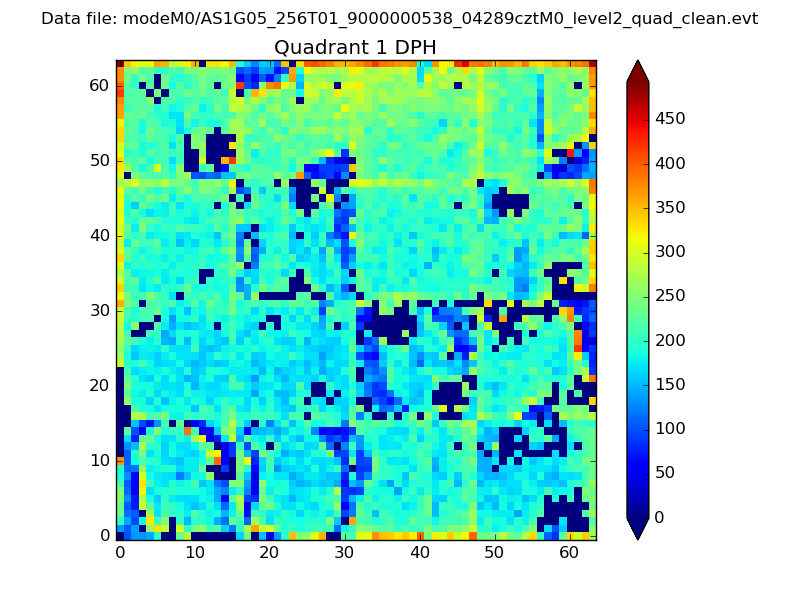 |
Quadrant B |
|---|---|---|---|
| Quadrant D | 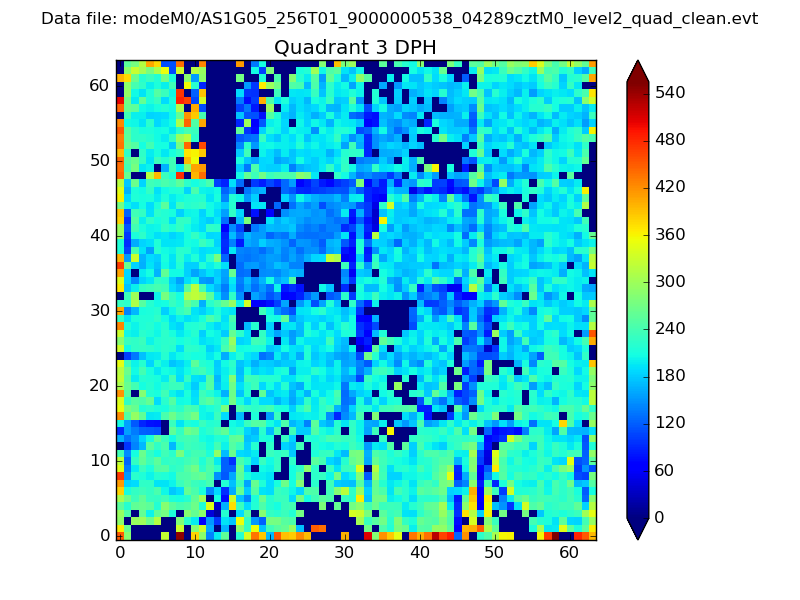 |
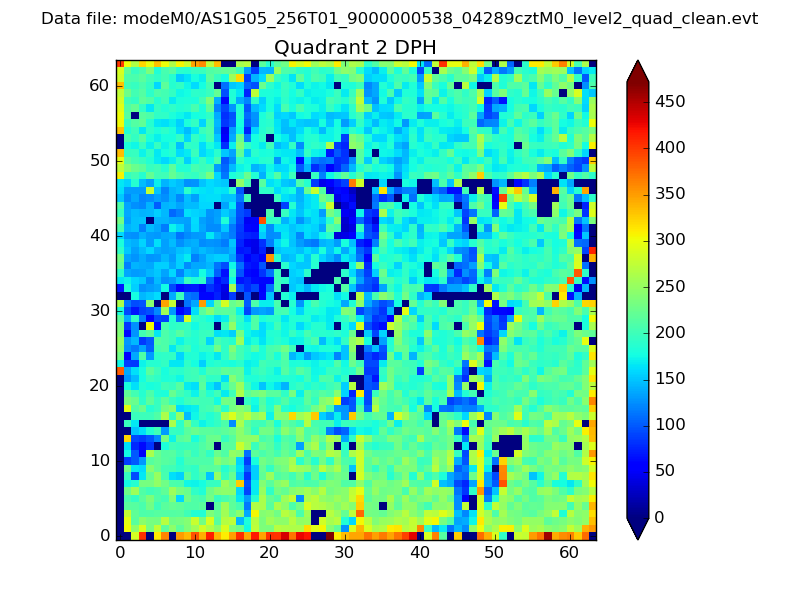 |
Quadrant C |
| Plot type | Count rate plots | Images |
|---|---|---|
| Comparison with Poisson distribution Blue bars denote a histogram of data divided into 1 sec bins. Red curve is a Poisson curve with rate = median count rate of data. |
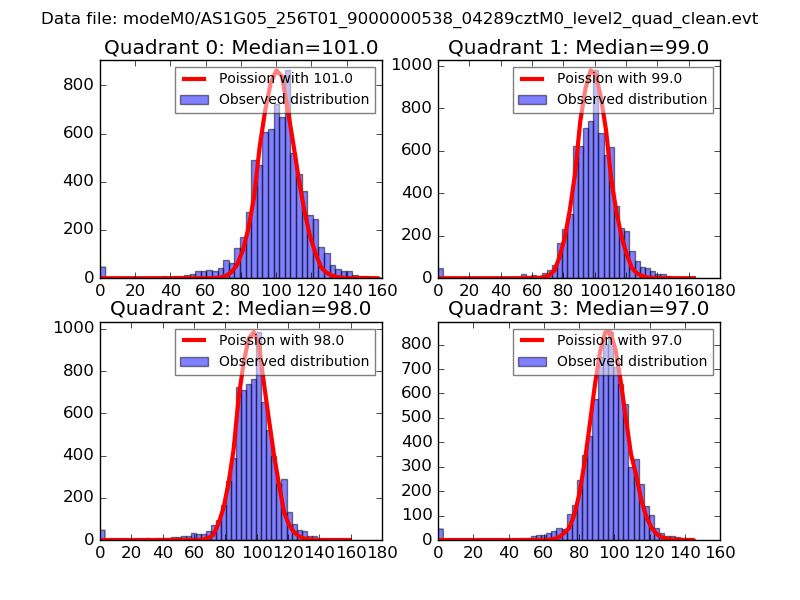 |
 |
| Quadrant-wise count rates Data is divided into 100 sec bins |
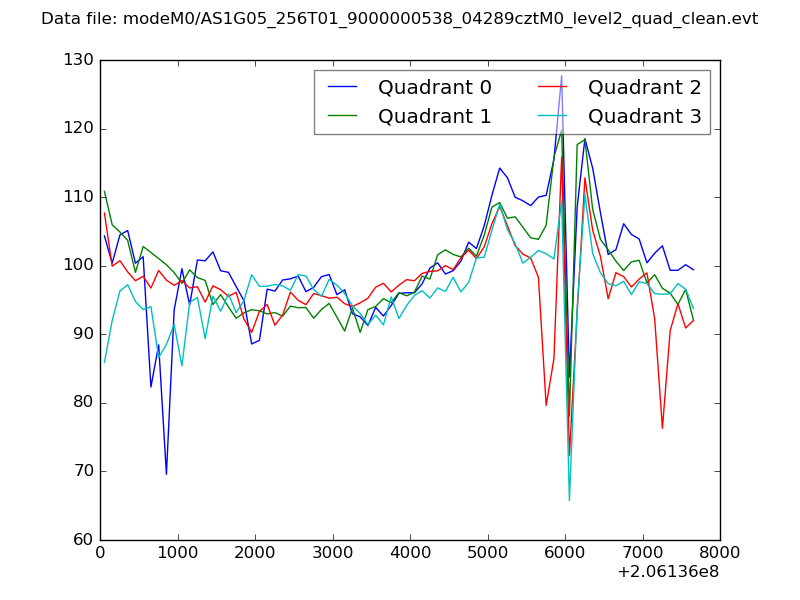 |
|
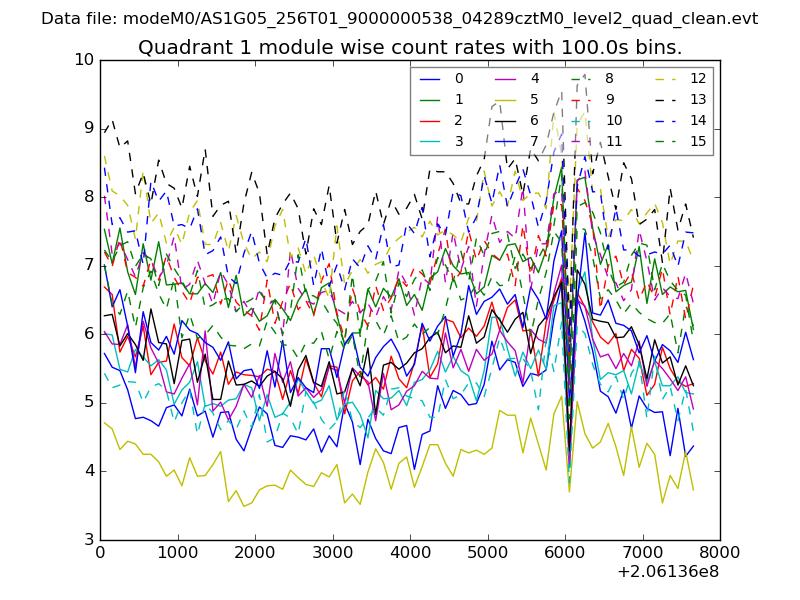
| Module-wise count rates for Quadrant A Data is divided into 100 sec bins |
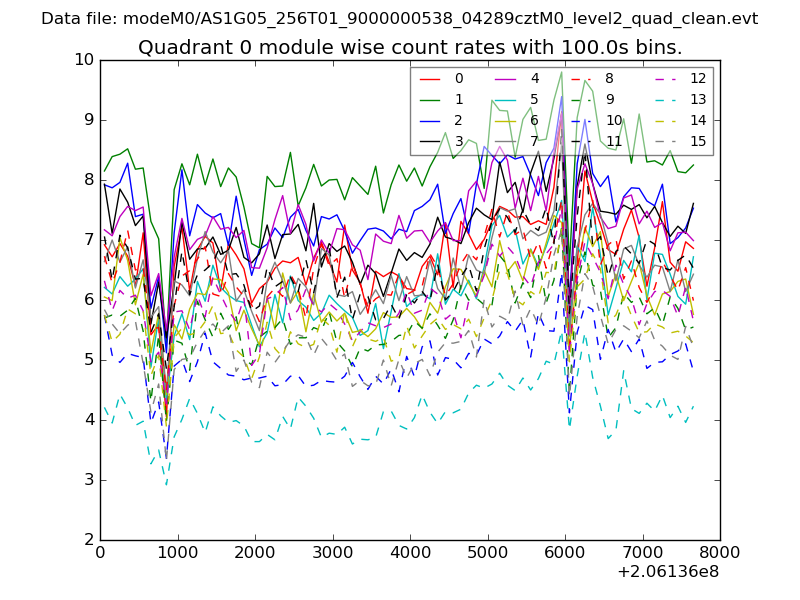 |
 |
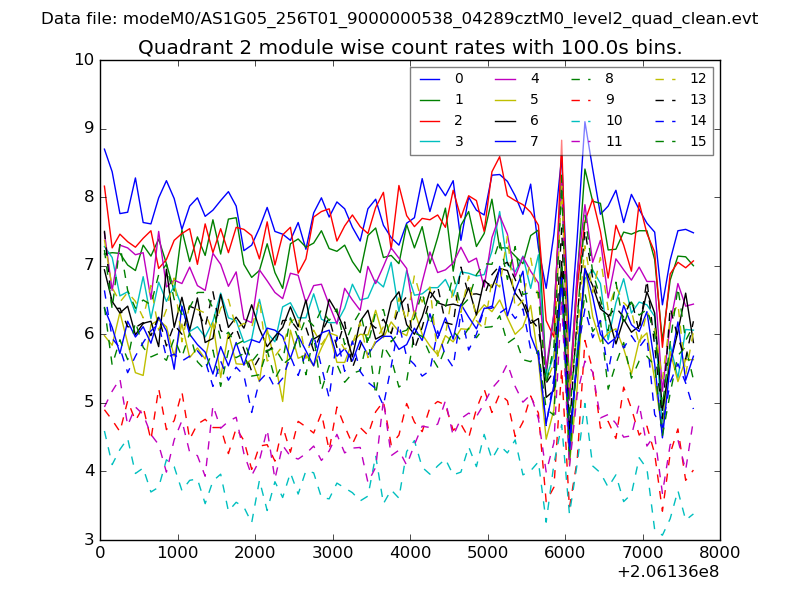
| Module-wise count rates for Quadrant B Data is divided into 100 sec bins |
 |
 |
| Module-wise count rates for Quadrant C Data is divided into 100 sec bins |
 |
 |
| Module-wise count rates for Quadrant D Data is divided into 100 sec bins |
 |
 |
| Parameter | Plot |
|---|---|
| CZT HV Monitor | 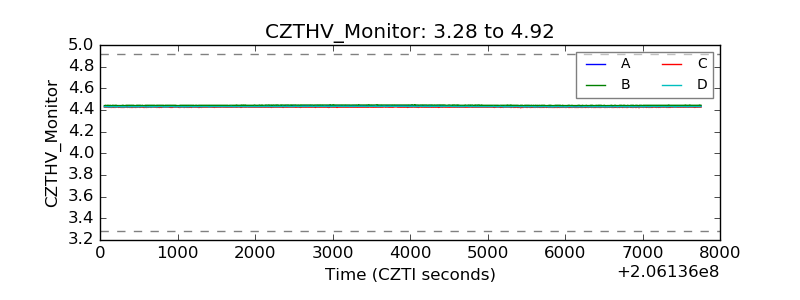 |
| D_VDD | 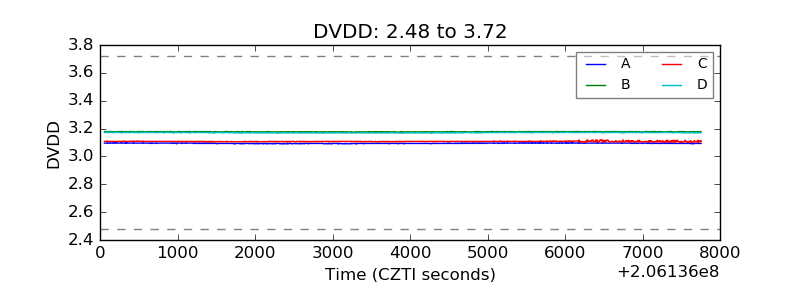 |
| Temperature 1 | 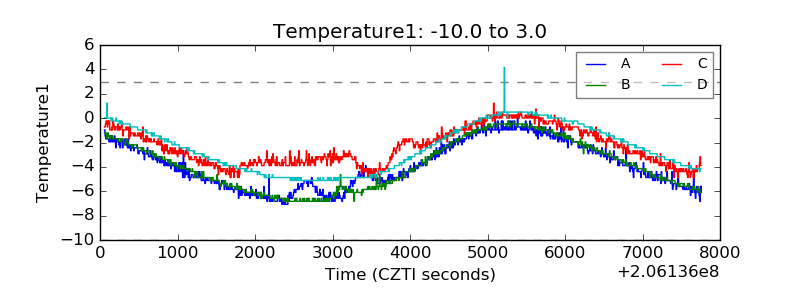 |
| Veto HV Monitor | 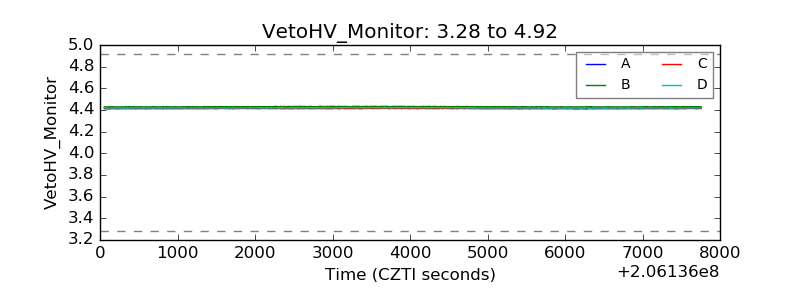 |
| Veto LLD | 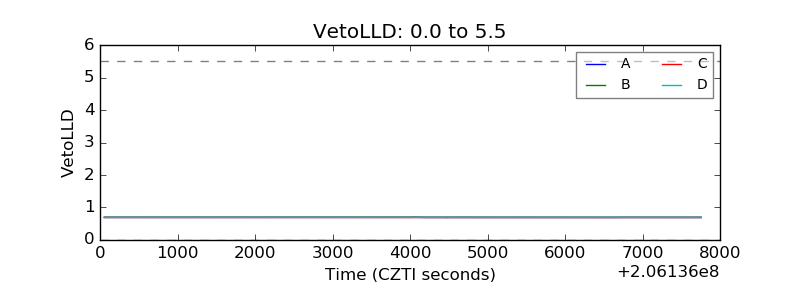 |
| Alpha Counter | 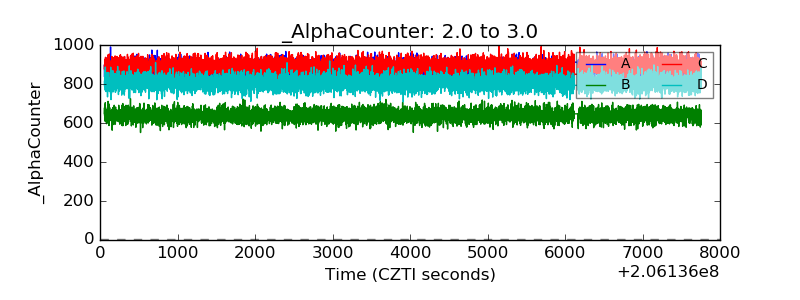 |
| _CPM_Rate | 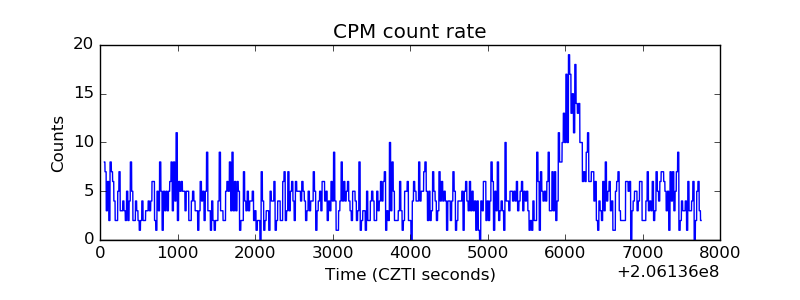 |
| CZT Counter | 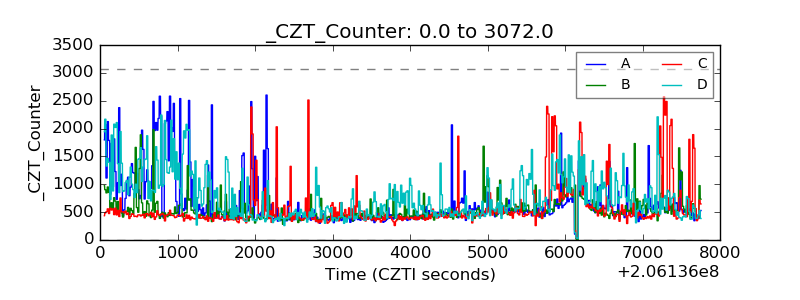 |
| +2.5 Volts monitor |  |
| +5 Volts monitor | 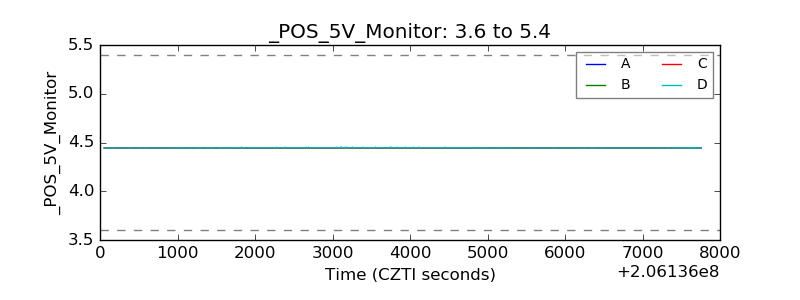 |
| _ROLL_ROT | 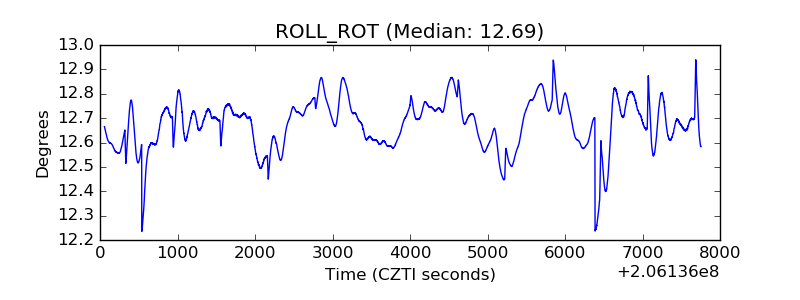 |
| _Roll_DEC | 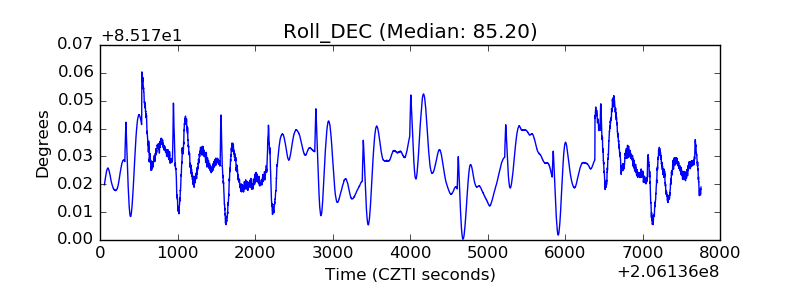 |
| _Roll_RA | 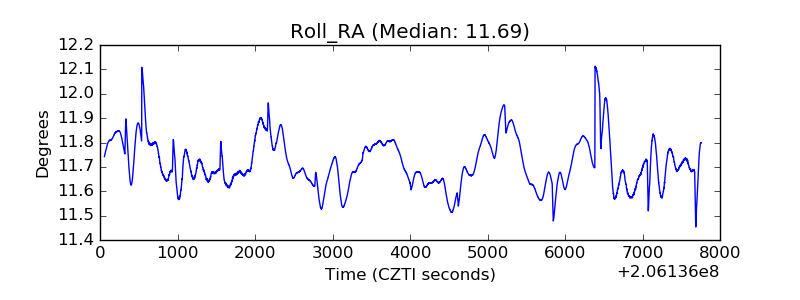 |
| Veto Counter | 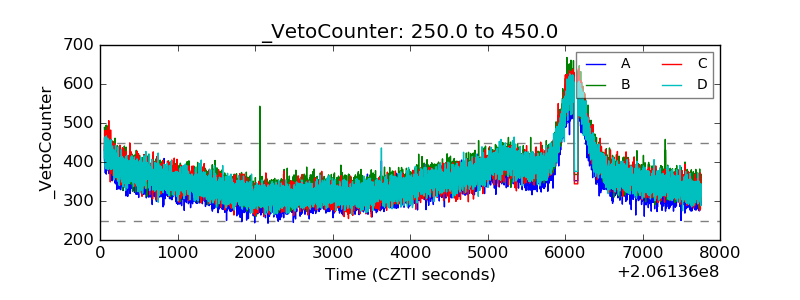 |