| Param | Original file | Final file |
|---|---|---|
| Filename | modeM0/AS1G05_256T01_9000000538_04290cztM0_level2.evt | modeM0/AS1G05_256T01_9000000538_04290cztM0_level2_quad_clean.evt |
| Size (bytes) | 648,074,880 | 125,899,200 |
| Size | 618.1 MB | 120.1 MB |
| Events in quadrant A | 4,167,944 | 835,206 |
| Events in quadrant B | 4,614,121 | 813,820 |
| Events in quadrant C | 5,125,113 | 796,544 |
| Events in quadrant D | 5,166,738 | 799,752 |
| Mode SS | |||
|---|---|---|---|
| Quadrant | BADHDUFLAG | Total packets | Discarded packets |
| A | 0 | 168 | 2 |
| B | 0 | 168 | 0 |
| C | 0 | 168 | 0 |
| D | 0 | 168 | 0 |
| Mode M0 | |||
|---|---|---|---|
| Quadrant | BADHDUFLAG | Total packets | Discarded packets |
| A | 0 | 18585 | 78 |
| B | 0 | 19494 | 52 |
| C | 0 | 20969 | 53 |
| D | 0 | 21562 | 64 |
| Mode M9 | |||
|---|---|---|---|
| Quadrant | BADHDUFLAG | Total packets | Discarded packets |
| A | 0 | 3 | 0 |
| B | 0 | 3 | 0 |
| C | 0 | 3 | 0 |
| D | 0 | 3 | 0 |
| Quadrant | Total seconds | Saturated seconds | Saturation percentage |
|---|---|---|---|
| A | 8157 | 161 | 1.973765% |
| B | 8158 | 147 | 1.801912% |
| C | 8158 | 383 | 4.694778% |
| D | 8157 | 244 | 2.991296% |
Noise dominated data is calculated using 1-second bins in cleaned event files. If a bin has >2000 counts, and if more than 50% of those come from <1% of pixels, then it is considered to be noise-dominated and hence unusable.
| Quadrant | # 1 sec bins | Bins with >0 counts | Bins with >2000 counts | High rate bins dominated by noise | Noise dominated (total time) | Noise dominated (detector-on time) | Marked lightcurve |
|---|---|---|---|---|---|---|---|
| A | 8570 | 8177 | 64 | 64 | 0.75% | 0.78% | 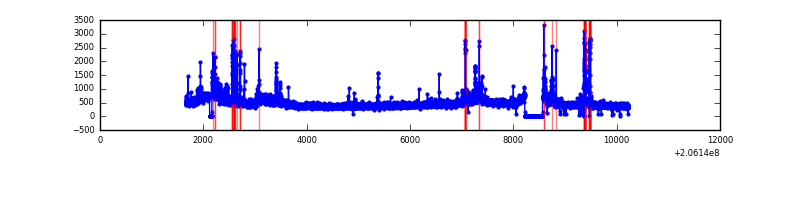 |
| B | 8570 | 8182 | 23 | 23 | 0.27% | 0.28% | 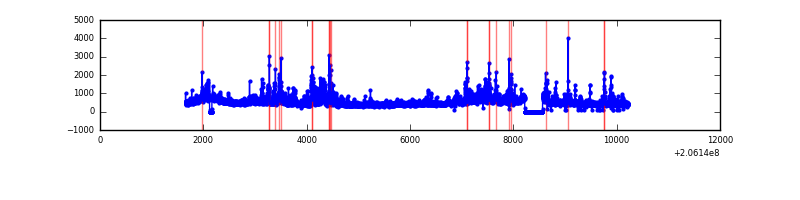 |
| C | 8570 | 8180 | 224 | 224 | 2.61% | 2.74% | 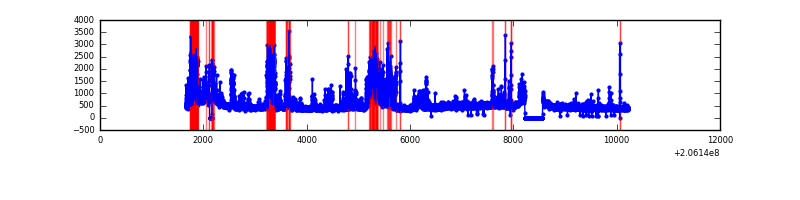 |
| D | 8570 | 8182 | 82 | 82 | 0.96% | 1.00% | 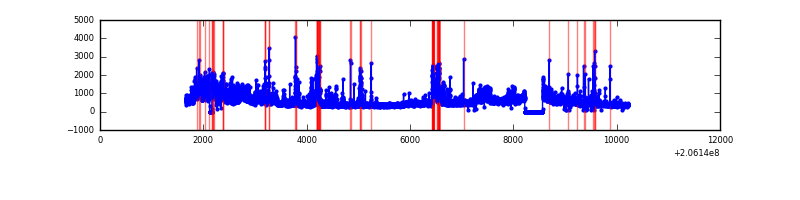 |
Top three noisy pixels from each quadrant. If the there are fewer than three noisy pixels in the level2.evt file, extra rows are filled as -1
| Pixel properties | Quadrant properties | ||||||
|---|---|---|---|---|---|---|---|
| Quadrant | DetID | PixID | Counts | Sigma | Mean | Median | Sigma |
| A | 0 | 199 | 398587 | 2111.67 | 920 | 899 | 188.3 |
| A | 15 | 234 | 131288 | 692.35 | 920 | 899 | 188.3 |
| A | 0 | 226 | 47788 | 248.97 | 920 | 899 | 188.3 |
| B | 10 | 16 | 398802 | 2216.52 | 933 | 908 | 179.5 |
| B | 14 | 167 | 330934 | 1838.45 | 933 | 908 | 179.5 |
| B | 15 | 204 | 91732 | 505.95 | 933 | 908 | 179.5 |
| C | 9 | 144 | 1556101 | 7508.47 | 888 | 887 | 207.1 |
| C | 9 | 247 | 58957 | 280.36 | 888 | 887 | 207.1 |
| C | 10 | 65 | 13636 | 61.55 | 888 | 887 | 207.1 |
| D | 2 | 232 | 1226772 | 5674.5 | 894 | 865 | 216.0 |
| D | 8 | 112 | 76501 | 350.11 | 894 | 865 | 216.0 |
| D | 2 | 37 | 65769 | 300.43 | 894 | 865 | 216.0 |
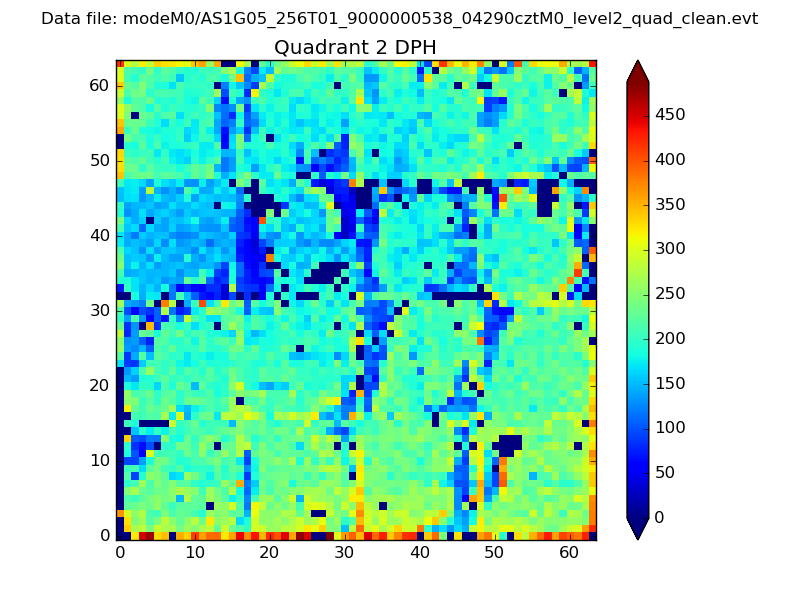
Histogram calculated using DETX and DETY for each event in the final _common_clean file
| Quadrant A | 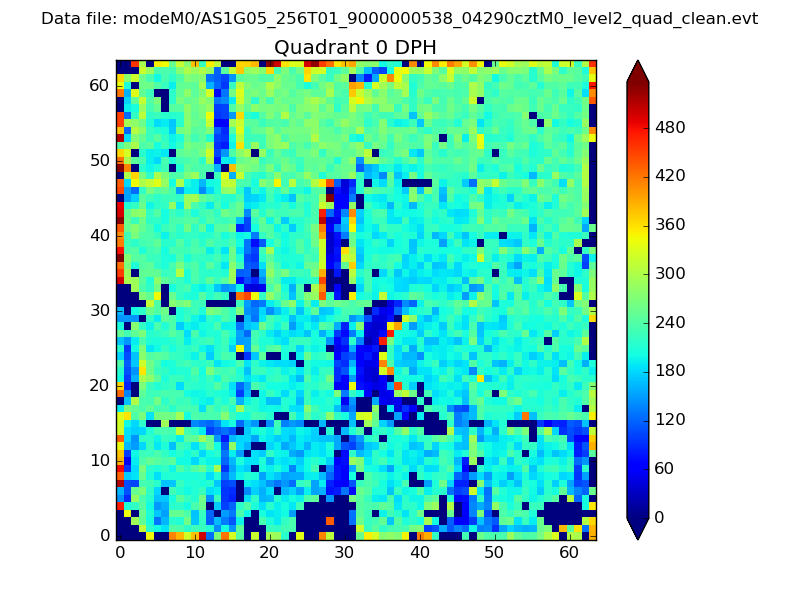 |
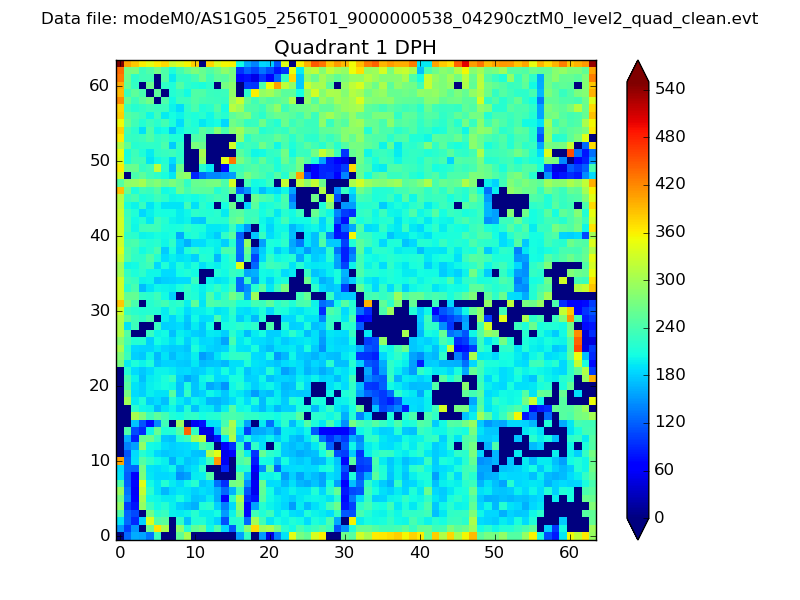 |
Quadrant B |
|---|---|---|---|
| Quadrant D | 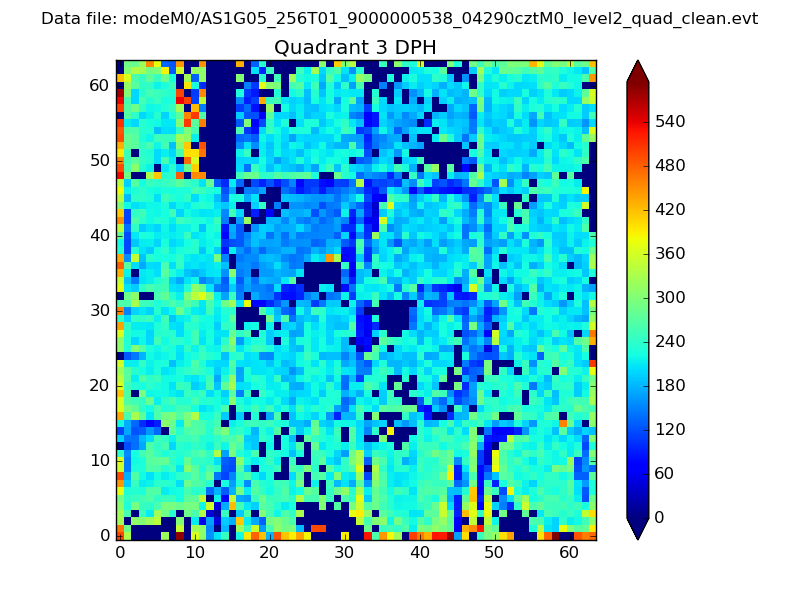 |
 |
Quadrant C |
| Plot type | Count rate plots | Images |
|---|---|---|
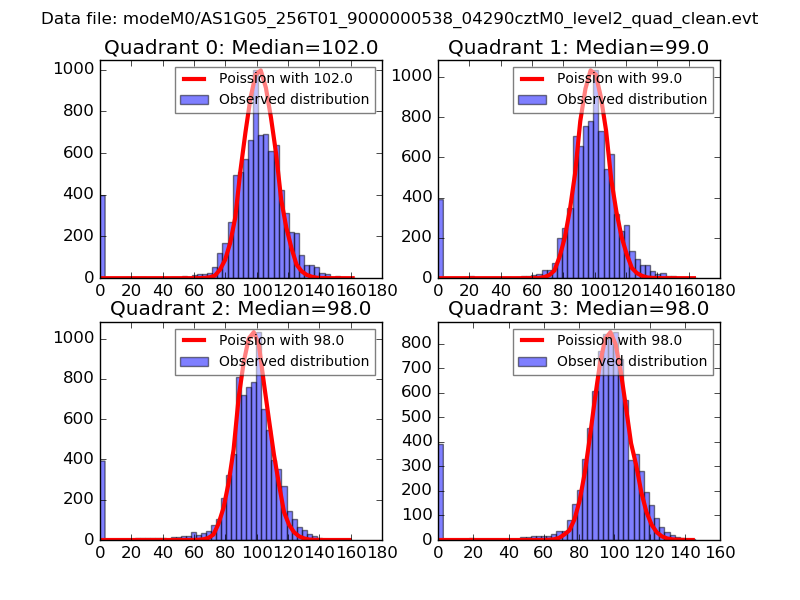
| Comparison with Poisson distribution Blue bars denote a histogram of data divided into 1 sec bins. Red curve is a Poisson curve with rate = median count rate of data. |
 |
 |
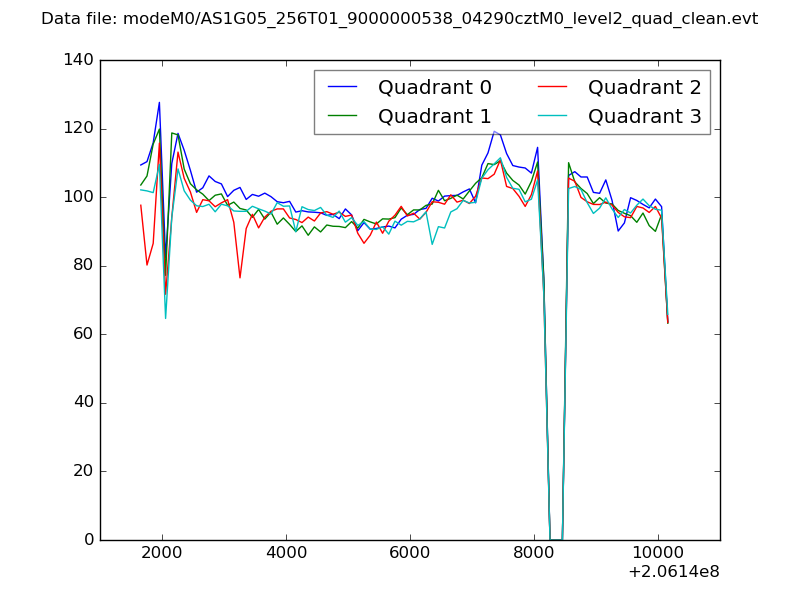
| Quadrant-wise count rates Data is divided into 100 sec bins |
 |
|
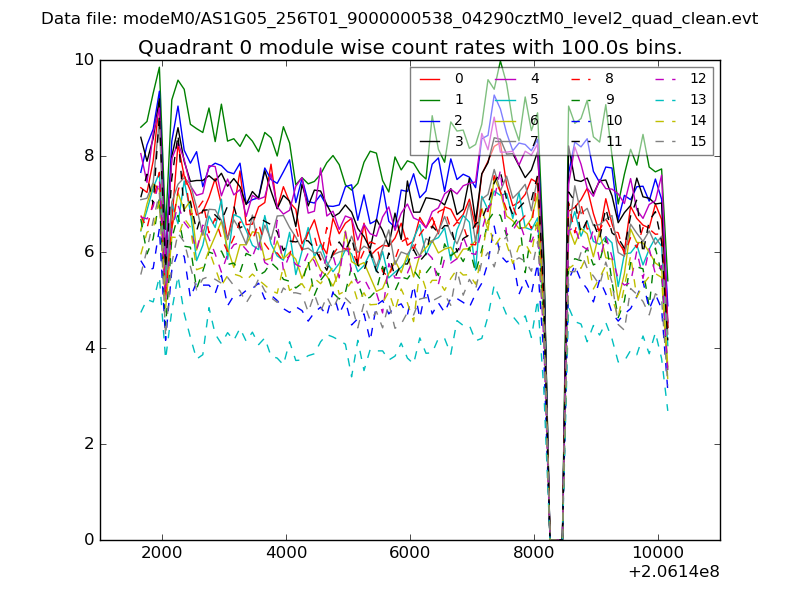
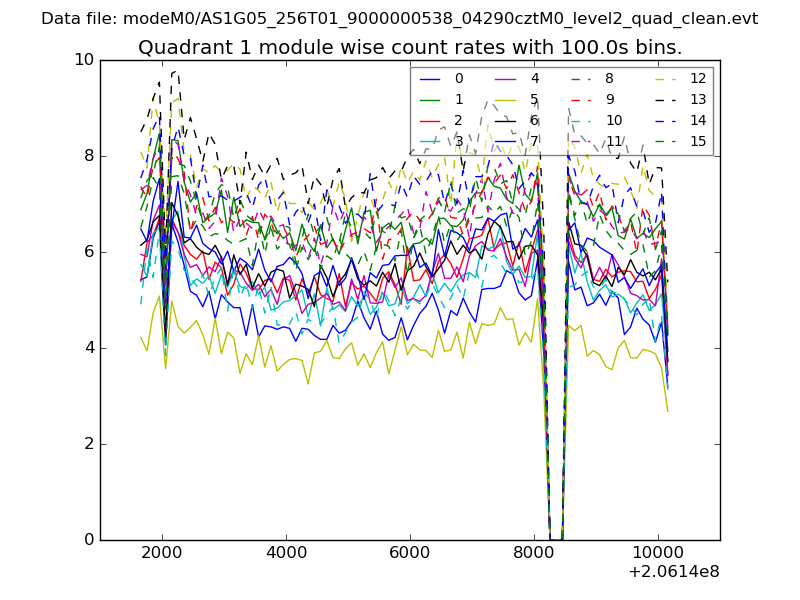
| Module-wise count rates for Quadrant A Data is divided into 100 sec bins |
 |
 |
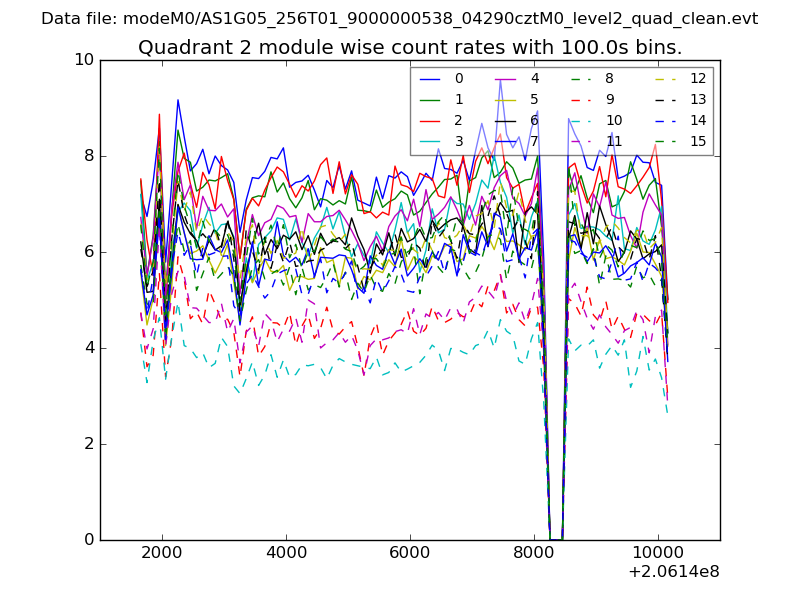
| Module-wise count rates for Quadrant B Data is divided into 100 sec bins |
 |
 |
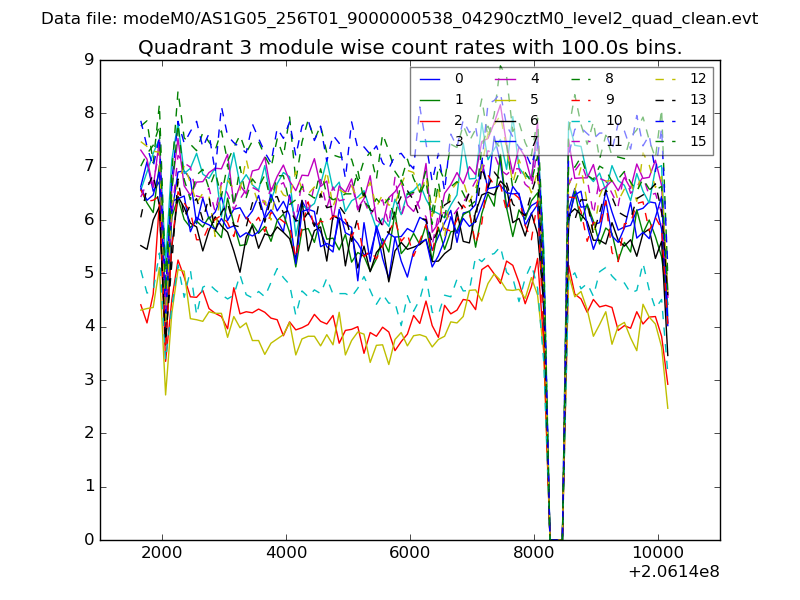
| Module-wise count rates for Quadrant C Data is divided into 100 sec bins |
 |
 |
| Module-wise count rates for Quadrant D Data is divided into 100 sec bins |
 |
 |
| Parameter | Plot |
|---|---|
| CZT HV Monitor | 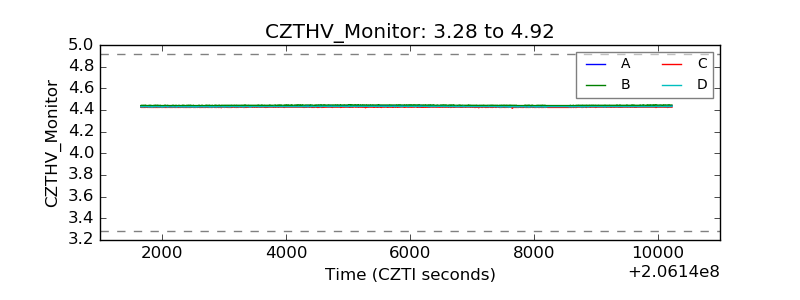 |
| D_VDD | 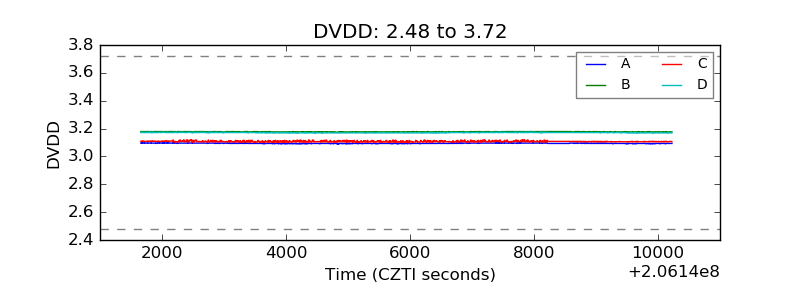 |
| Temperature 1 | 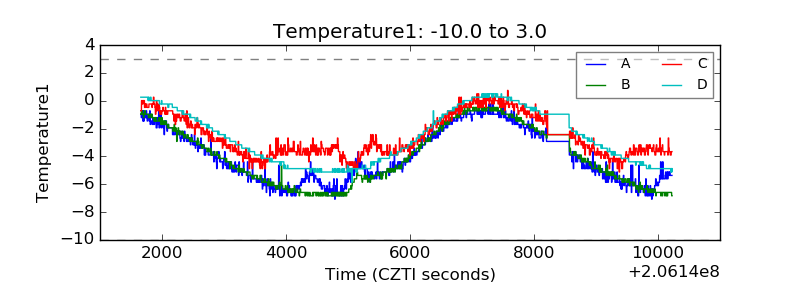 |
| Veto HV Monitor | 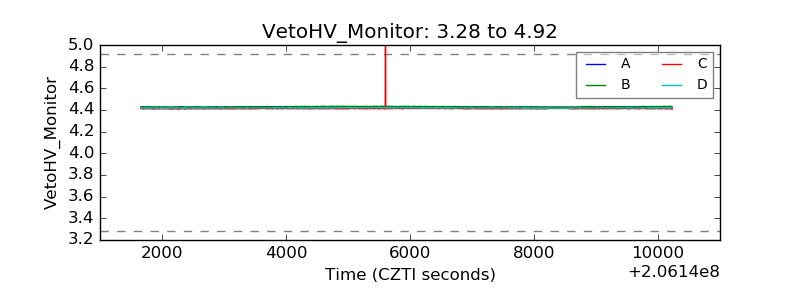 |
| Veto LLD | 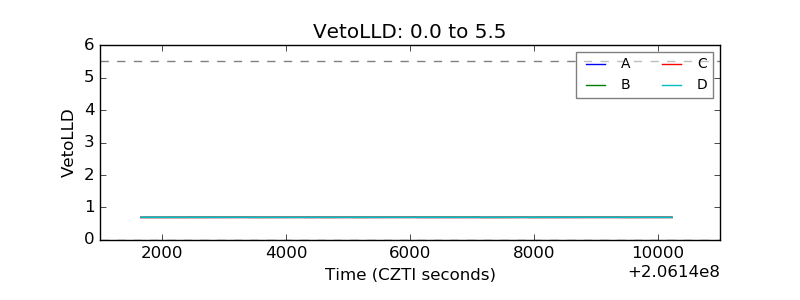 |
| Alpha Counter | 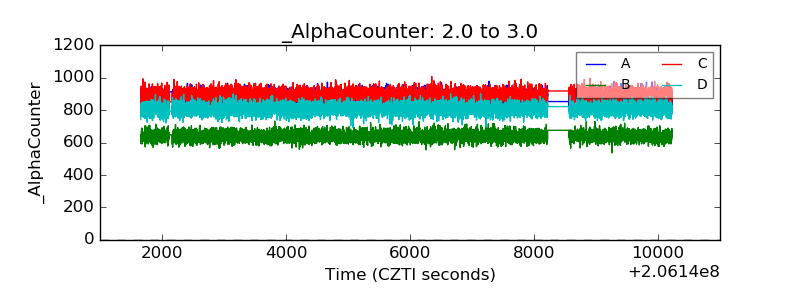 |
| _CPM_Rate | 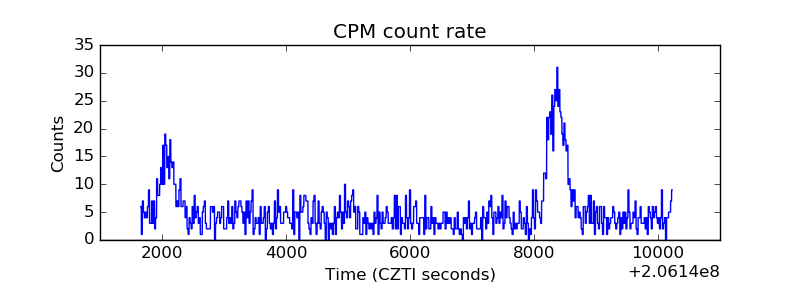 |
| CZT Counter | 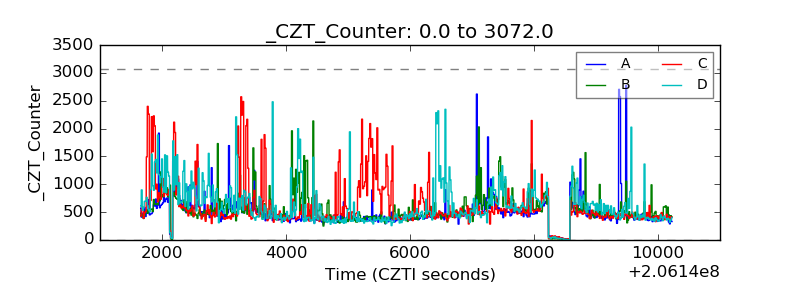 |
| +2.5 Volts monitor |  |
| +5 Volts monitor |  |
| _ROLL_ROT | 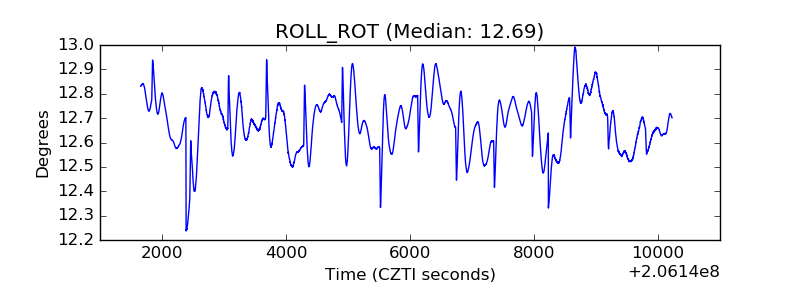 |
| _Roll_DEC | 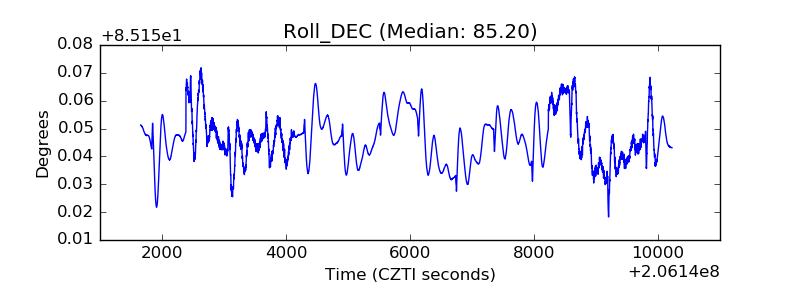 |
| _Roll_RA | 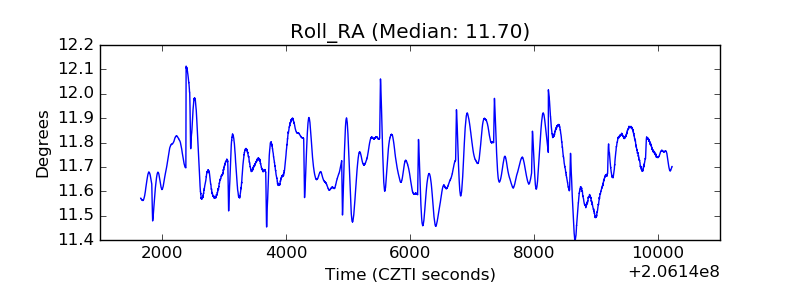 |
| Veto Counter | 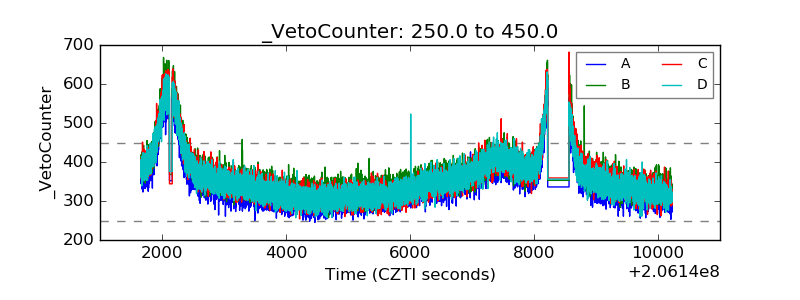 |