| Param | Original file | Final file |
|---|---|---|
| Filename | modeM0/AS1G05_256T01_9000000538_04292cztM0_level2.evt | modeM0/AS1G05_256T01_9000000538_04292cztM0_level2_quad_clean.evt |
| Size (bytes) | 1,085,224,320 | 199,146,240 |
| Size | 1.0 GB | 189.9 MB |
| Events in quadrant A | 7,063,197 | 1,307,218 |
| Events in quadrant B | 6,869,308 | 1,290,569 |
| Events in quadrant C | 9,093,786 | 1,257,753 |
| Events in quadrant D | 8,949,809 | 1,265,261 |
| Mode SS | |||
|---|---|---|---|
| Quadrant | BADHDUFLAG | Total packets | Discarded packets |
| A | 0 | 272 | 0 |
| B | 0 | 272 | 0 |
| C | 0 | 272 | 0 |
| D | 0 | 272 | 0 |
| Mode M0 | |||
|---|---|---|---|
| Quadrant | BADHDUFLAG | Total packets | Discarded packets |
| A | 0 | 30916 | 129 |
| B | 0 | 29850 | 88 |
| C | 0 | 36674 | 143 |
| D | 0 | 36949 | 155 |
| Mode M9 | |||
|---|---|---|---|
| Quadrant | BADHDUFLAG | Total packets | Discarded packets |
| A | 0 | 15 | 0 |
| B | 0 | 15 | 0 |
| C | 0 | 15 | 0 |
| D | 0 | 15 | 0 |
| Quadrant | Total seconds | Saturated seconds | Saturation percentage |
|---|---|---|---|
| A | 13163 | 357 | 2.712148% |
| B | 13172 | 222 | 1.685393% |
| C | 13165 | 829 | 6.297000% |
| D | 13164 | 595 | 4.519903% |
Noise dominated data is calculated using 1-second bins in cleaned event files. If a bin has >2000 counts, and if more than 50% of those come from <1% of pixels, then it is considered to be noise-dominated and hence unusable.
| Quadrant | # 1 sec bins | Bins with >0 counts | Bins with >2000 counts | High rate bins dominated by noise | Noise dominated (total time) | Noise dominated (detector-on time) | Marked lightcurve |
|---|---|---|---|---|---|---|---|
| A | 14748 | 13200 | 239 | 239 | 1.62% | 1.81% | 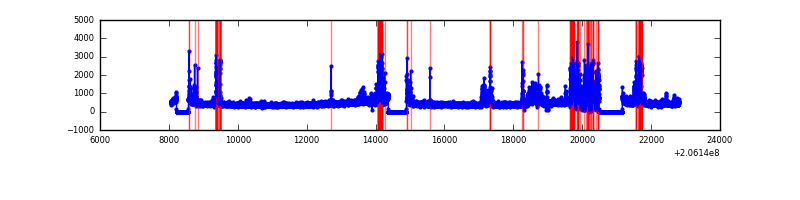 |
| B | 14748 | 13201 | 120 | 120 | 0.81% | 0.91% | 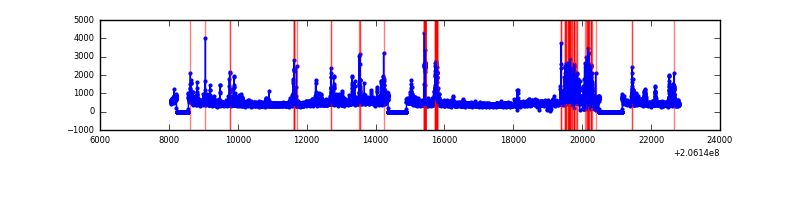 |
| C | 14748 | 13197 | 732 | 732 | 4.96% | 5.55% |  |
| D | 14748 | 13197 | 418 | 418 | 2.83% | 3.17% | 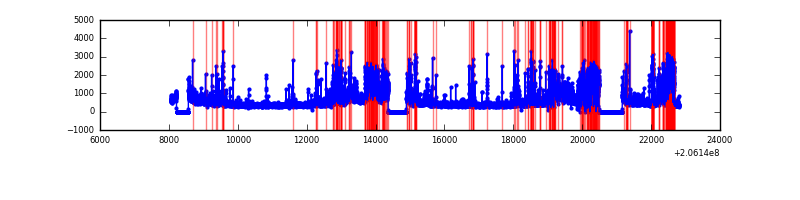 |
Top three noisy pixels from each quadrant. If the there are fewer than three noisy pixels in the level2.evt file, extra rows are filled as -1
| Pixel properties | Quadrant properties | ||||||
|---|---|---|---|---|---|---|---|
| Quadrant | DetID | PixID | Counts | Sigma | Mean | Median | Sigma |
| A | 0 | 199 | 816226 | 2778.61 | 1435 | 1403 | 293.2 |
| A | 15 | 234 | 476043 | 1618.56 | 1435 | 1403 | 293.2 |
| A | 0 | 226 | 93744 | 314.89 | 1435 | 1403 | 293.2 |
| B | 10 | 16 | 381240 | 1357.65 | 1462 | 1425 | 279.8 |
| B | 14 | 167 | 324411 | 1154.52 | 1462 | 1425 | 279.8 |
| B | 4 | 48 | 127237 | 449.72 | 1462 | 1425 | 279.8 |
| C | 9 | 144 | 3466593 | 10864.43 | 1378 | 1379 | 319.0 |
| C | 9 | 247 | 170657 | 530.73 | 1378 | 1379 | 319.0 |
| C | 10 | 65 | 34364 | 103.42 | 1378 | 1379 | 319.0 |
| D | 2 | 232 | 2296089 | 6834.05 | 1394 | 1352 | 335.8 |
| D | 12 | 22 | 392333 | 1164.4 | 1394 | 1352 | 335.8 |
| D | 2 | 37 | 214087 | 633.55 | 1394 | 1352 | 335.8 |
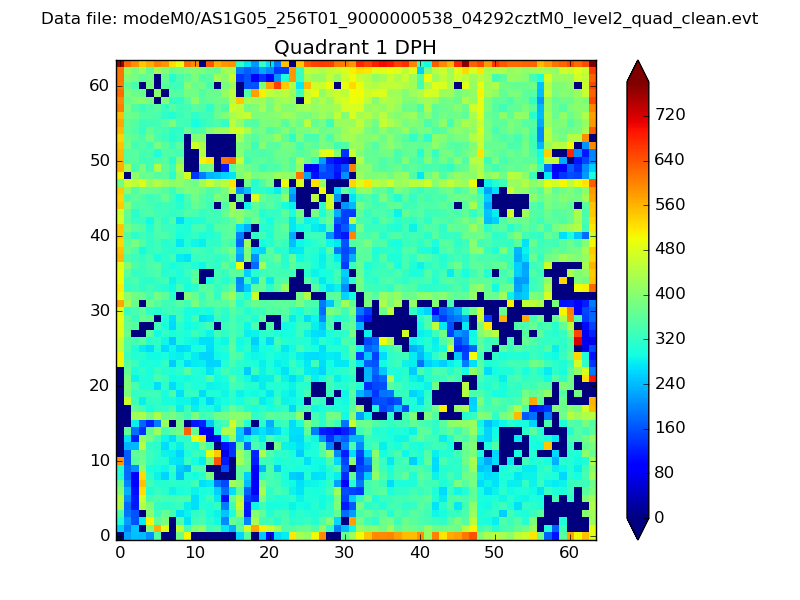
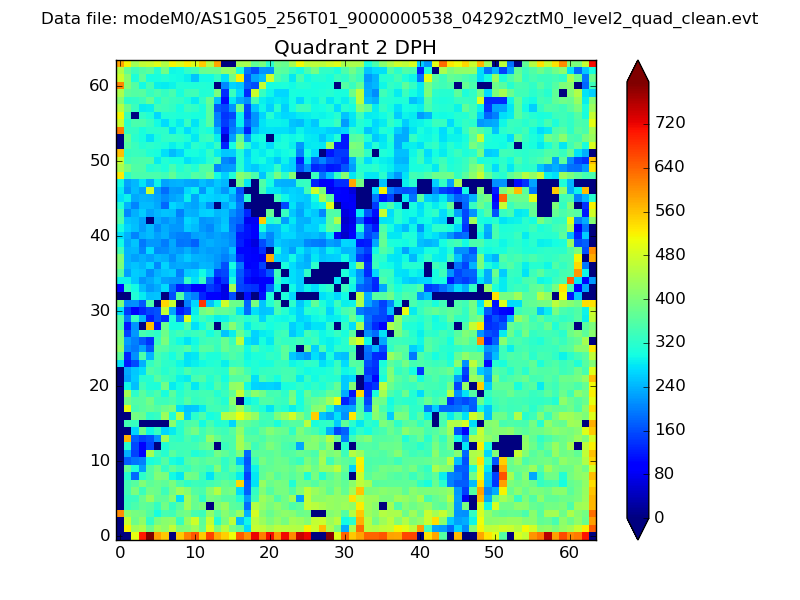
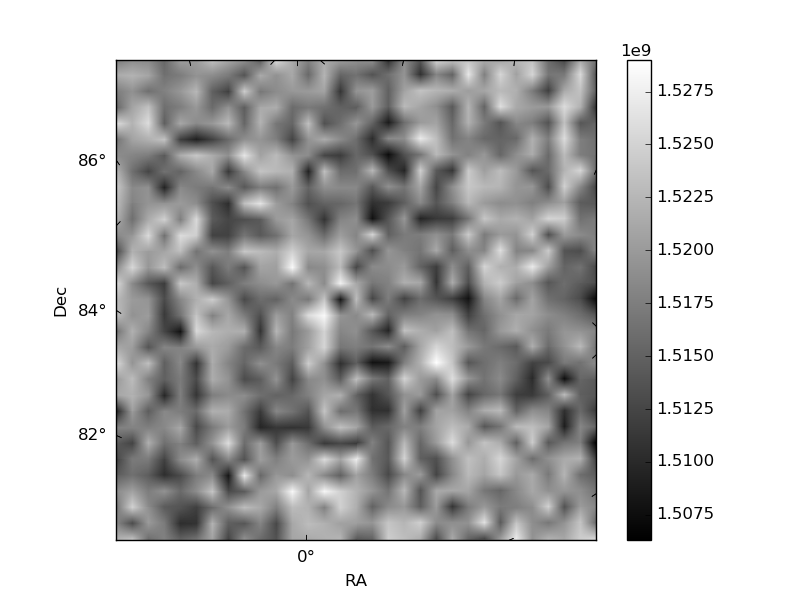
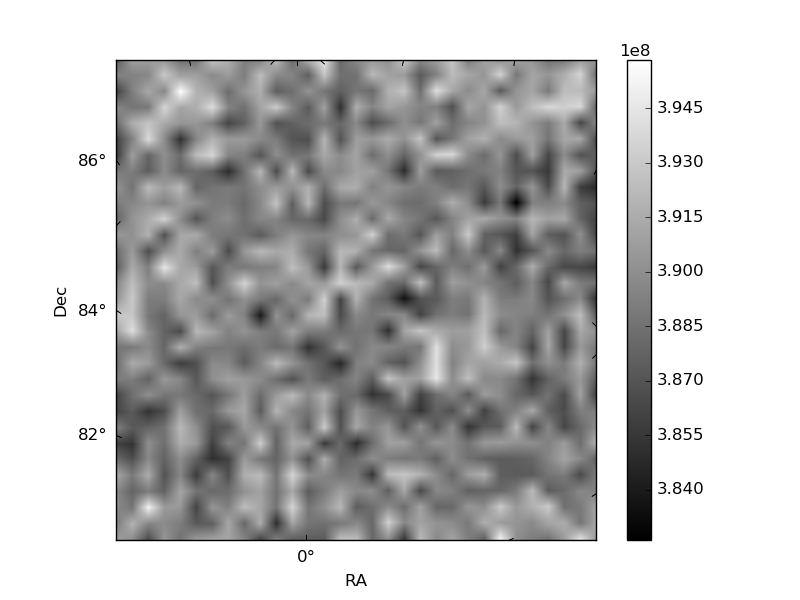
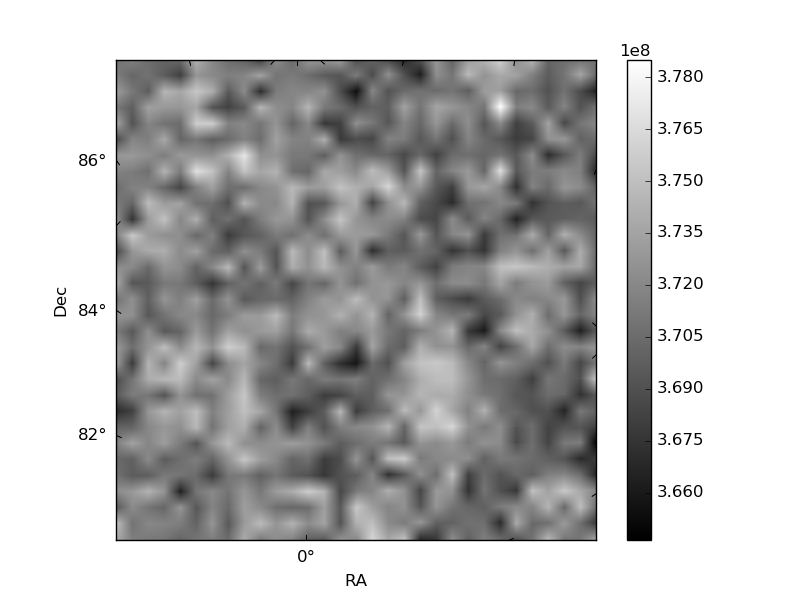
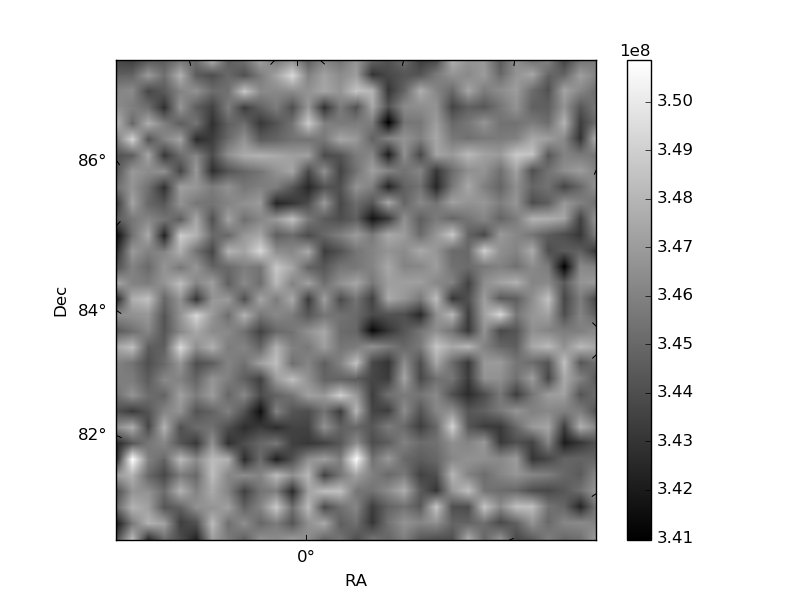
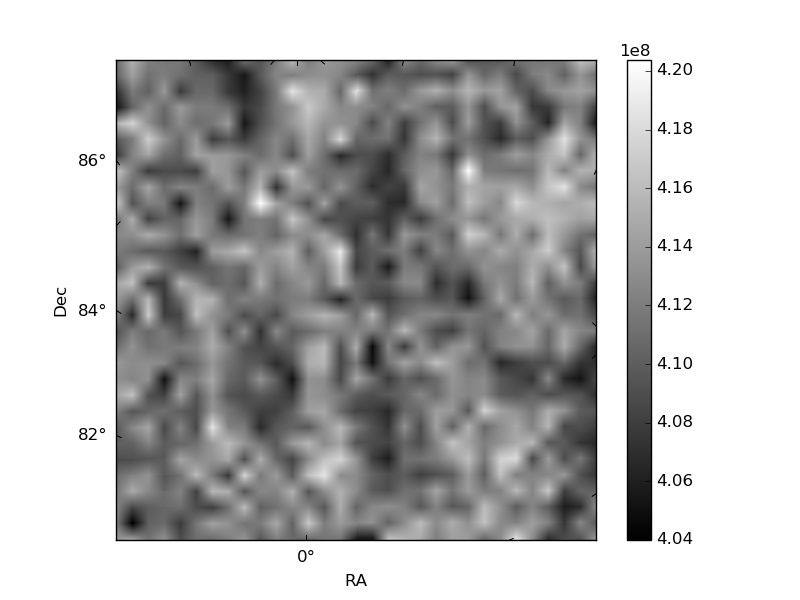
Histogram calculated using DETX and DETY for each event in the final _common_clean file
| Quadrant A | 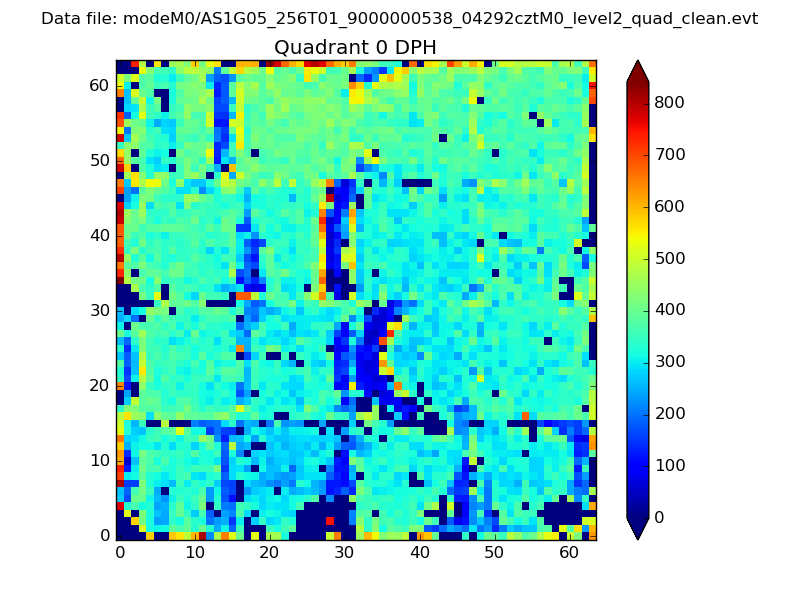 |
 |
Quadrant B |
|---|---|---|---|
| Quadrant D | 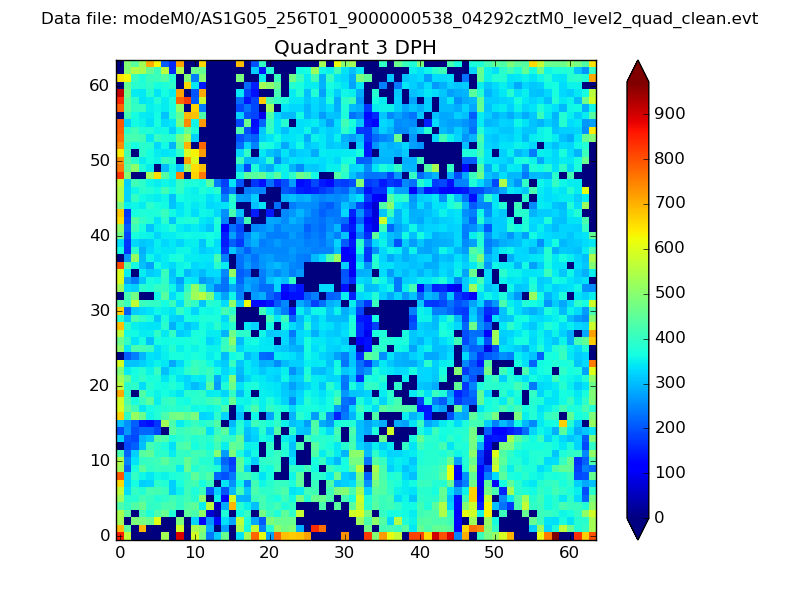 |
 |
Quadrant C |
| Plot type | Count rate plots | Images |
|---|---|---|
| Comparison with Poisson distribution Blue bars denote a histogram of data divided into 1 sec bins. Red curve is a Poisson curve with rate = median count rate of data. |
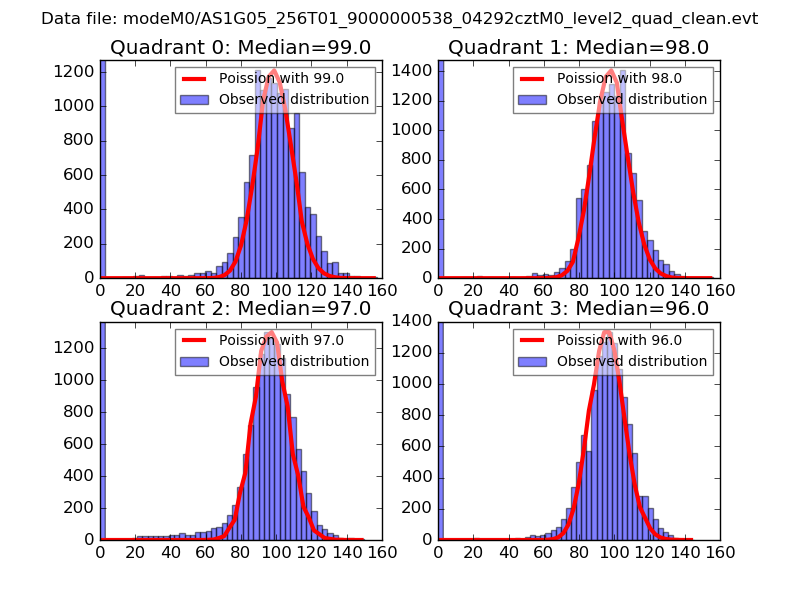 |
 |
| Quadrant-wise count rates Data is divided into 100 sec bins |
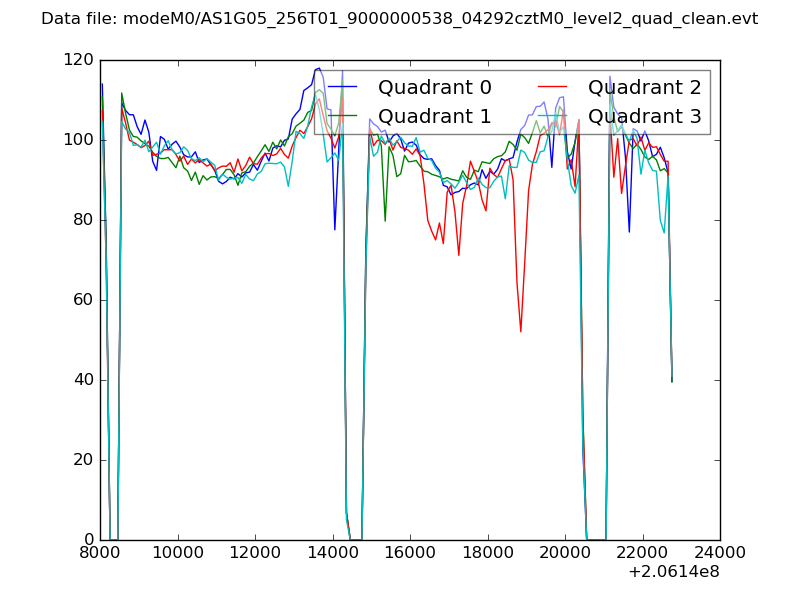 |
|
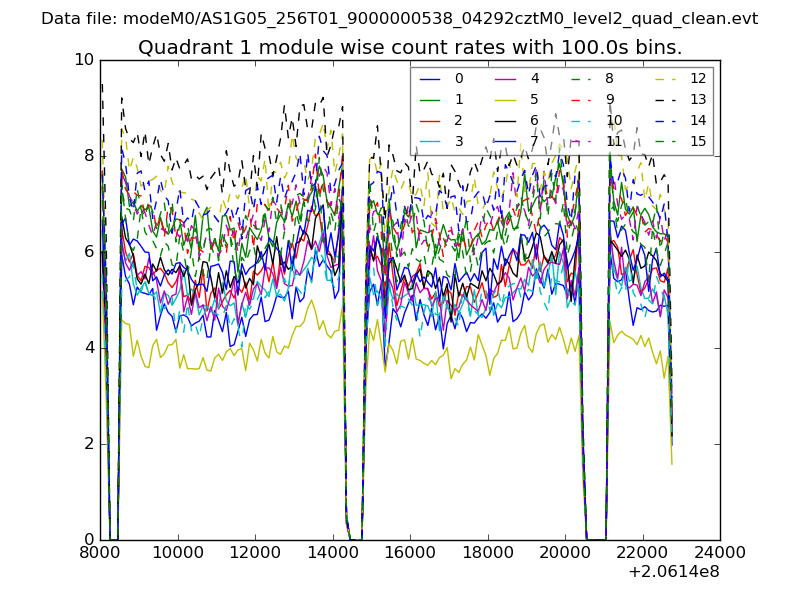
| Module-wise count rates for Quadrant A Data is divided into 100 sec bins |
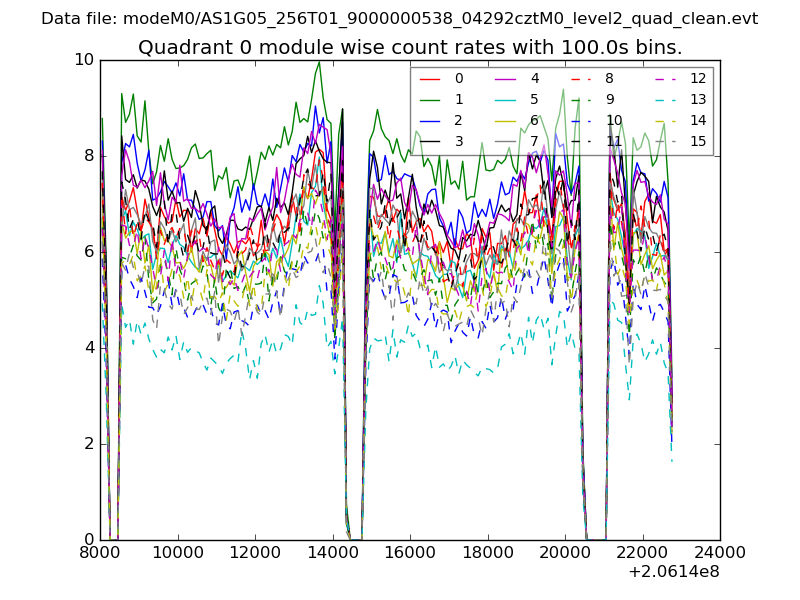 |
 |
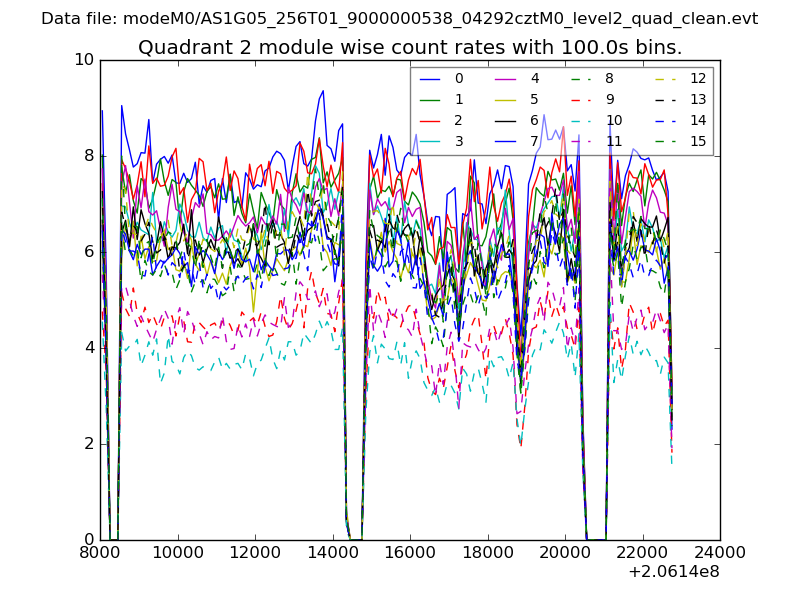
| Module-wise count rates for Quadrant B Data is divided into 100 sec bins |
 |
 |
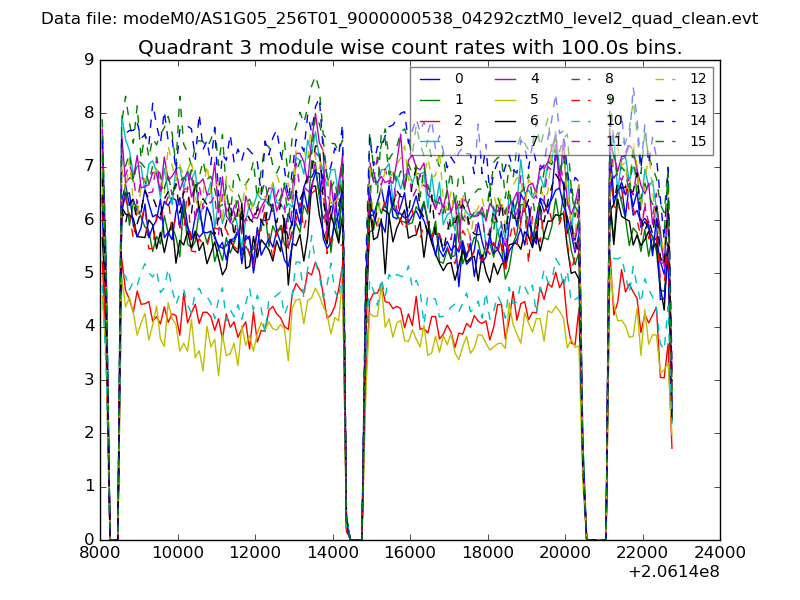
| Module-wise count rates for Quadrant C Data is divided into 100 sec bins |
 |
 |
| Module-wise count rates for Quadrant D Data is divided into 100 sec bins |
 |
 |
| Parameter | Plot |
|---|---|
| CZT HV Monitor | 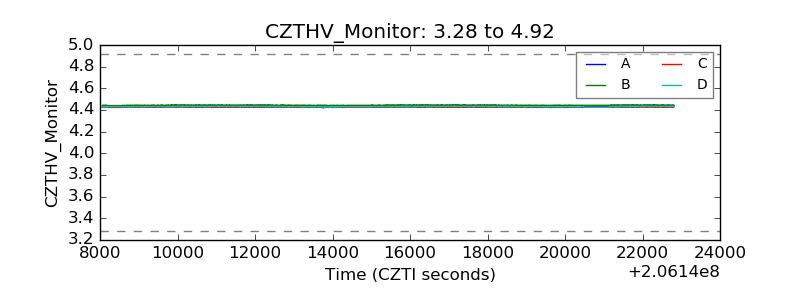 |
| D_VDD | 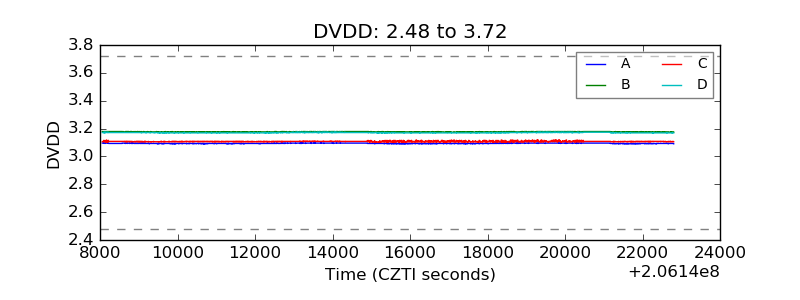 |
| Temperature 1 | 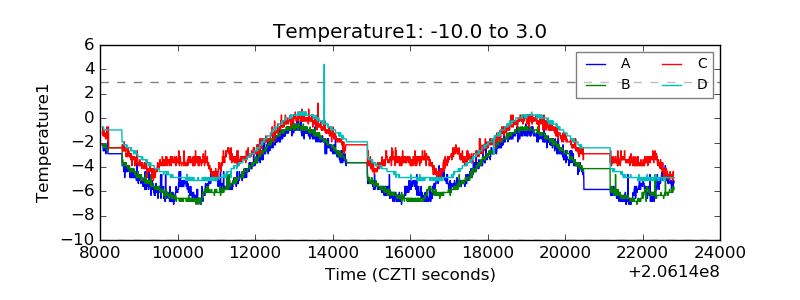 |
| Veto HV Monitor | 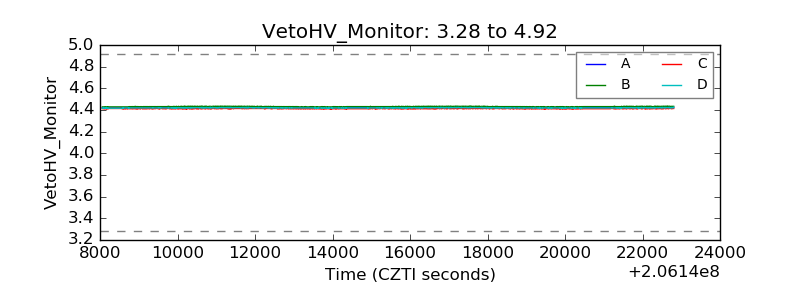 |
| Veto LLD | 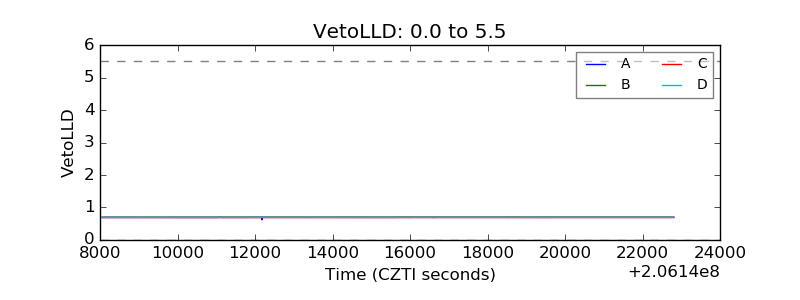 |
| Alpha Counter | 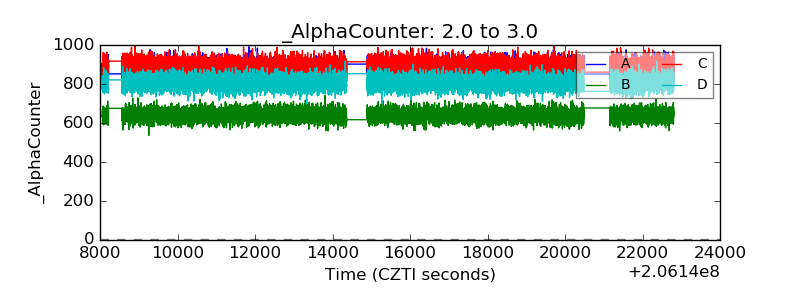 |
| _CPM_Rate | 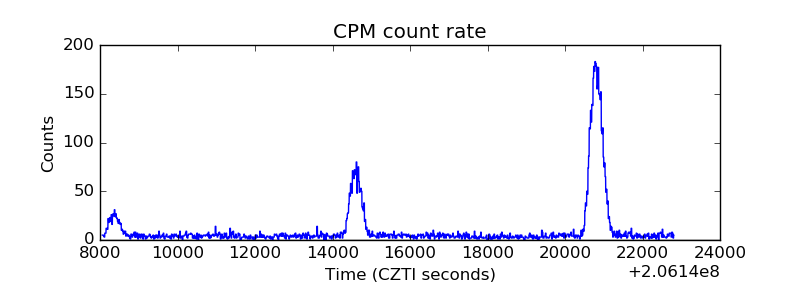 |
| CZT Counter |  |
| +2.5 Volts monitor |  |
| +5 Volts monitor |  |
| _ROLL_ROT | 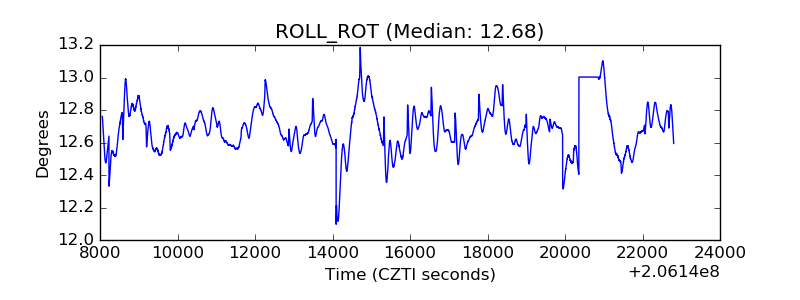 |
| _Roll_DEC | 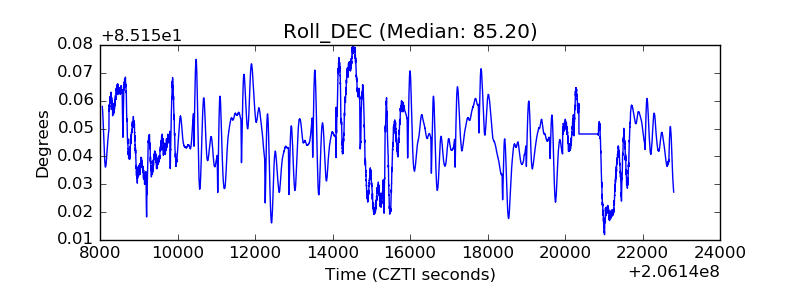 |
| _Roll_RA | 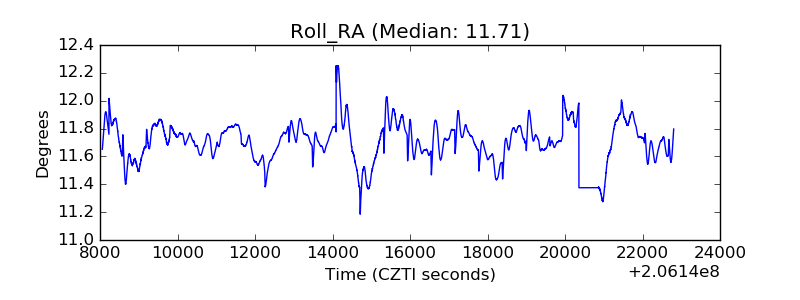 |
| Veto Counter | 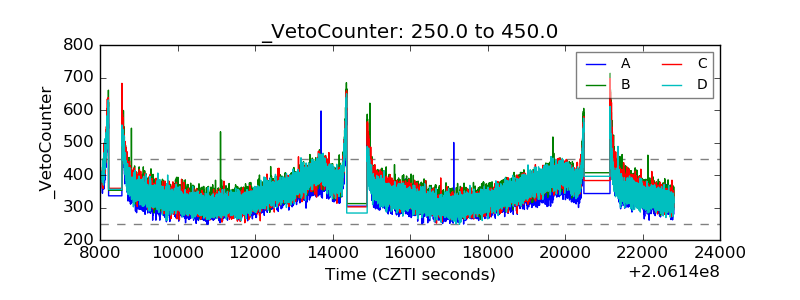 |