| Param | Original file | Final file |
|---|---|---|
| Filename | modeM0/AS1G05_256T01_9000000538_04293cztM0_level2.evt | modeM0/AS1G05_256T01_9000000538_04293cztM0_level2_quad_clean.evt |
| Size (bytes) | 742,740,480 | 100,065,600 |
| Size | 708.3 MB | 95.4 MB |
| Events in quadrant A | 4,112,345 | 684,534 |
| Events in quadrant B | 3,446,956 | 681,877 |
| Events in quadrant C | 7,099,404 | 569,050 |
| Events in quadrant D | 7,367,915 | 612,210 |
| Mode SS | |||
|---|---|---|---|
| Quadrant | BADHDUFLAG | Total packets | Discarded packets |
| A | 0 | 142 | 0 |
| B | 0 | 142 | 0 |
| C | 0 | 142 | 0 |
| D | 0 | 142 | 0 |
| Mode M0 | |||
|---|---|---|---|
| Quadrant | BADHDUFLAG | Total packets | Discarded packets |
| A | 0 | 17005 | 3 |
| B | 0 | 15069 | 2 |
| C | 0 | 26181 | 2 |
| D | 0 | 26799 | 5 |
| Mode M9 | |||
|---|---|---|---|
| Quadrant | BADHDUFLAG | Total packets | Discarded packets |
| A | 0 | 8 | 0 |
| B | 0 | 8 | 0 |
| C | 0 | 8 | 0 |
| D | 0 | 8 | 0 |
| Quadrant | Total seconds | Saturated seconds | Saturation percentage |
|---|---|---|---|
| A | 6900 | 341 | 4.942029% |
| B | 6900 | 54 | 0.782609% |
| C | 6900 | 1912 | 27.710145% |
| D | 6899 | 1276 | 18.495434% |
Noise dominated data is calculated using 1-second bins in cleaned event files. If a bin has >2000 counts, and if more than 50% of those come from <1% of pixels, then it is considered to be noise-dominated and hence unusable.
| Quadrant | # 1 sec bins | Bins with >0 counts | Bins with >2000 counts | High rate bins dominated by noise | Noise dominated (total time) | Noise dominated (detector-on time) | Marked lightcurve |
|---|---|---|---|---|---|---|---|
| A | 7765 | 6901 | 260 | 260 | 3.35% | 3.77% | 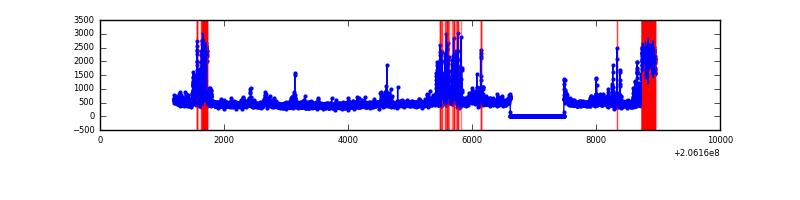 |
| B | 7765 | 6901 | 17 | 17 | 0.22% | 0.25% | 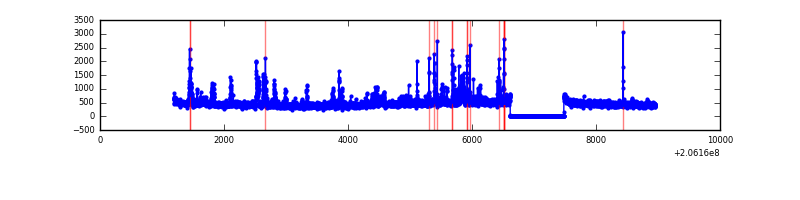 |
| C | 7764 | 6899 | 1658 | 1658 | 21.35% | 24.03% | 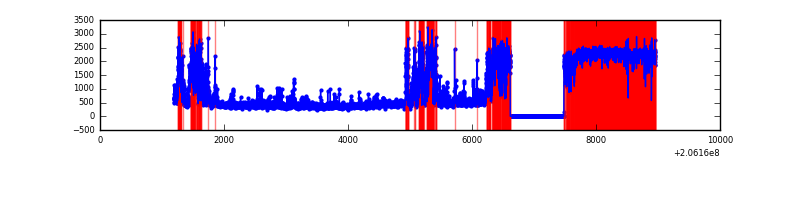 |
| D | 7765 | 6901 | 1205 | 1205 | 15.52% | 17.46% | 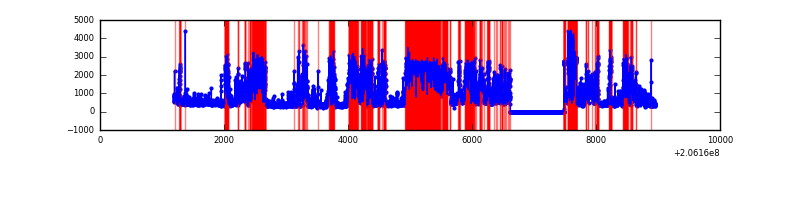 |
Top three noisy pixels from each quadrant. If the there are fewer than three noisy pixels in the level2.evt file, extra rows are filled as -1
| Pixel properties | Quadrant properties | ||||||
|---|---|---|---|---|---|---|---|
| Quadrant | DetID | PixID | Counts | Sigma | Mean | Median | Sigma |
| A | 0 | 199 | 738531 | 4772.3 | 748 | 731 | 154.6 |
| A | 15 | 234 | 330282 | 2131.63 | 748 | 731 | 154.6 |
| A | 0 | 226 | 81753 | 524.07 | 748 | 731 | 154.6 |
| B | 14 | 167 | 382006 | 2585.67 | 765 | 747 | 147.5 |
| B | 4 | 48 | 27176 | 179.24 | 765 | 747 | 147.5 |
| B | 10 | 16 | 18576 | 120.91 | 765 | 747 | 147.5 |
| C | 9 | 144 | 4564875 | 31318.75 | 626 | 628 | 145.7 |
| C | 9 | 247 | 72486 | 493.07 | 626 | 628 | 145.7 |
| C | 10 | 65 | 10024 | 64.47 | 626 | 628 | 145.7 |
| D | 2 | 232 | 3899998 | 23836.2 | 677 | 657 | 163.6 |
| D | 15 | 217 | 358352 | 2186.55 | 677 | 657 | 163.6 |
| D | 2 | 37 | 215726 | 1314.69 | 677 | 657 | 163.6 |
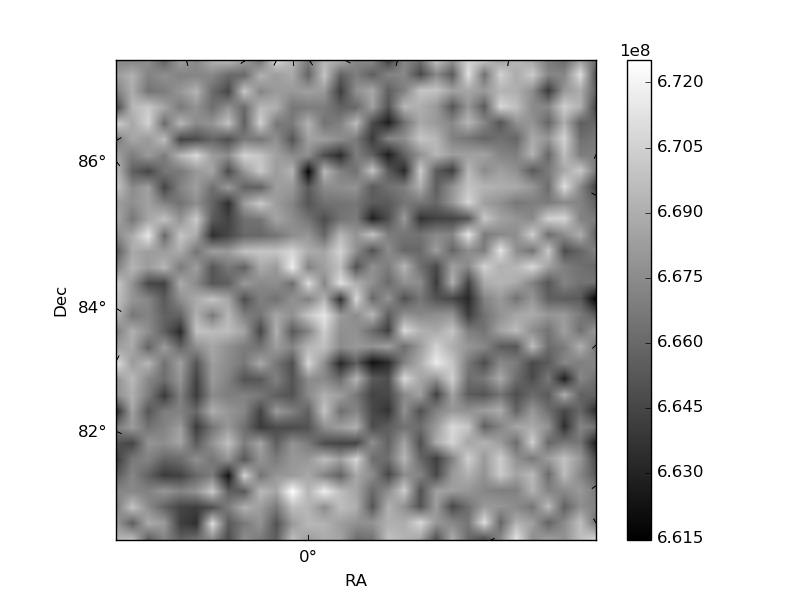
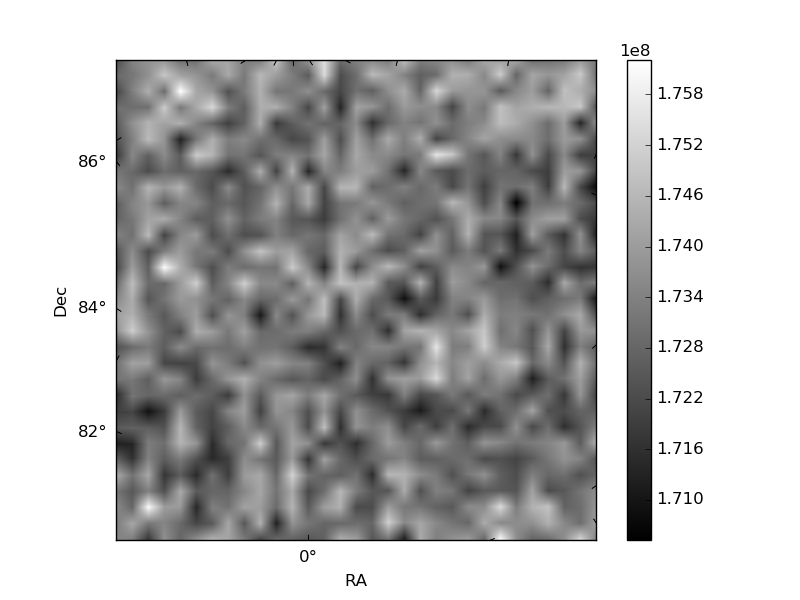
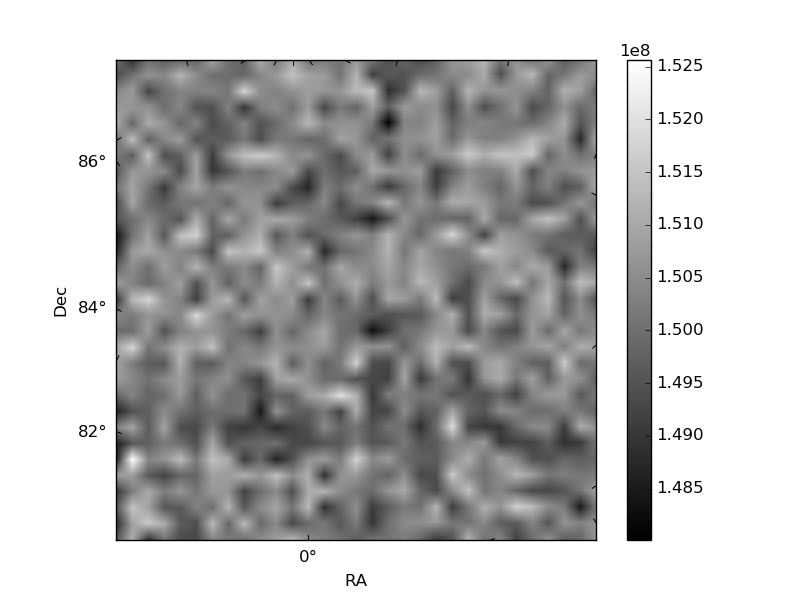
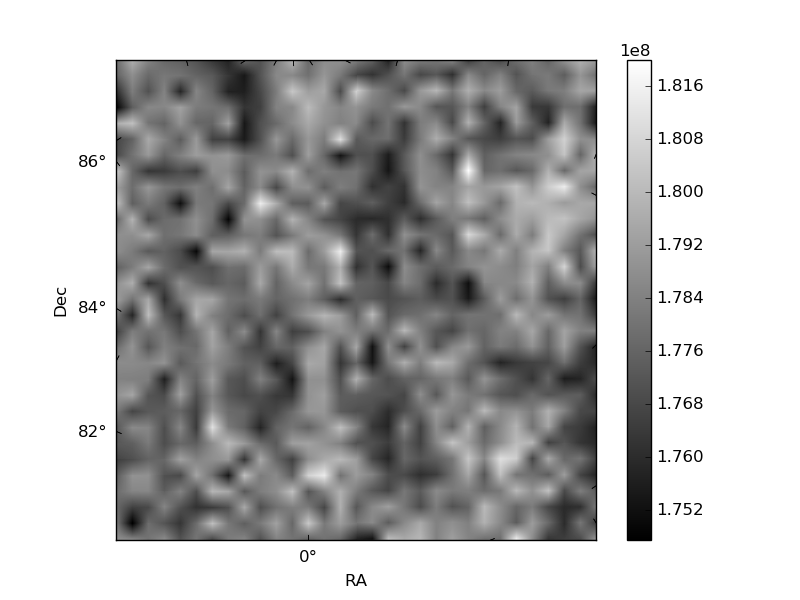
Histogram calculated using DETX and DETY for each event in the final _common_clean file
| Quadrant A | 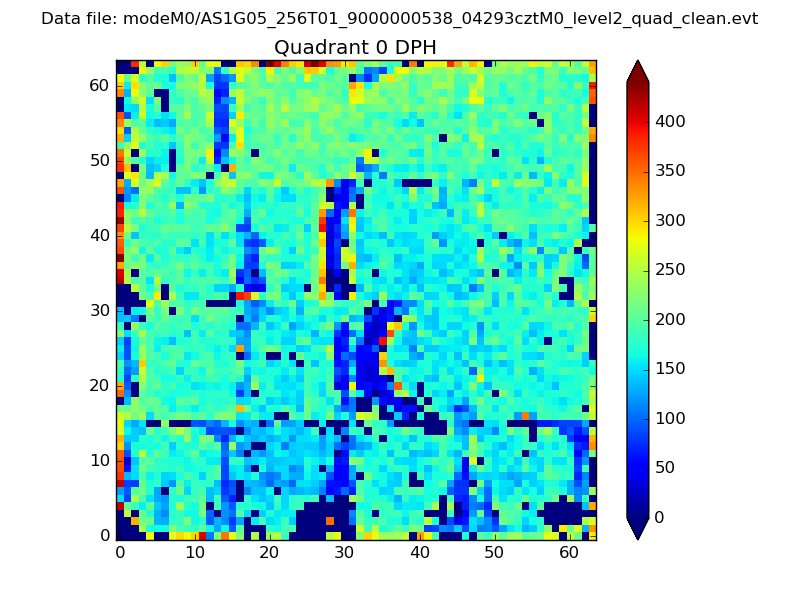 |
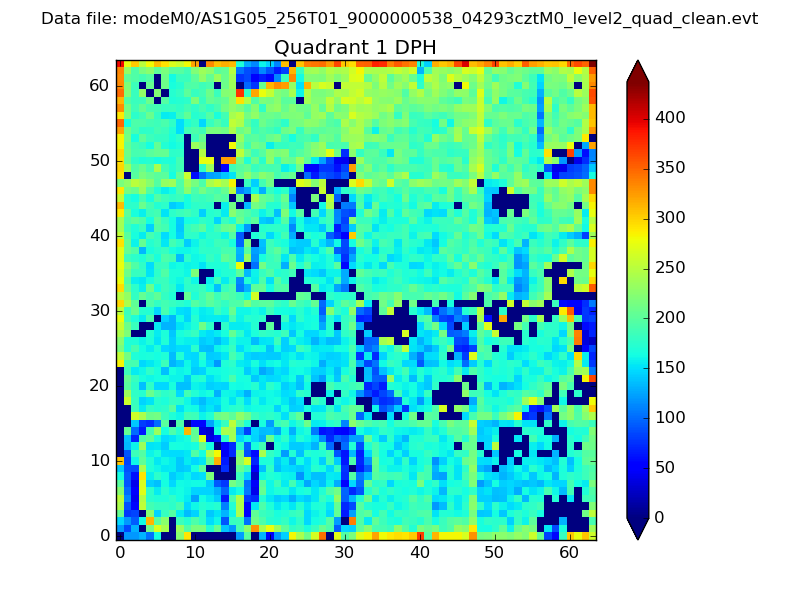 |
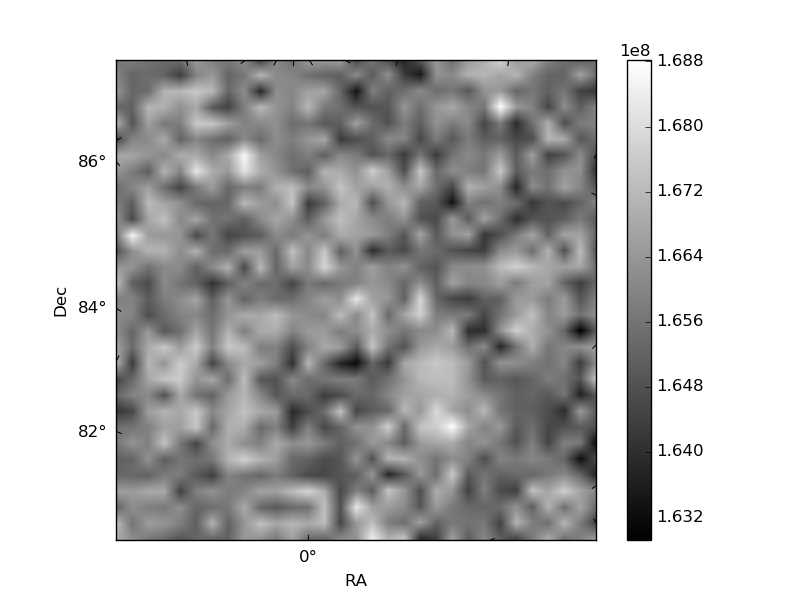
Quadrant B |
|---|---|---|---|
| Quadrant D | 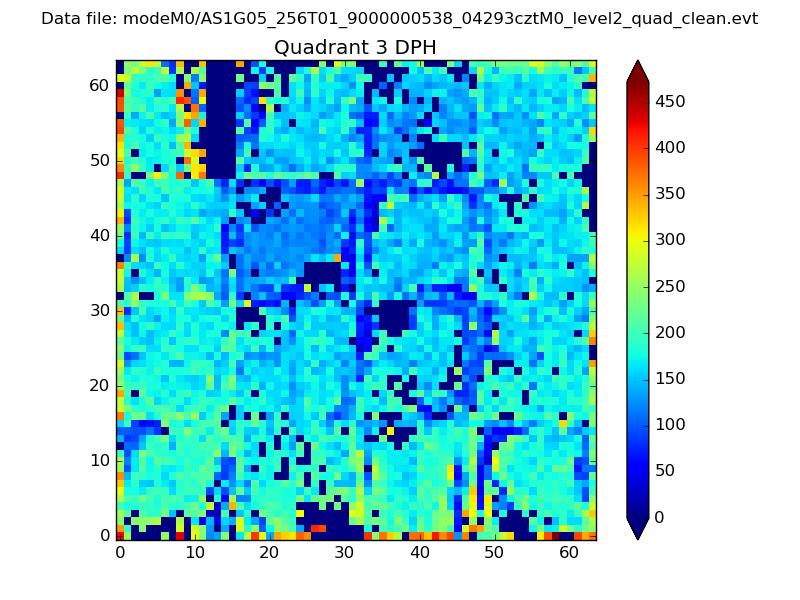 |
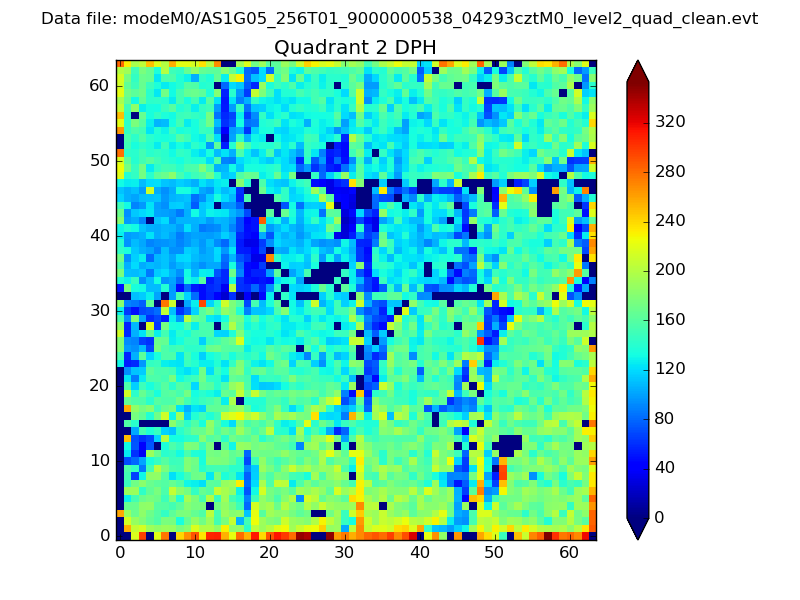 |
Quadrant C |
| Plot type | Count rate plots | Images |
|---|---|---|
| Comparison with Poisson distribution Blue bars denote a histogram of data divided into 1 sec bins. Red curve is a Poisson curve with rate = median count rate of data. |
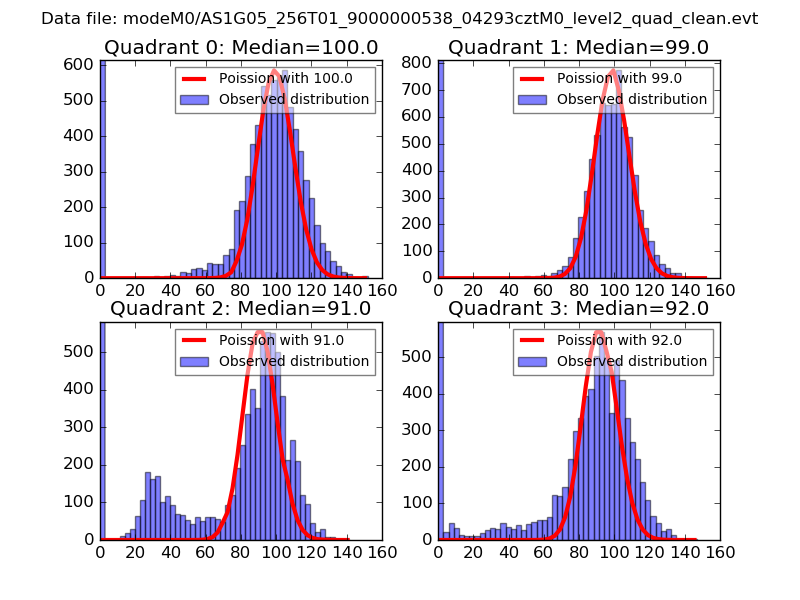 |
 |
| Quadrant-wise count rates Data is divided into 100 sec bins |
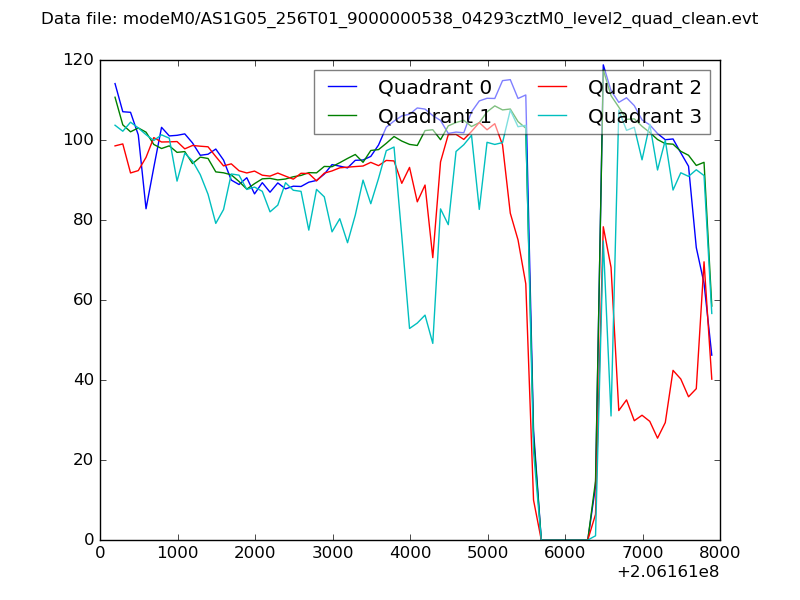 |
|
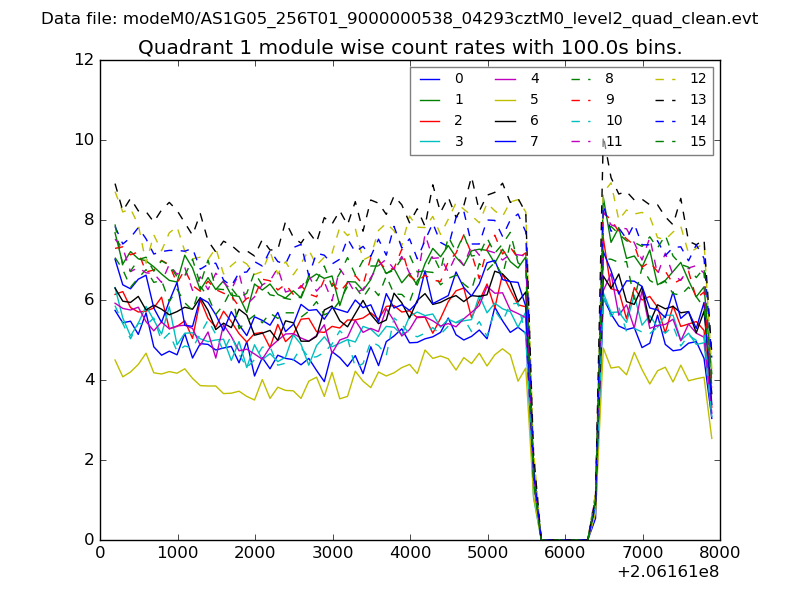
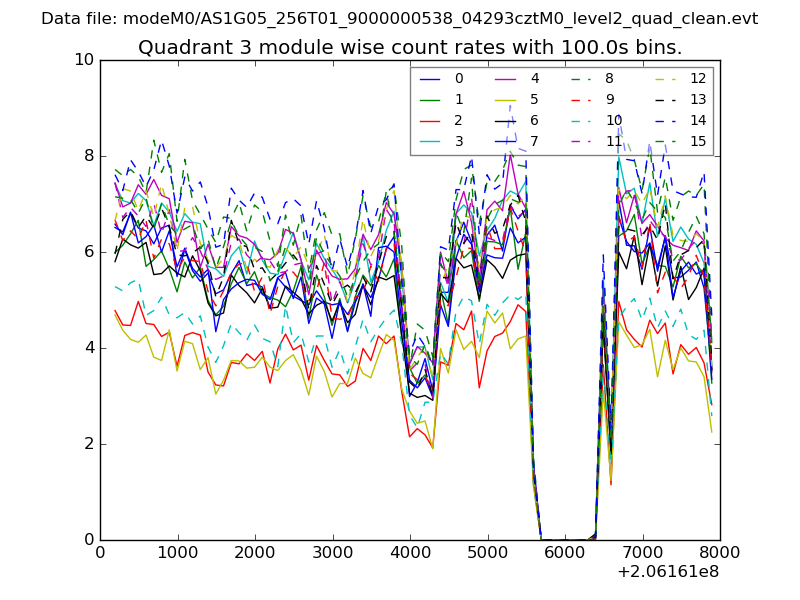
| Module-wise count rates for Quadrant A Data is divided into 100 sec bins |
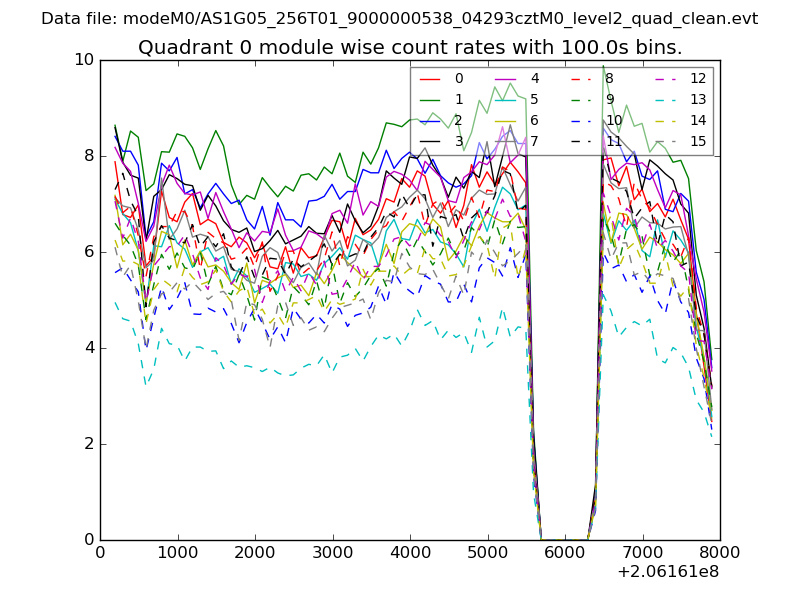 |
 |
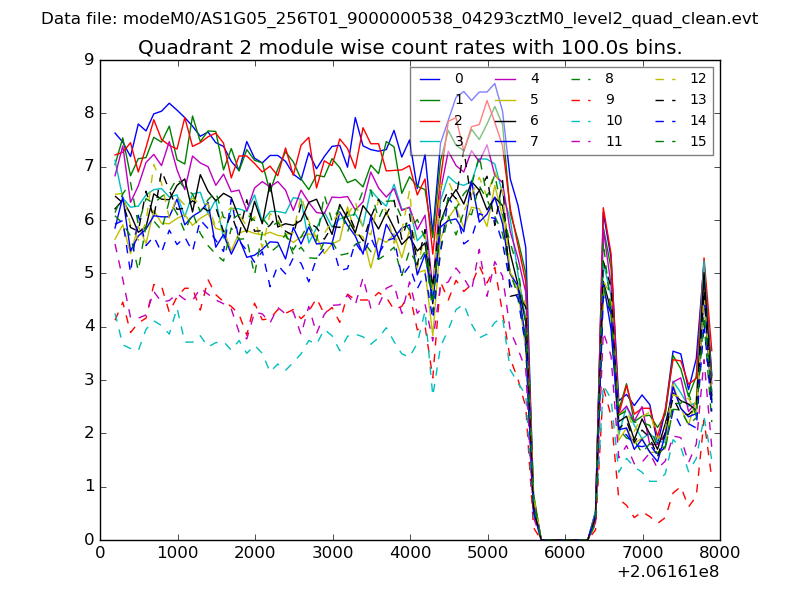
| Module-wise count rates for Quadrant B Data is divided into 100 sec bins |
 |
 |
| Module-wise count rates for Quadrant C Data is divided into 100 sec bins |
 |
 |
| Module-wise count rates for Quadrant D Data is divided into 100 sec bins |
 |
 |
| Parameter | Plot |
|---|---|
| CZT HV Monitor | 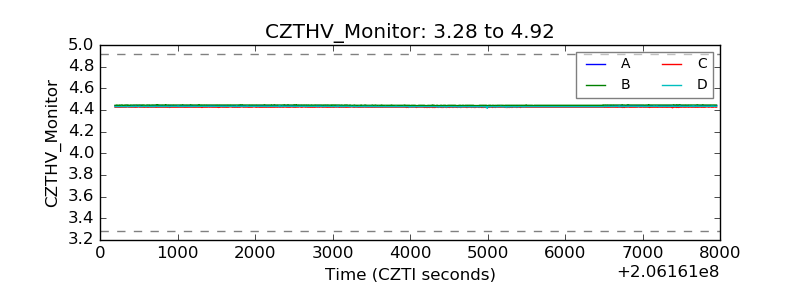 |
| D_VDD | 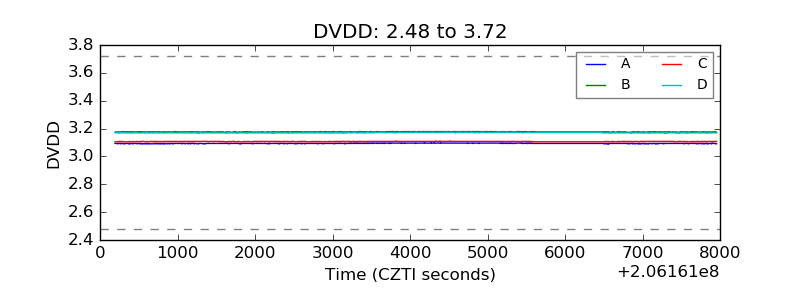 |
| Temperature 1 | 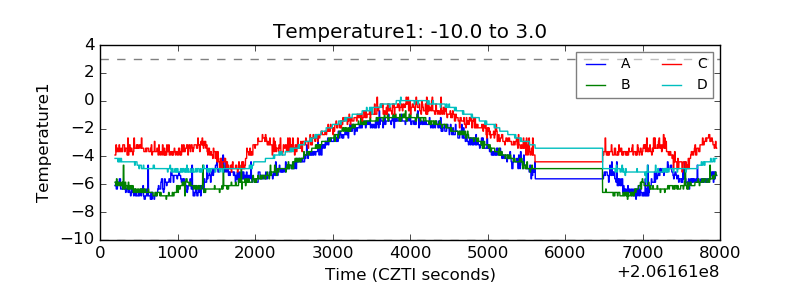 |
| Veto HV Monitor | 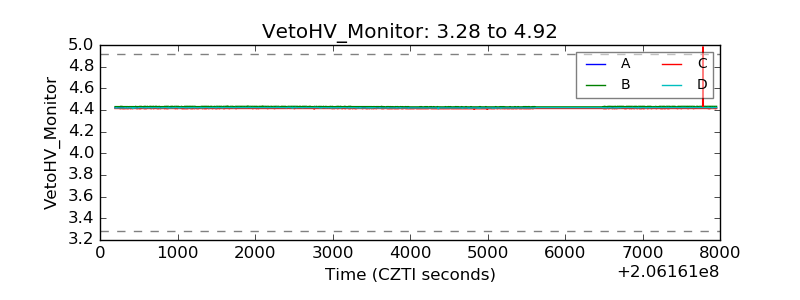 |
| Veto LLD | 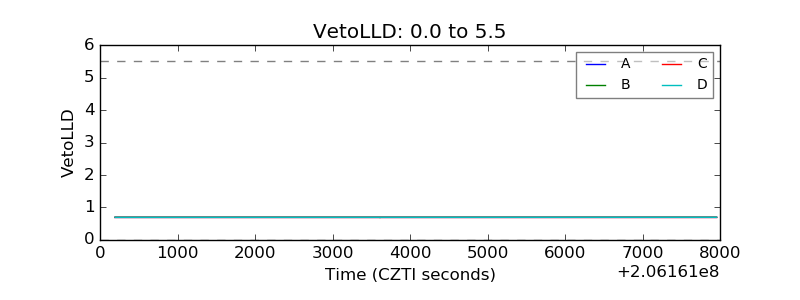 |
| Alpha Counter | 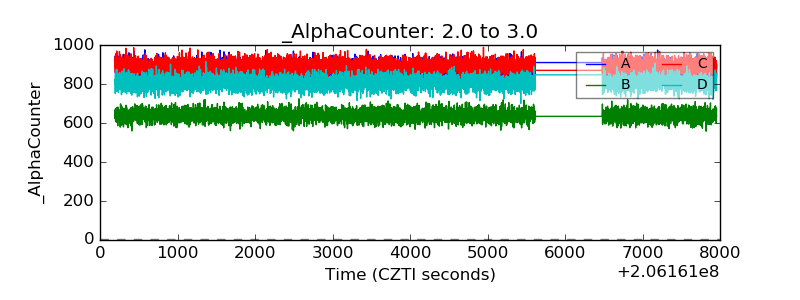 |
| _CPM_Rate | 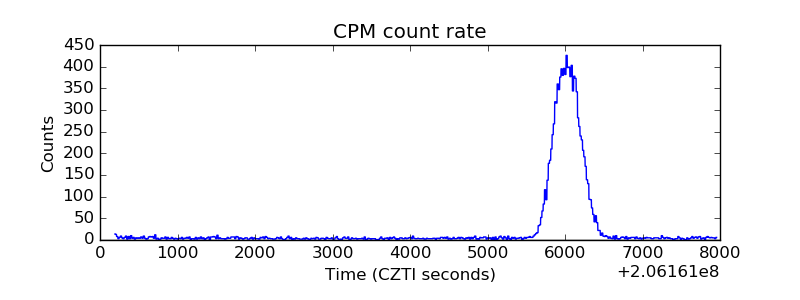 |
| CZT Counter | 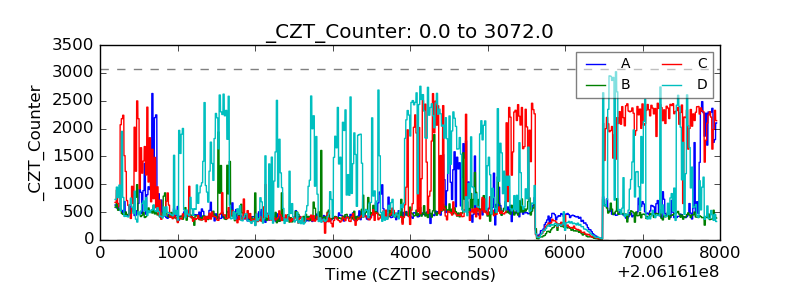 |
| +2.5 Volts monitor |  |
| +5 Volts monitor |  |
| _ROLL_ROT | 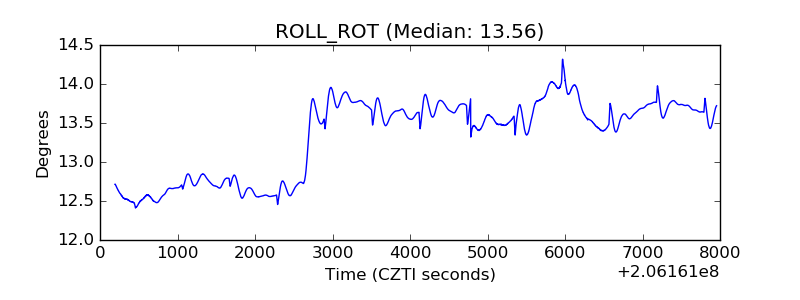 |
| _Roll_DEC | 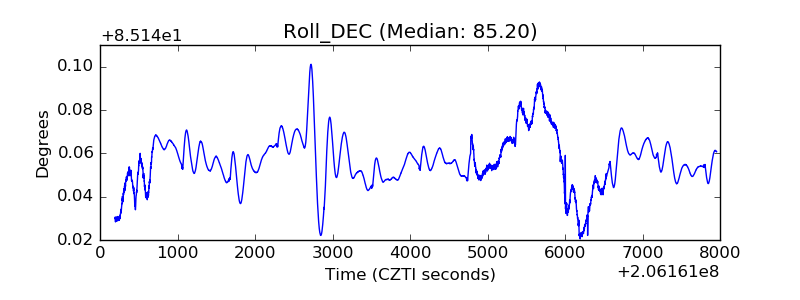 |
| _Roll_RA | 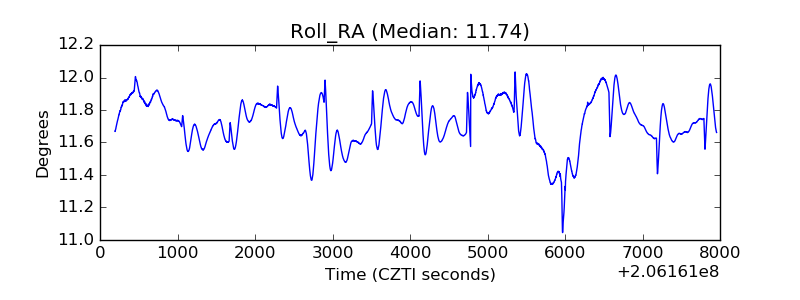 |
| Veto Counter | 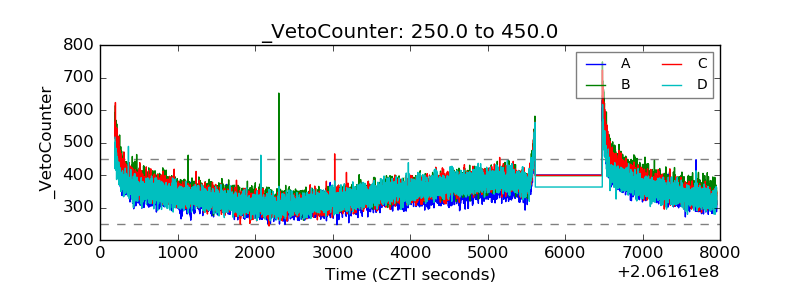 |