| Param | Original file | Final file |
|---|---|---|
| Filename | modeM0/AS1G05_256T01_9000000538_04294cztM0_level2.evt | modeM0/AS1G05_256T01_9000000538_04294cztM0_level2_quad_clean.evt |
| Size (bytes) | 862,833,600 | 88,413,120 |
| Size | 822.9 MB | 84.3 MB |
| Events in quadrant A | 4,885,541 | 629,926 |
| Events in quadrant B | 3,426,312 | 634,968 |
| Events in quadrant C | 12,724,826 | 351,214 |
| Events in quadrant D | 4,666,880 | 617,351 |
| Mode SS | |||
|---|---|---|---|
| Quadrant | BADHDUFLAG | Total packets | Discarded packets |
| A | 0 | 126 | 0 |
| B | 0 | 126 | 0 |
| C | 0 | 126 | 0 |
| D | 0 | 126 | 0 |
| Mode M0 | |||
|---|---|---|---|
| Quadrant | BADHDUFLAG | Total packets | Discarded packets |
| A | 0 | 18950 | 2 |
| B | 0 | 14647 | 1 |
| C | 0 | 42215 | 1 |
| D | 0 | 18364 | 1 |
| Mode M9 | |||
|---|---|---|---|
| Quadrant | BADHDUFLAG | Total packets | Discarded packets |
| A | 0 | 11 | 0 |
| B | 0 | 11 | 0 |
| C | 0 | 11 | 0 |
| D | 0 | 11 | 0 |
| Quadrant | Total seconds | Saturated seconds | Saturation percentage |
|---|---|---|---|
| A | 6329 | 682 | 10.775794% |
| B | 6329 | 166 | 2.622847% |
| C | 6329 | 5001 | 79.017222% |
| D | 6329 | 405 | 6.399115% |
Noise dominated data is calculated using 1-second bins in cleaned event files. If a bin has >2000 counts, and if more than 50% of those come from <1% of pixels, then it is considered to be noise-dominated and hence unusable.
| Quadrant | # 1 sec bins | Bins with >0 counts | Bins with >2000 counts | High rate bins dominated by noise | Noise dominated (total time) | Noise dominated (detector-on time) | Marked lightcurve |
|---|---|---|---|---|---|---|---|
| A | 7354 | 6329 | 550 | 550 | 7.48% | 8.69% | 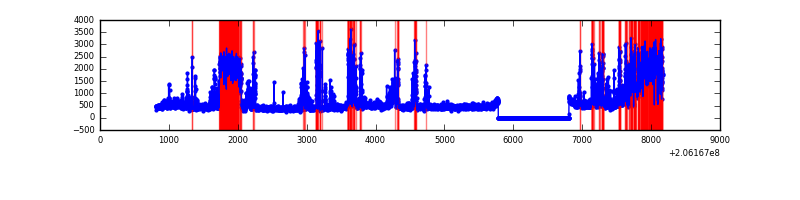 |
| B | 7354 | 6329 | 117 | 117 | 1.59% | 1.85% | 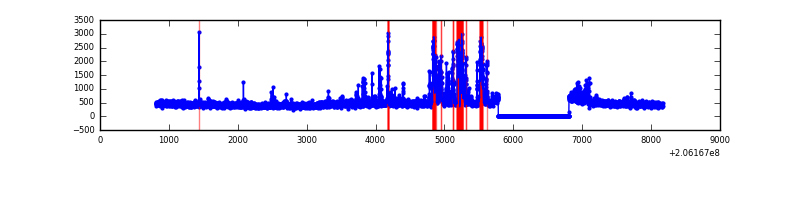 |
| C | 7353 | 6328 | 4547 | 4547 | 61.84% | 71.86% | 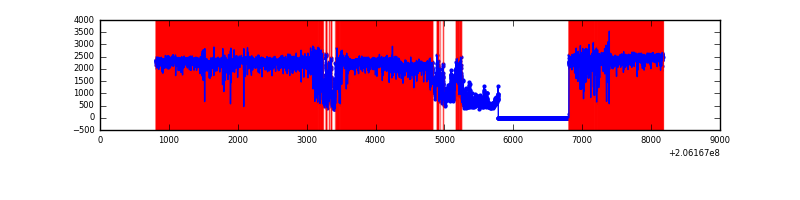 |
| D | 7354 | 6330 | 341 | 341 | 4.64% | 5.39% | 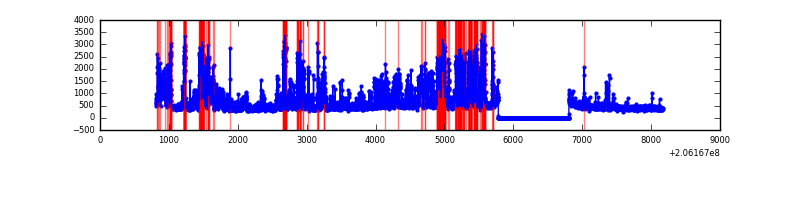 |
Top three noisy pixels from each quadrant. If the there are fewer than three noisy pixels in the level2.evt file, extra rows are filled as -1
| Pixel properties | Quadrant properties | ||||||
|---|---|---|---|---|---|---|---|
| Quadrant | DetID | PixID | Counts | Sigma | Mean | Median | Sigma |
| A | 0 | 199 | 1165014 | 8267.37 | 682 | 668 | 140.8 |
| A | 15 | 234 | 952423 | 6757.88 | 682 | 668 | 140.8 |
| A | 0 | 226 | 113442 | 800.74 | 682 | 668 | 140.8 |
| B | 14 | 167 | 636030 | 4748.41 | 698 | 681 | 133.8 |
| B | 15 | 85 | 14414 | 102.64 | 698 | 681 | 133.8 |
| B | 10 | 16 | 13895 | 98.76 | 698 | 681 | 133.8 |
| C | 9 | 144 | 11064113 | 117152.77 | 405 | 406 | 94.4 |
| C | 9 | 247 | 58884 | 619.22 | 405 | 406 | 94.4 |
| C | 10 | 65 | 6700 | 66.65 | 405 | 406 | 94.4 |
| D | 2 | 232 | 1715931 | 10733.69 | 662 | 643 | 159.8 |
| D | 2 | 136 | 113571 | 706.67 | 662 | 643 | 159.8 |
| D | 13 | 239 | 58905 | 364.58 | 662 | 643 | 159.8 |
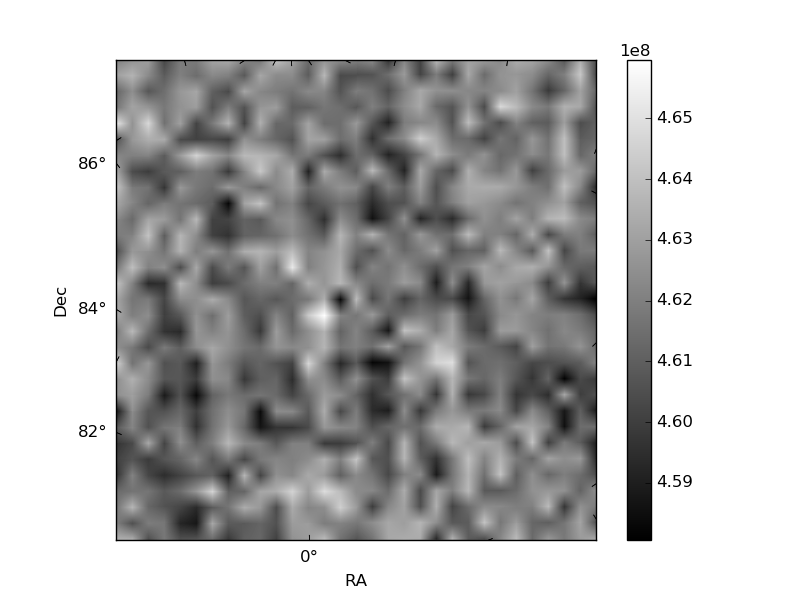
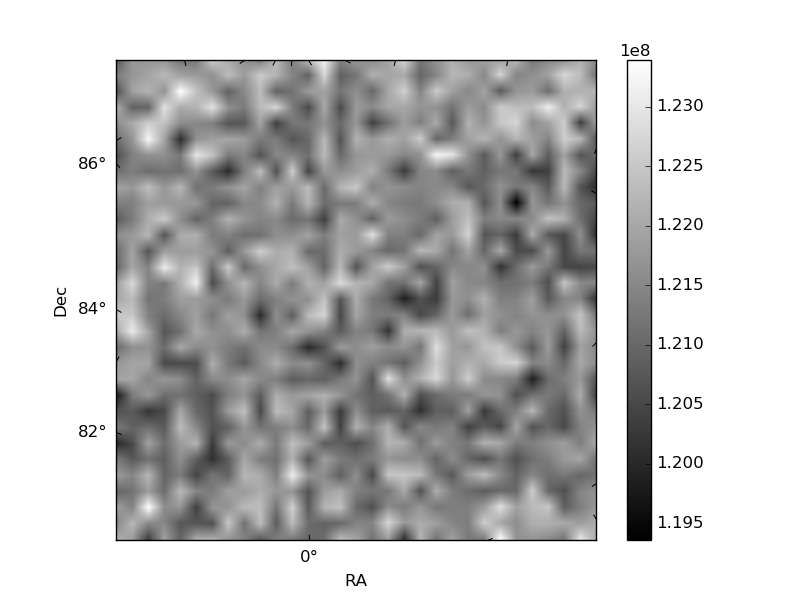
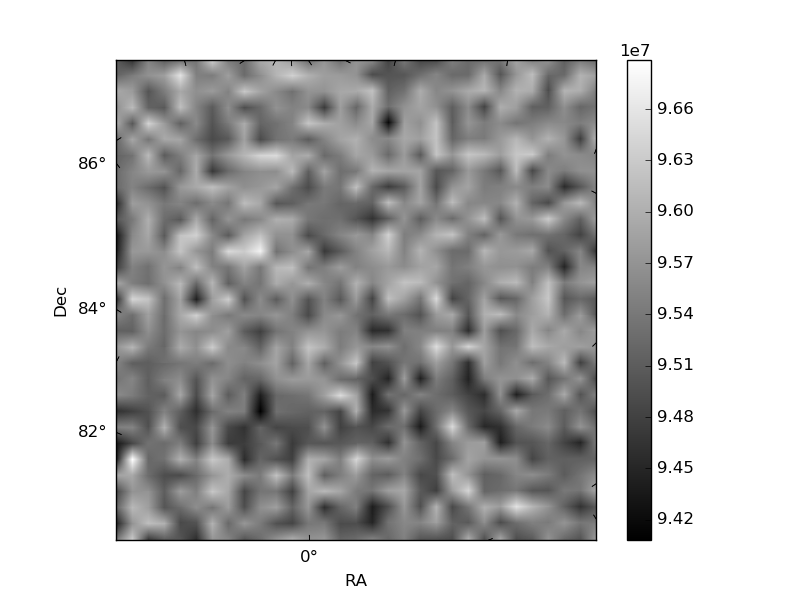
Histogram calculated using DETX and DETY for each event in the final _common_clean file
| Quadrant A | 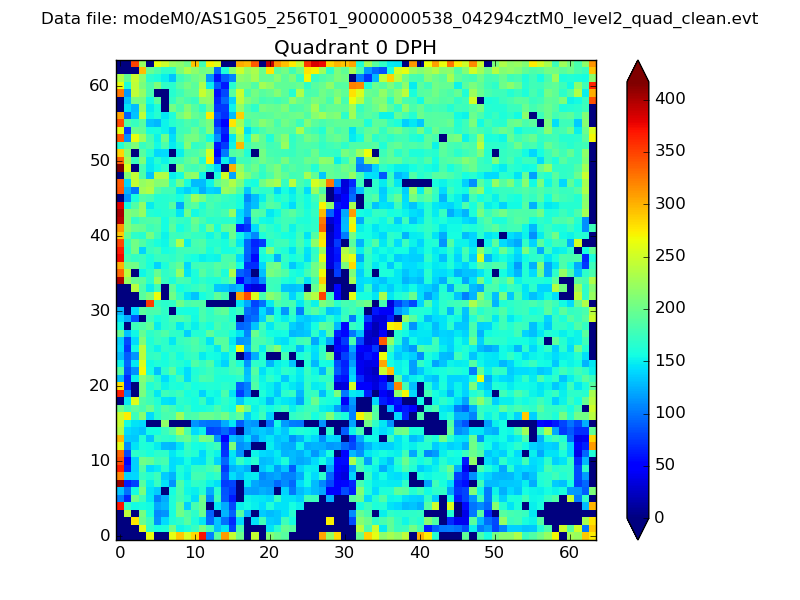 |
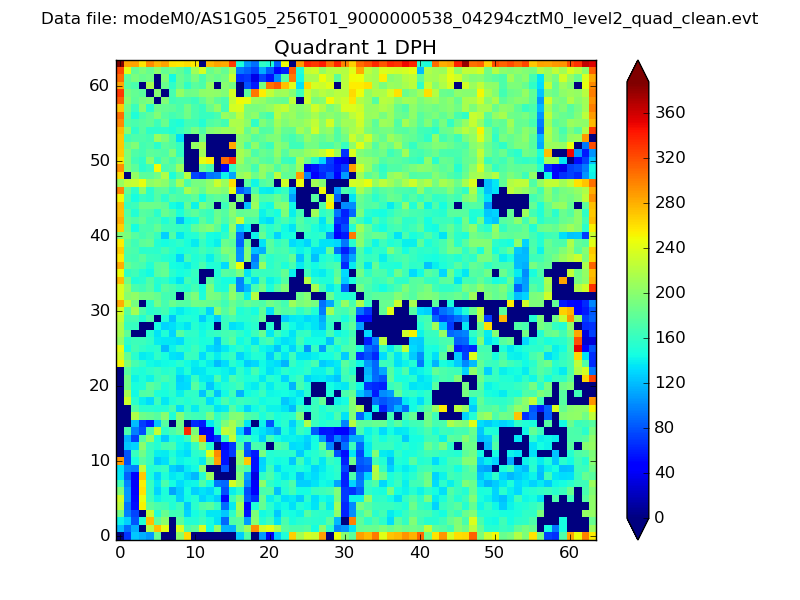 |
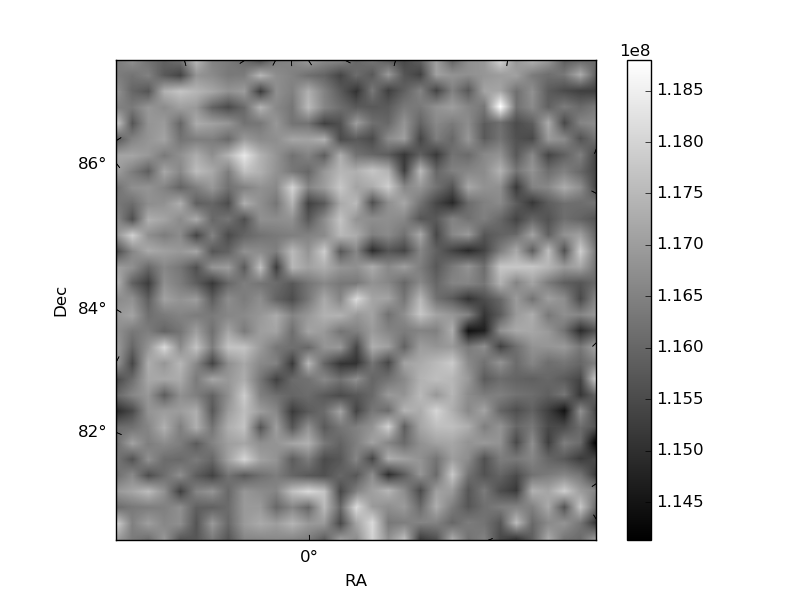
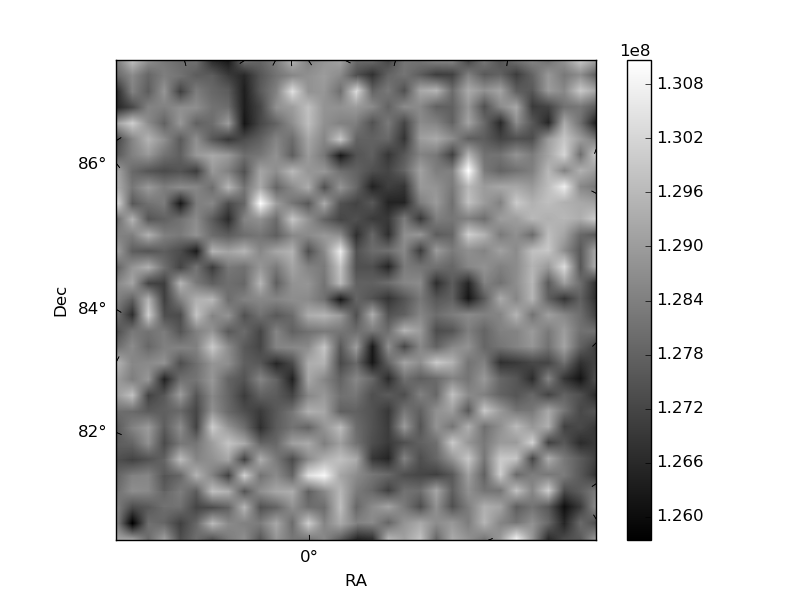
Quadrant B |
|---|---|---|---|
| Quadrant D | 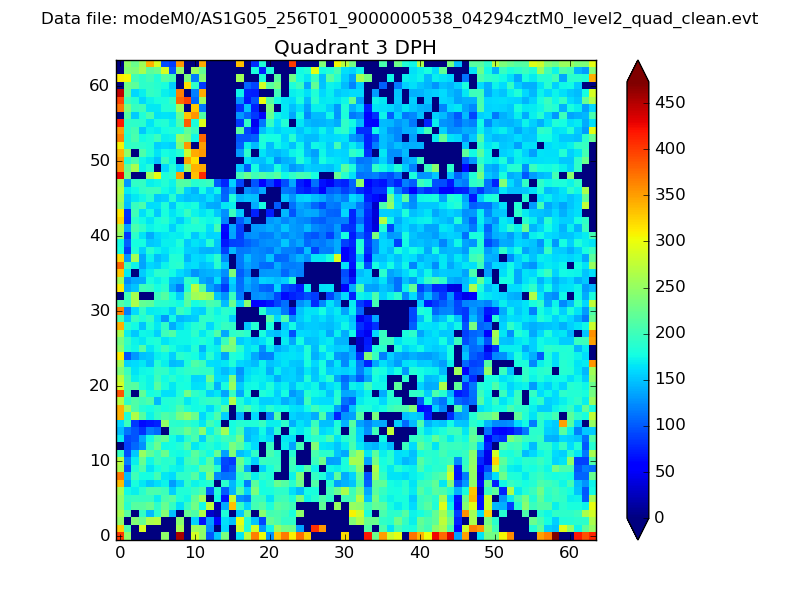 |
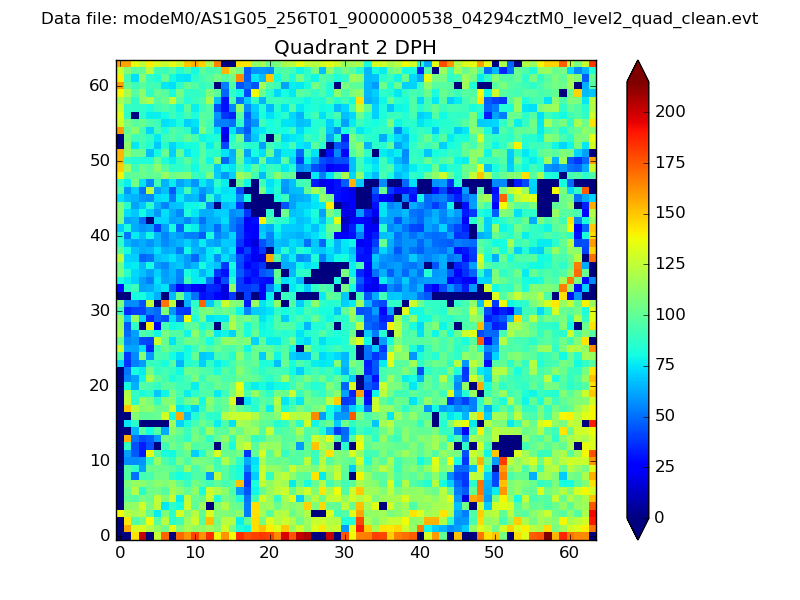 |
Quadrant C |
| Plot type | Count rate plots | Images |
|---|---|---|
| Comparison with Poisson distribution Blue bars denote a histogram of data divided into 1 sec bins. Red curve is a Poisson curve with rate = median count rate of data. |
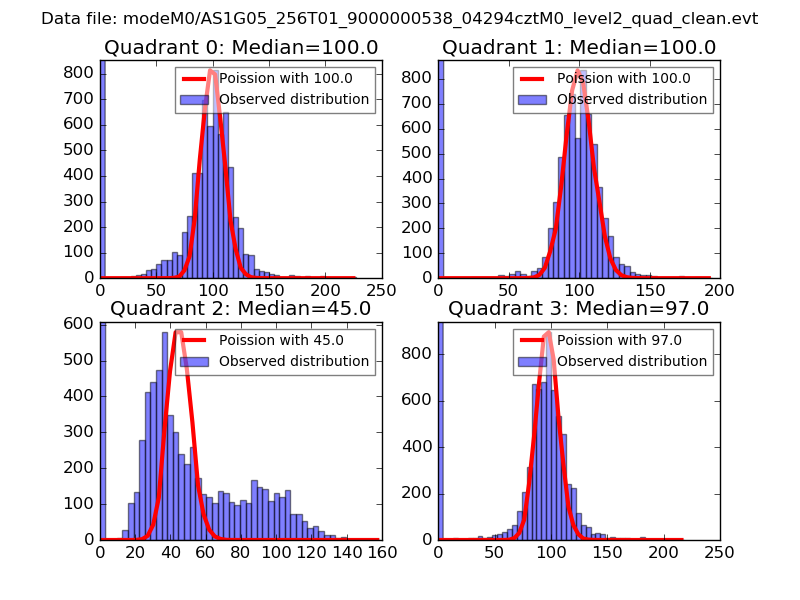 |
 |
| Quadrant-wise count rates Data is divided into 100 sec bins |
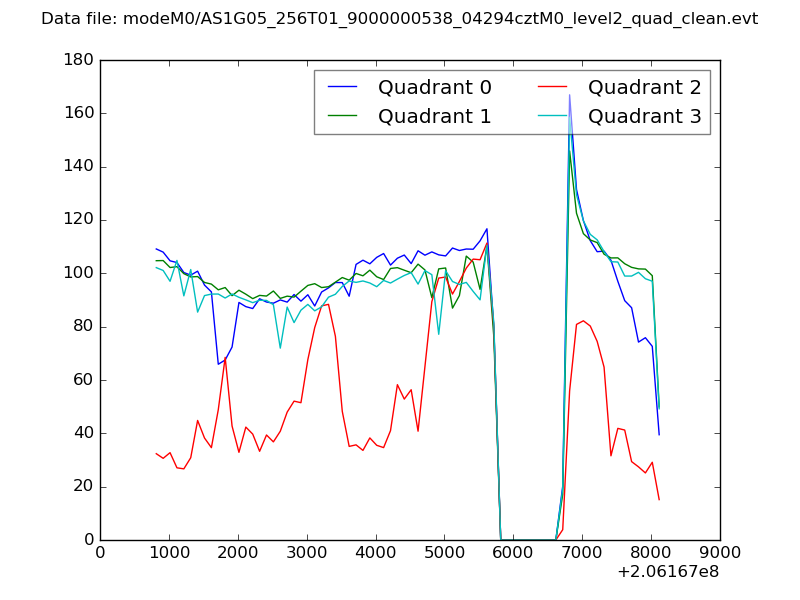 |
|
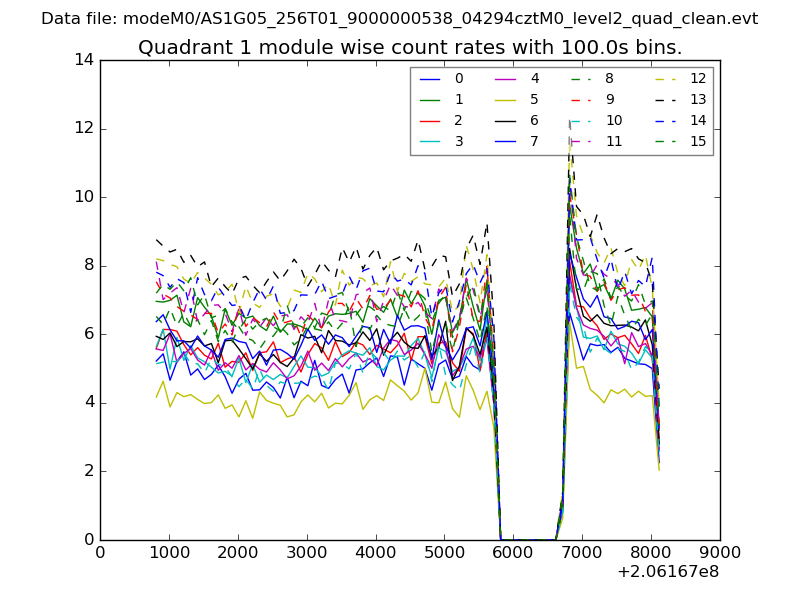
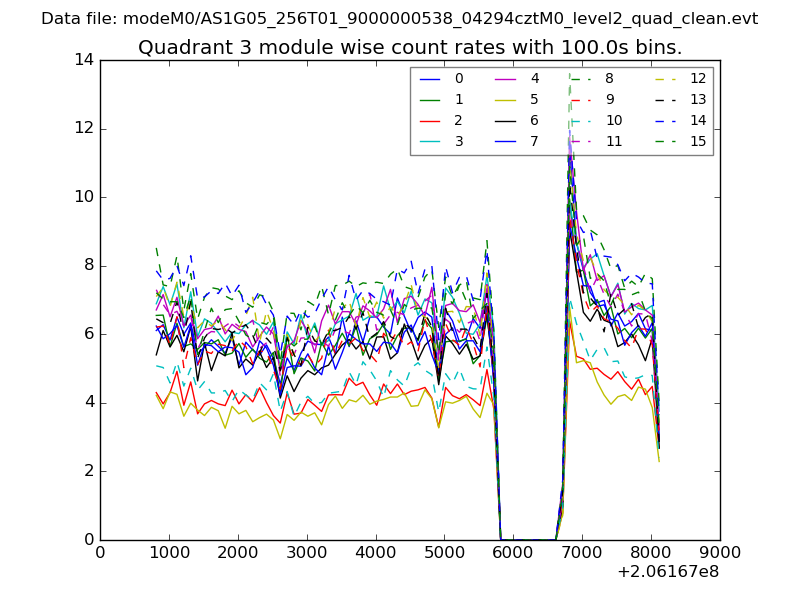
| Module-wise count rates for Quadrant A Data is divided into 100 sec bins |
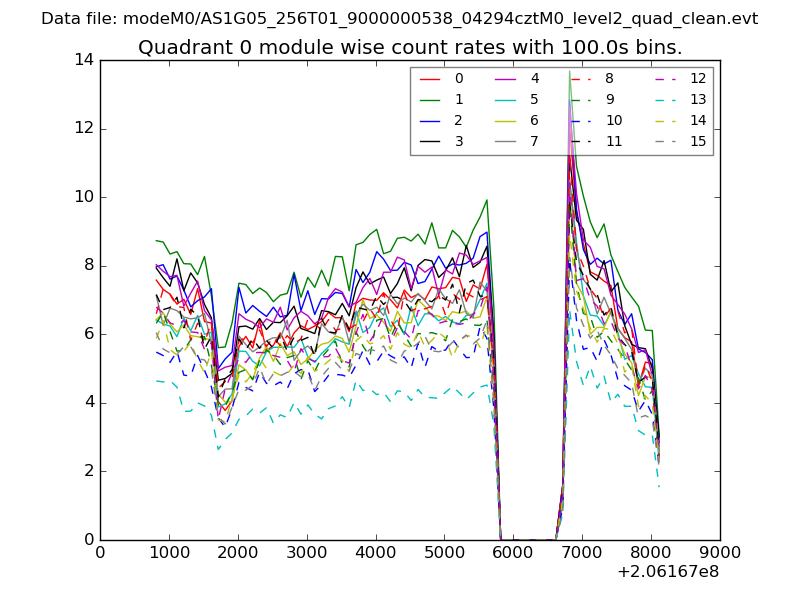 |
 |
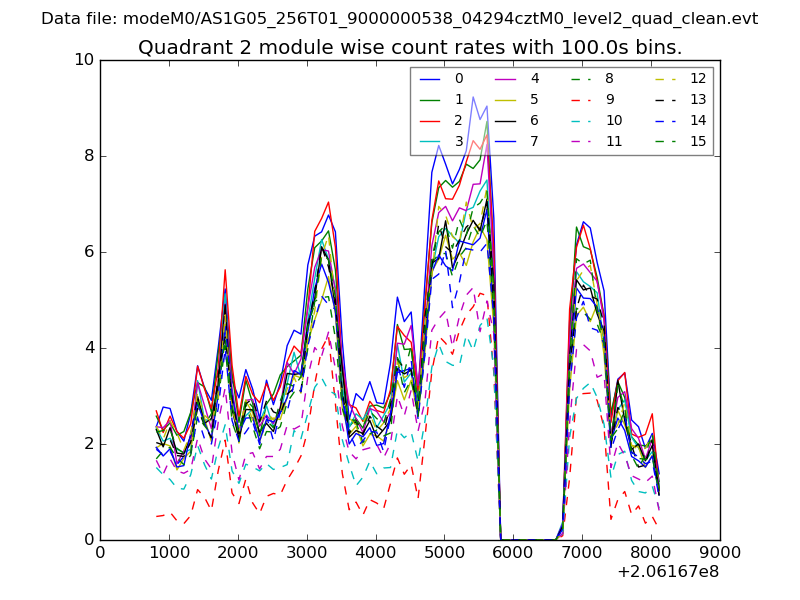
| Module-wise count rates for Quadrant B Data is divided into 100 sec bins |
 |
 |
| Module-wise count rates for Quadrant C Data is divided into 100 sec bins |
 |
 |
| Module-wise count rates for Quadrant D Data is divided into 100 sec bins |
 |
 |
| Parameter | Plot |
|---|---|
| CZT HV Monitor | 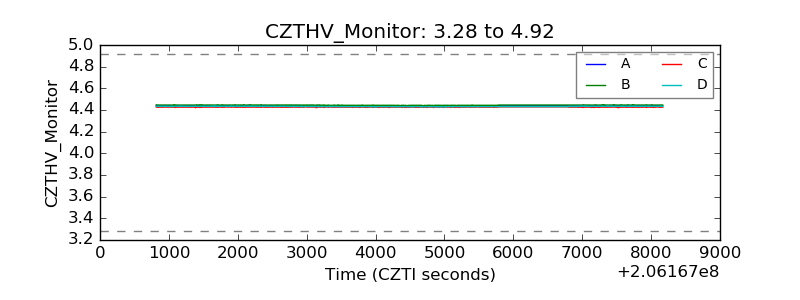 |
| D_VDD | 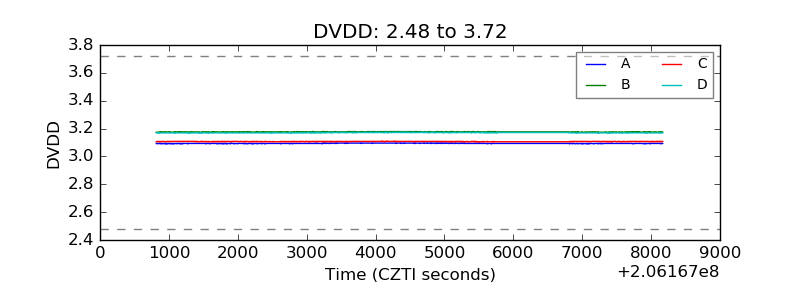 |
| Temperature 1 | 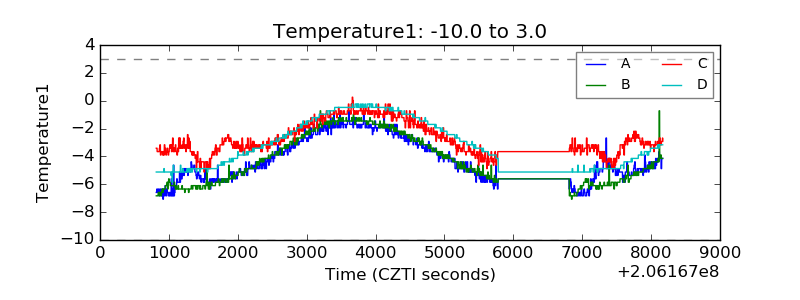 |
| Veto HV Monitor | 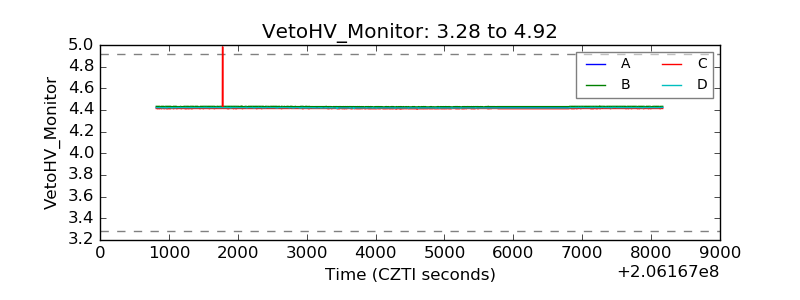 |
| Veto LLD | 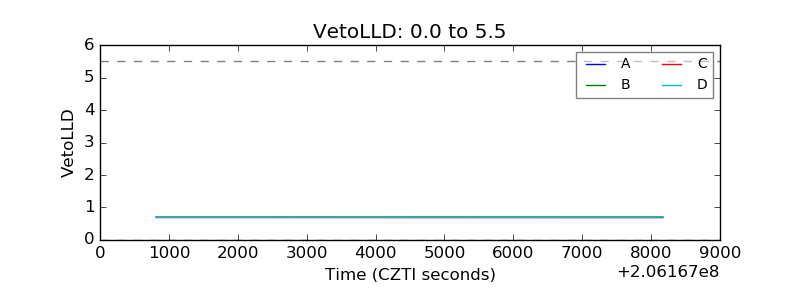 |
| Alpha Counter | 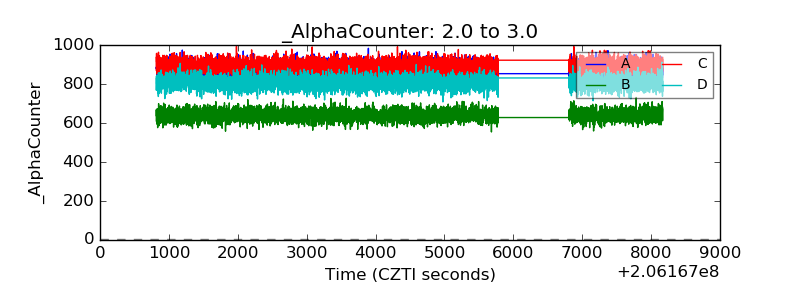 |
| _CPM_Rate | 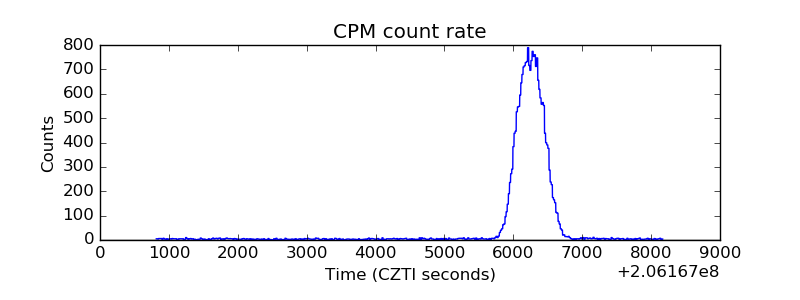 |
| CZT Counter | 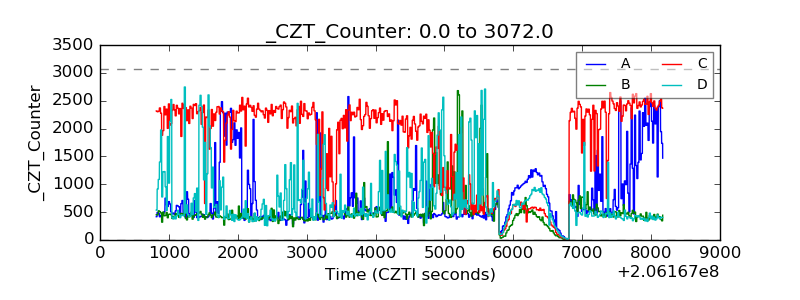 |
| +2.5 Volts monitor | 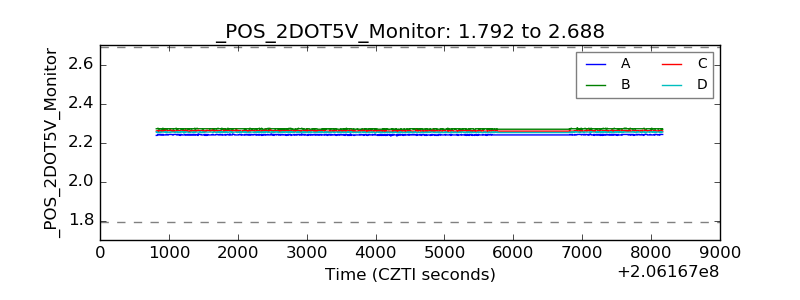 |
| +5 Volts monitor |  |
| _ROLL_ROT | 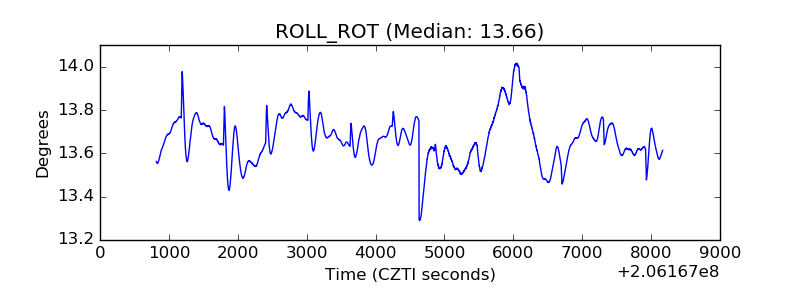 |
| _Roll_DEC | 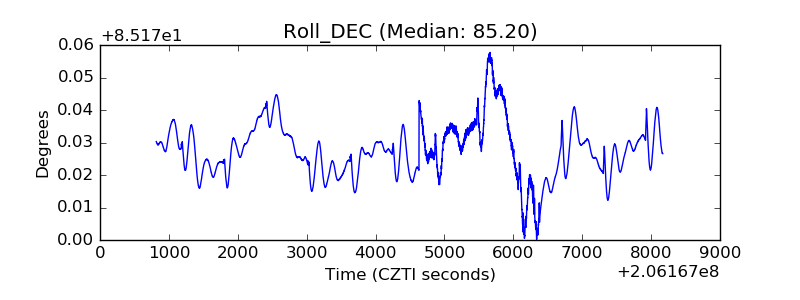 |
| _Roll_RA | 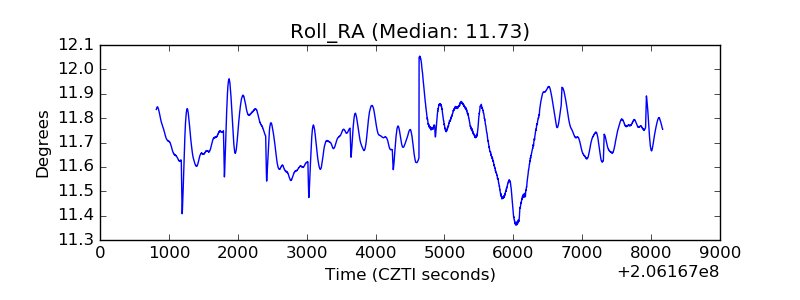 |
| Veto Counter | 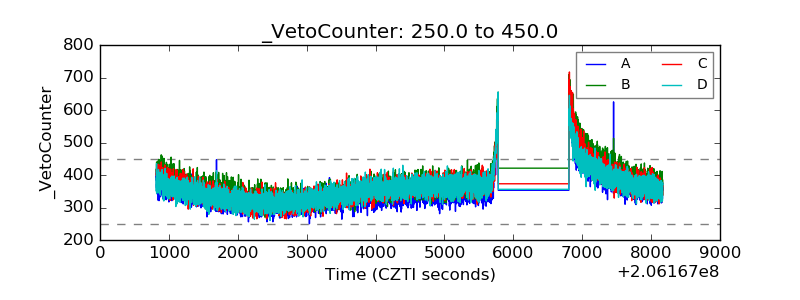 |