| Param | Original file | Final file |
|---|---|---|
| Filename | modeM0/AS1G05_256T01_9000000538_04296cztM0_level2.evt | modeM0/AS1G05_256T01_9000000538_04296cztM0_level2_quad_clean.evt |
| Size (bytes) | 846,106,560 | 84,611,520 |
| Size | 806.9 MB | 80.7 MB |
| Events in quadrant A | 3,810,062 | 616,438 |
| Events in quadrant B | 3,771,717 | 608,035 |
| Events in quadrant C | 12,652,027 | 357,790 |
| Events in quadrant D | 4,990,909 | 563,683 |
| Mode SS | |||
|---|---|---|---|
| Quadrant | BADHDUFLAG | Total packets | Discarded packets |
| A | 0 | 122 | 0 |
| B | 0 | 122 | 0 |
| C | 0 | 122 | 0 |
| D | 0 | 122 | 0 |
| Mode M0 | |||
|---|---|---|---|
| Quadrant | BADHDUFLAG | Total packets | Discarded packets |
| A | 0 | 15454 | 2 |
| B | 0 | 15243 | 1 |
| C | 0 | 41559 | 1 |
| D | 0 | 19090 | 1 |
| Mode M9 | |||
|---|---|---|---|
| Quadrant | BADHDUFLAG | Total packets | Discarded packets |
| A | 0 | 11 | 0 |
| B | 0 | 11 | 0 |
| C | 0 | 11 | 0 |
| D | 0 | 11 | 0 |
| Quadrant | Total seconds | Saturated seconds | Saturation percentage |
|---|---|---|---|
| A | 5910 | 350 | 5.922166% |
| B | 5910 | 306 | 5.177665% |
| C | 5910 | 4685 | 79.272420% |
| D | 5910 | 795 | 13.451777% |
Noise dominated data is calculated using 1-second bins in cleaned event files. If a bin has >2000 counts, and if more than 50% of those come from <1% of pixels, then it is considered to be noise-dominated and hence unusable.
| Quadrant | # 1 sec bins | Bins with >0 counts | Bins with >2000 counts | High rate bins dominated by noise | Noise dominated (total time) | Noise dominated (detector-on time) | Marked lightcurve |
|---|---|---|---|---|---|---|---|
| A | 7065 | 5910 | 277 | 277 | 3.92% | 4.69% | 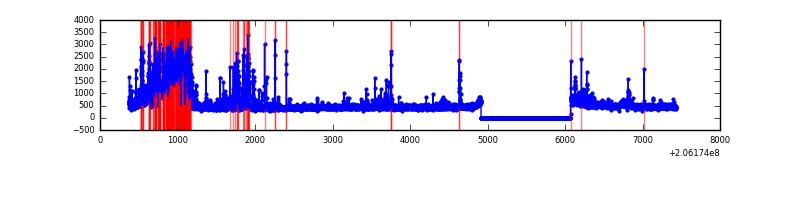 |
| B | 7065 | 5910 | 229 | 229 | 3.24% | 3.87% |  |
| C | 7064 | 5910 | 4433 | 4433 | 62.75% | 75.01% | 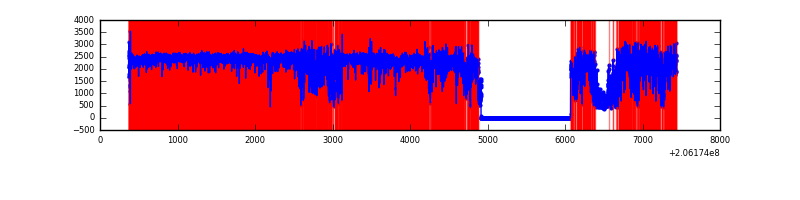 |
| D | 7065 | 5911 | 722 | 722 | 10.22% | 12.21% |  |
Top three noisy pixels from each quadrant. If the there are fewer than three noisy pixels in the level2.evt file, extra rows are filled as -1
| Pixel properties | Quadrant properties | ||||||
|---|---|---|---|---|---|---|---|
| Quadrant | DetID | PixID | Counts | Sigma | Mean | Median | Sigma |
| A | 15 | 234 | 766324 | 5780.53 | 656 | 643 | 132.5 |
| A | 0 | 199 | 386132 | 2910.26 | 656 | 643 | 132.5 |
| A | 8 | 15 | 44841 | 333.67 | 656 | 643 | 132.5 |
| B | 14 | 167 | 942225 | 7570.73 | 655 | 639 | 124.4 |
| B | 10 | 16 | 145175 | 1162.13 | 655 | 639 | 124.4 |
| B | 15 | 204 | 76522 | 610.13 | 655 | 639 | 124.4 |
| C | 9 | 144 | 11056272 | 116445.23 | 407 | 407 | 94.9 |
| C | 9 | 247 | 3394 | 31.46 | 407 | 407 | 94.9 |
| C | 13 | 61 | 3276 | 30.22 | 407 | 407 | 94.9 |
| D | 2 | 232 | 2391098 | 16446.28 | 604 | 588 | 145.4 |
| D | 13 | 239 | 74550 | 508.85 | 604 | 588 | 145.4 |
| D | 2 | 136 | 48223 | 327.72 | 604 | 588 | 145.4 |
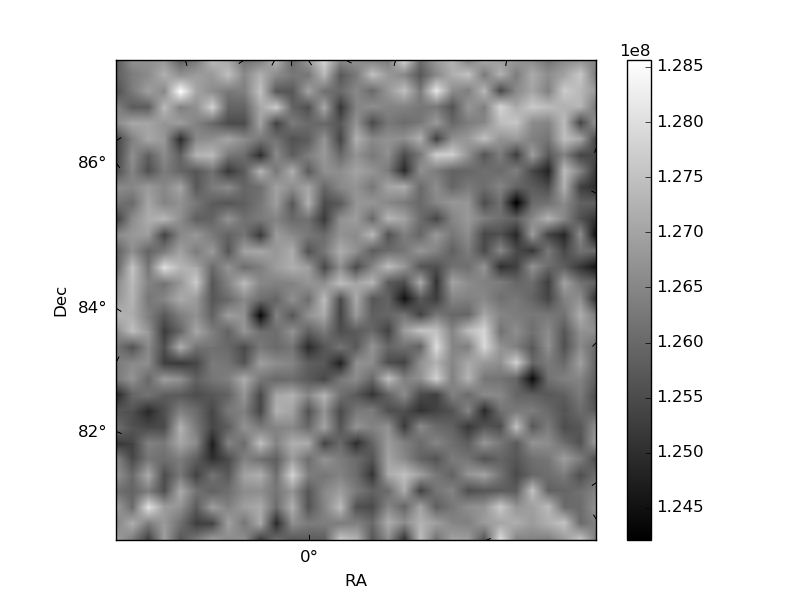
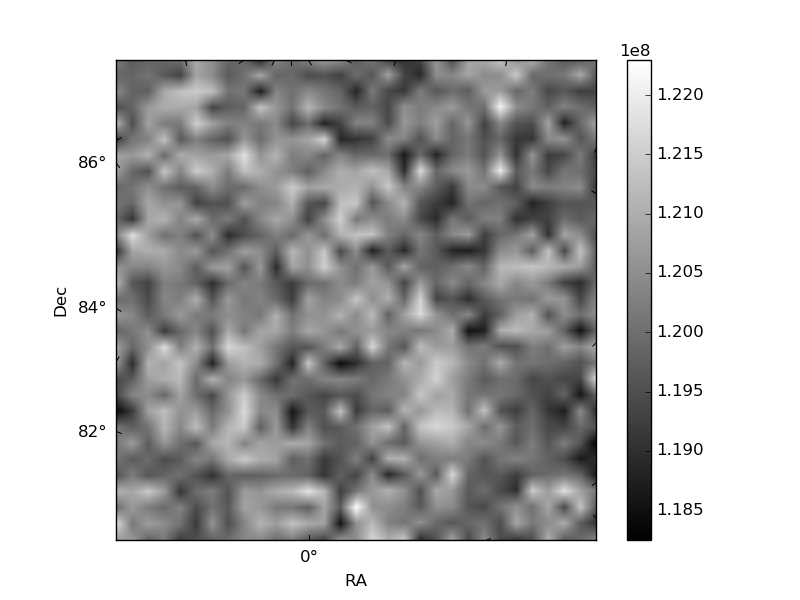
Histogram calculated using DETX and DETY for each event in the final _common_clean file
| Quadrant A | 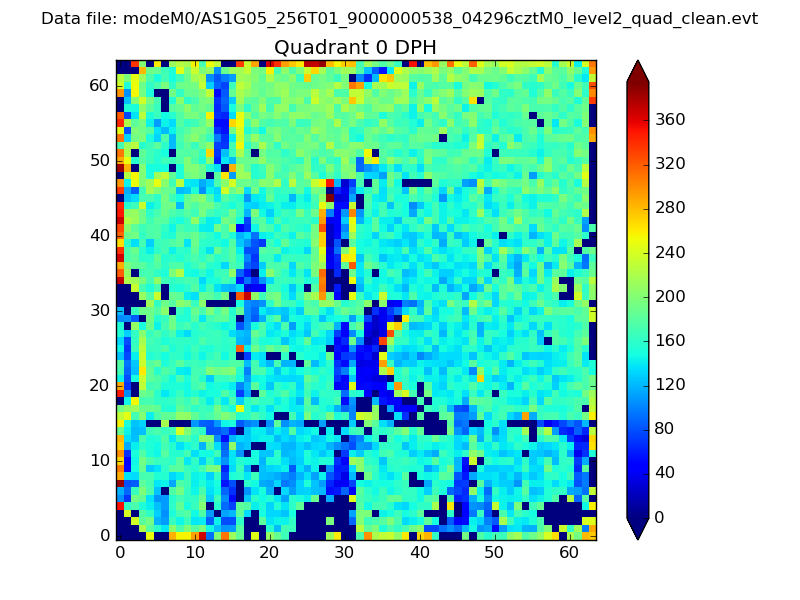 |
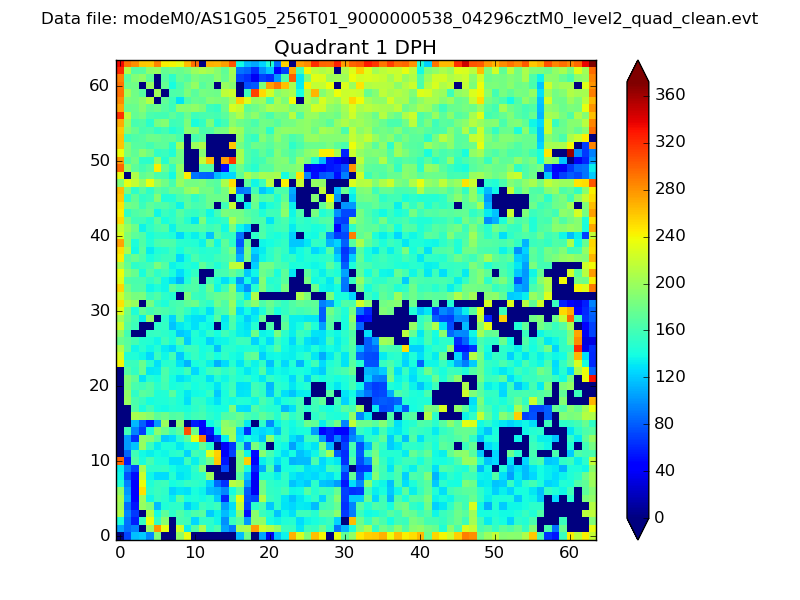 |
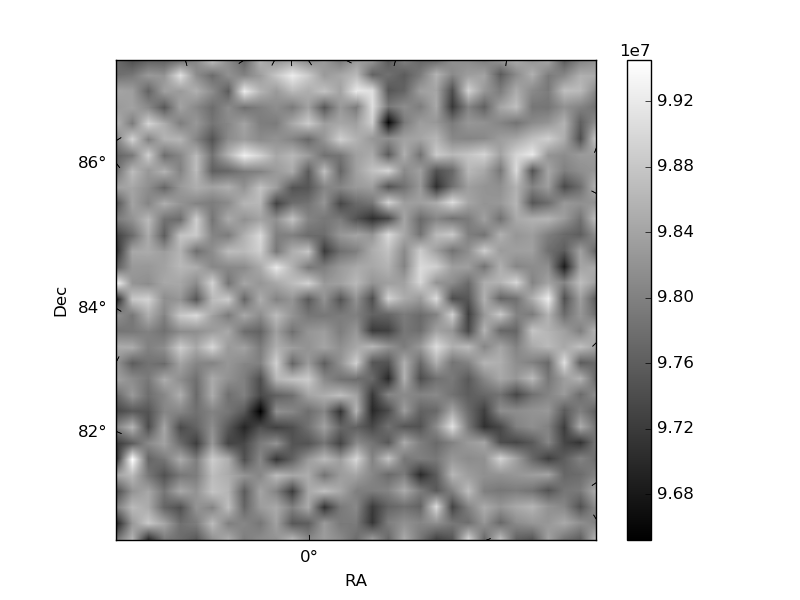
Quadrant B |
|---|---|---|---|
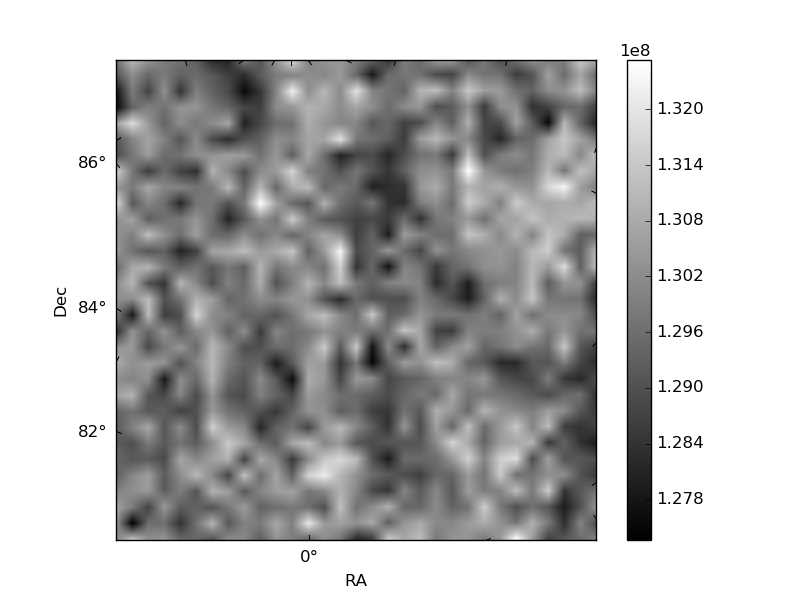
| Quadrant D |  |
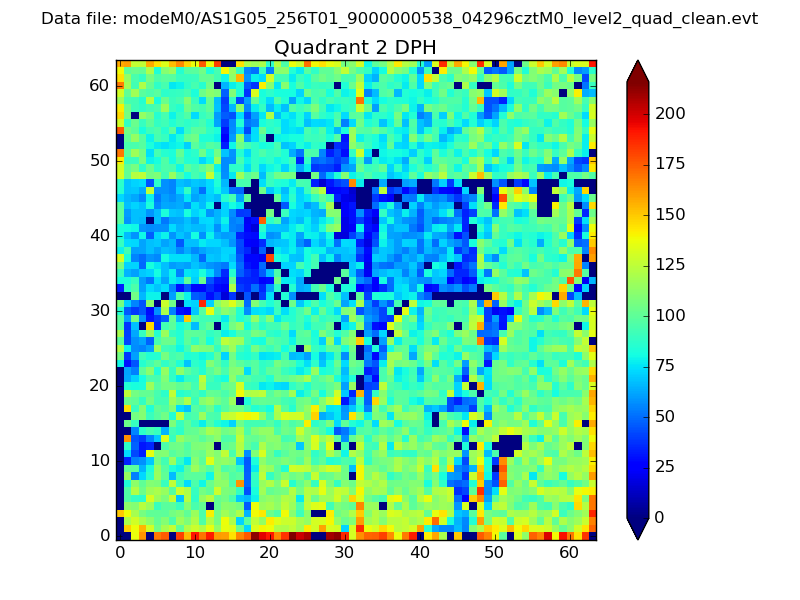 |
Quadrant C |
| Plot type | Count rate plots | Images |
|---|---|---|
| Comparison with Poisson distribution Blue bars denote a histogram of data divided into 1 sec bins. Red curve is a Poisson curve with rate = median count rate of data. |
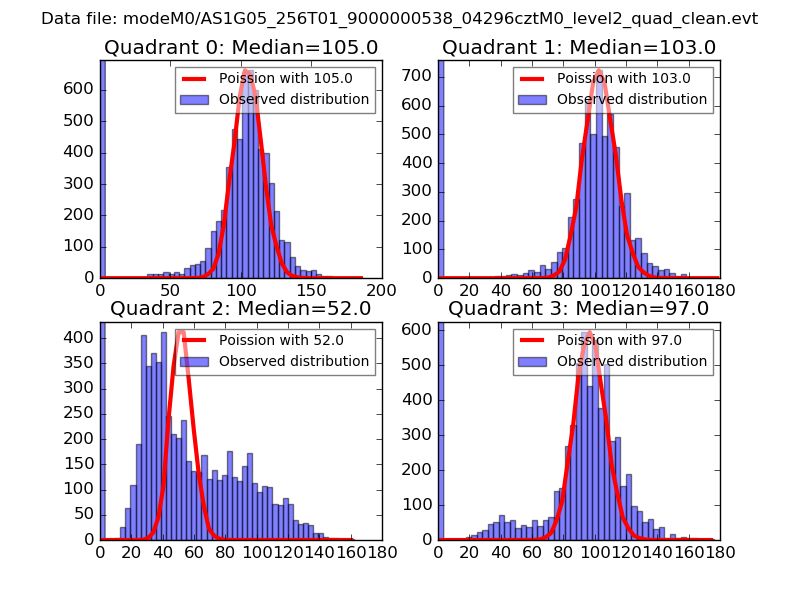 |
 |
| Quadrant-wise count rates Data is divided into 100 sec bins |
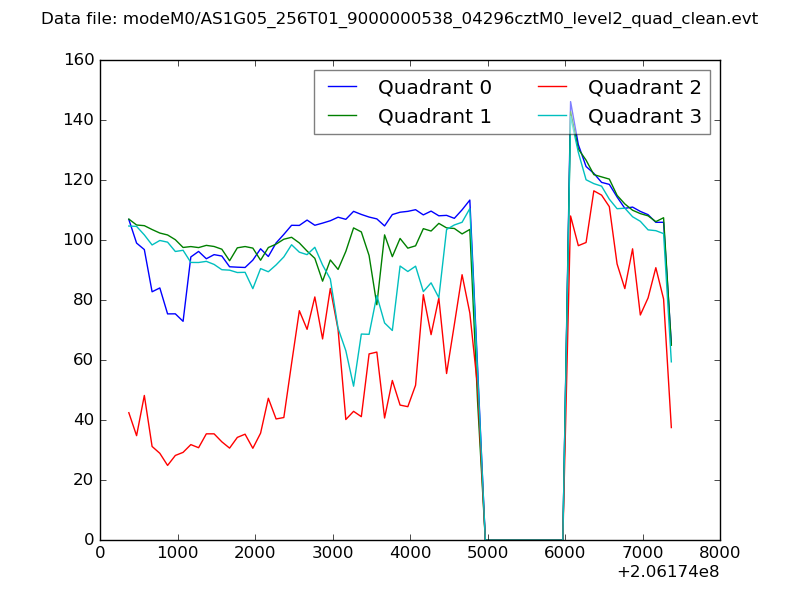 |
|
| Module-wise count rates for Quadrant A Data is divided into 100 sec bins |
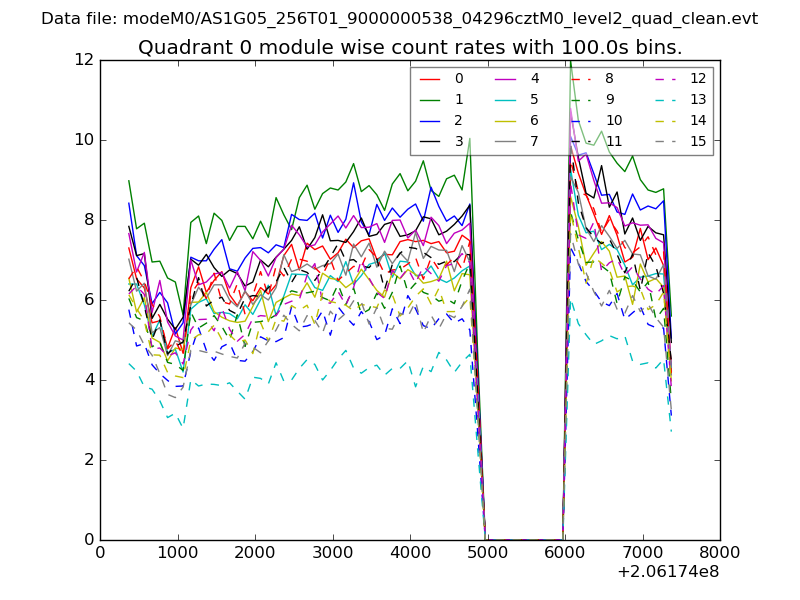 |
 |
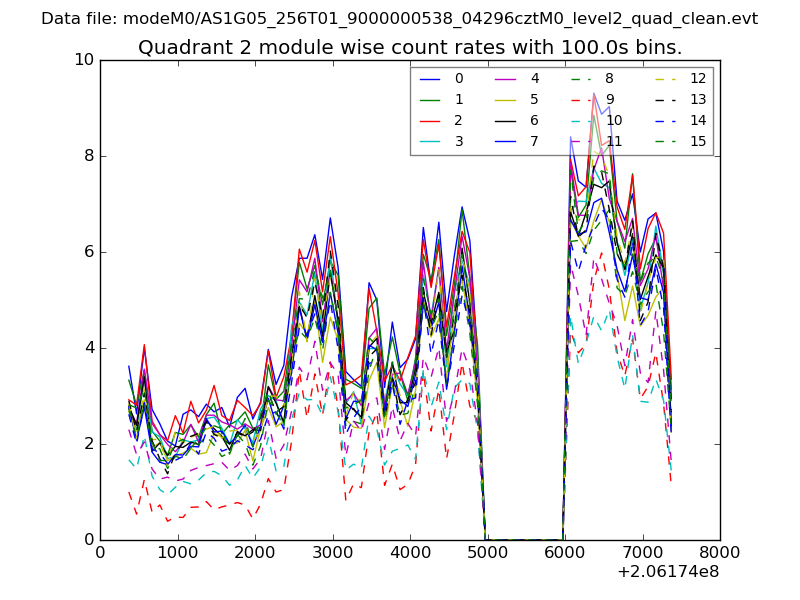
| Module-wise count rates for Quadrant B Data is divided into 100 sec bins |
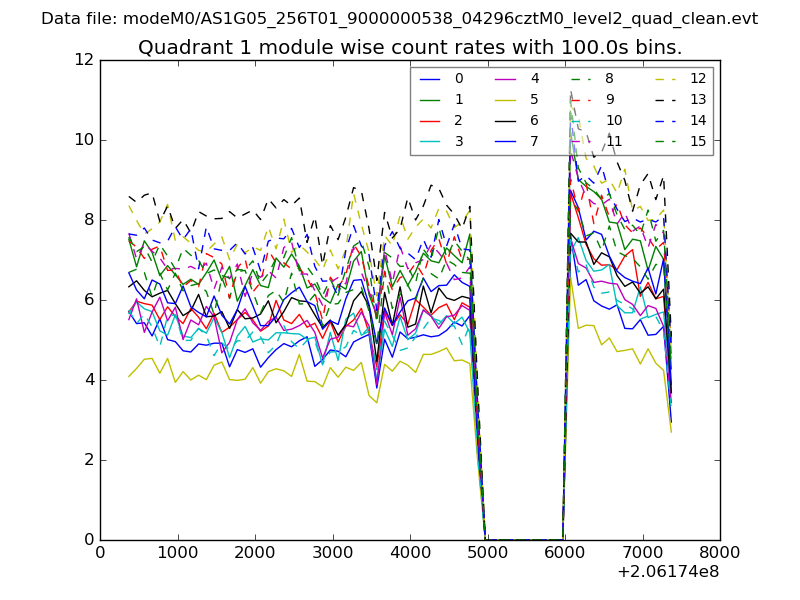 |
 |
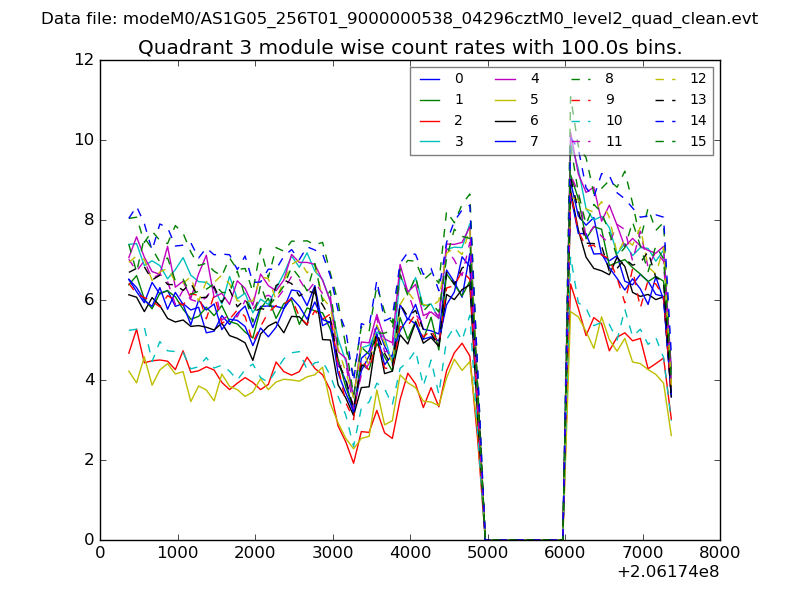
| Module-wise count rates for Quadrant C Data is divided into 100 sec bins |
 |
 |
| Module-wise count rates for Quadrant D Data is divided into 100 sec bins |
 |
 |
| Parameter | Plot |
|---|---|
| CZT HV Monitor | 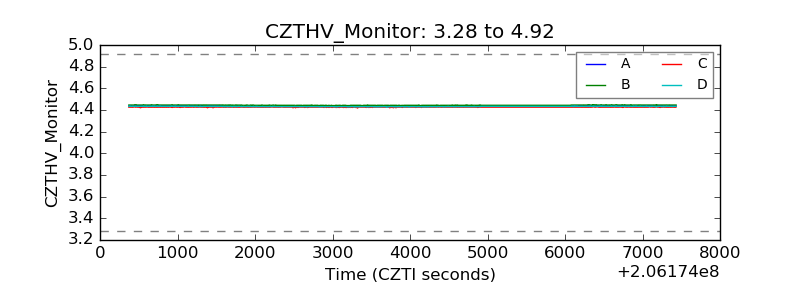 |
| D_VDD | 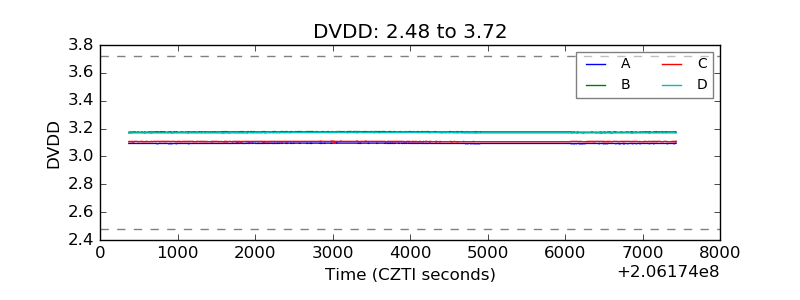 |
| Temperature 1 | 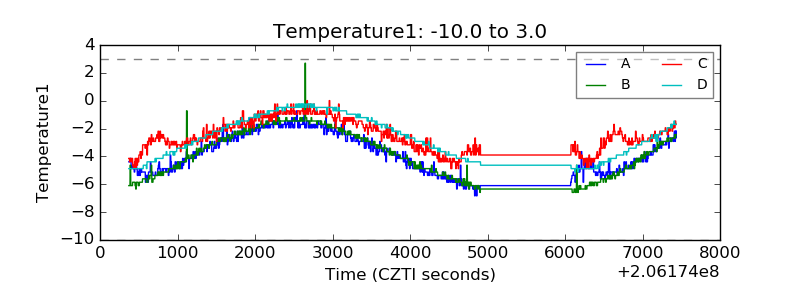 |
| Veto HV Monitor |  |
| Veto LLD | 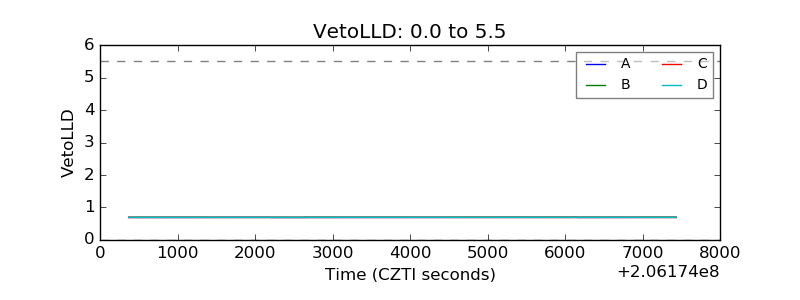 |
| Alpha Counter | 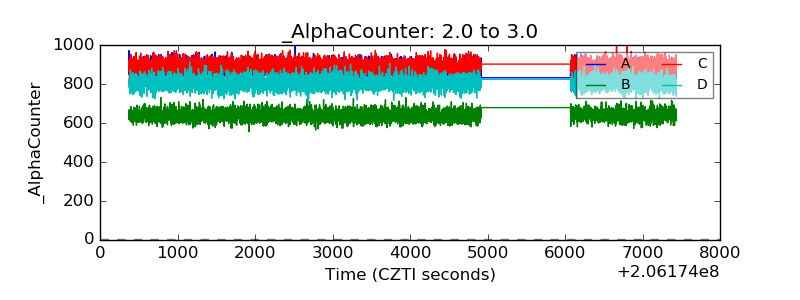 |
| _CPM_Rate | 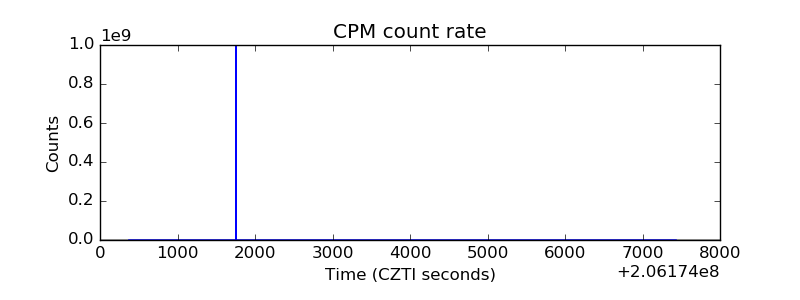 |
| CZT Counter | 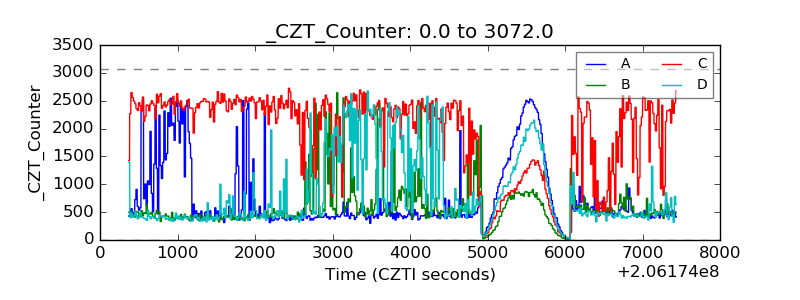 |
| +2.5 Volts monitor | 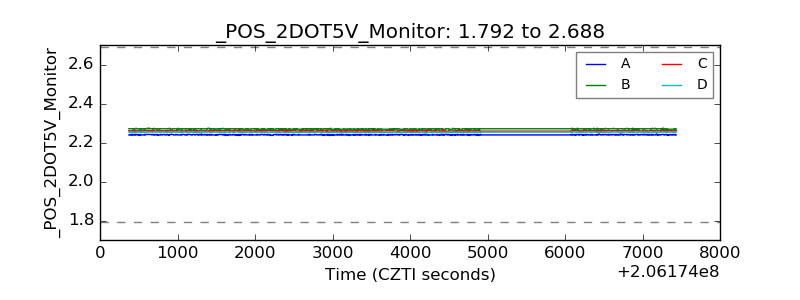 |
| +5 Volts monitor |  |
| _ROLL_ROT | 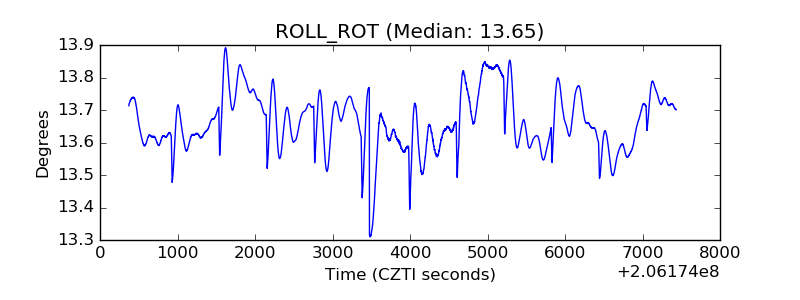 |
| _Roll_DEC | 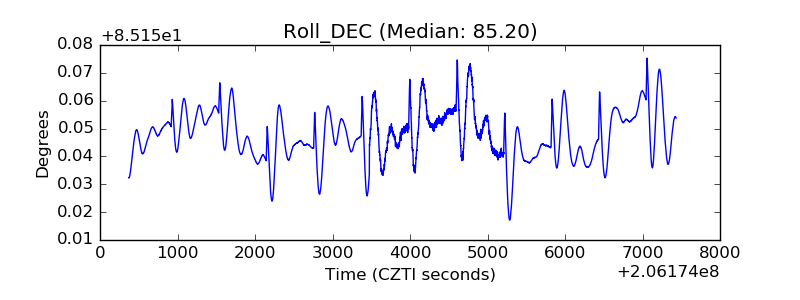 |
| _Roll_RA | 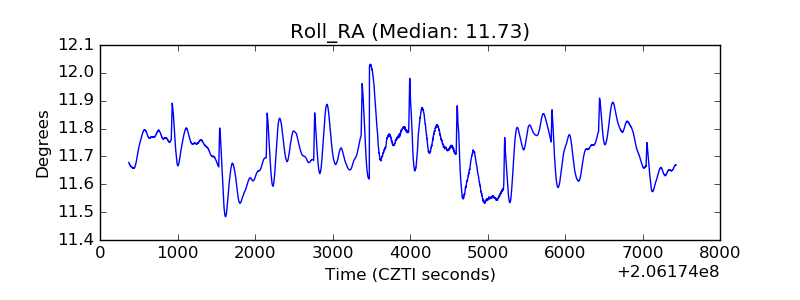 |
| Veto Counter | 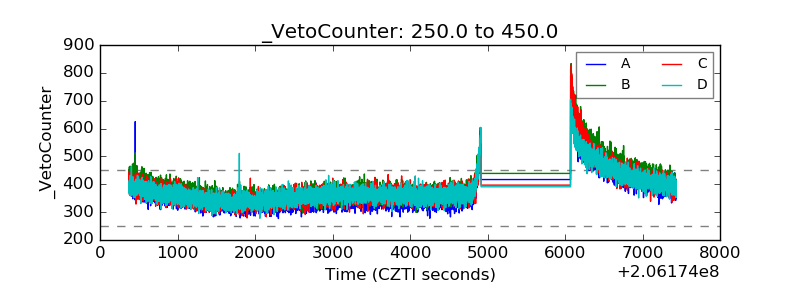 |