| Param | Original file | Final file |
|---|---|---|
| Filename | modeM0/AS1G05_219T01_9000000540_04298cztM0_level2.evt | modeM0/AS1G05_219T01_9000000540_04298cztM0_level2_quad_clean.evt |
| Size (bytes) | 699,609,600 | 84,332,160 |
| Size | 667.2 MB | 80.4 MB |
| Events in quadrant A | 3,107,229 | 576,540 |
| Events in quadrant B | 4,686,087 | 559,603 |
| Events in quadrant C | 7,208,884 | 471,206 |
| Events in quadrant D | 5,772,083 | 518,081 |
| Mode SS | |||
|---|---|---|---|
| Quadrant | BADHDUFLAG | Total packets | Discarded packets |
| A | 0 | 124 | 0 |
| B | 0 | 124 | 0 |
| C | 0 | 124 | 0 |
| D | 0 | 124 | 0 |
| Mode M9 | |||
|---|---|---|---|
| Quadrant | BADHDUFLAG | Total packets | Discarded packets |
| A | 0 | 13 | 0 |
| B | 0 | 13 | 0 |
| C | 0 | 13 | 0 |
| D | 0 | 13 | 0 |
| Mode M0 | |||
|---|---|---|---|
| Quadrant | BADHDUFLAG | Total packets | Discarded packets |
| A | 0 | 13188 | 2 |
| B | 0 | 17966 | 1 |
| C | 0 | 25556 | 5 |
| D | 0 | 21330 | 1 |
| Quadrant | Total seconds | Saturated seconds | Saturation percentage |
|---|---|---|---|
| A | 6117 | 114 | 1.863659% |
| B | 6141 | 431 | 7.018401% |
| C | 6118 | 1760 | 28.767571% |
| D | 6118 | 594 | 9.709055% |
Noise dominated data is calculated using 1-second bins in cleaned event files. If a bin has >2000 counts, and if more than 50% of those come from <1% of pixels, then it is considered to be noise-dominated and hence unusable.
| Quadrant | # 1 sec bins | Bins with >0 counts | Bins with >2000 counts | High rate bins dominated by noise | Noise dominated (total time) | Noise dominated (detector-on time) | Marked lightcurve |
|---|---|---|---|---|---|---|---|
| A | 7411 | 6118 | 12 | 12 | 0.16% | 0.20% | 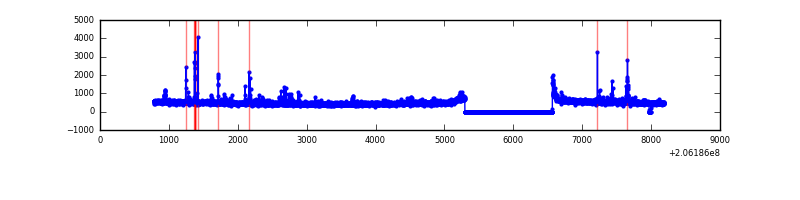 |
| B | 7411 | 6141 | 312 | 312 | 4.21% | 5.08% | 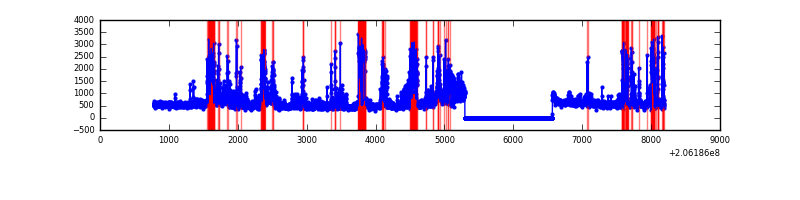 |
| C | 7411 | 6118 | 1650 | 1650 | 22.26% | 26.97% |  |
| D | 7411 | 6119 | 408 | 408 | 5.51% | 6.67% | 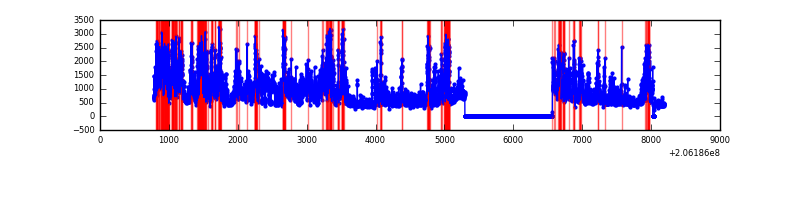 |
Top three noisy pixels from each quadrant. If the there are fewer than three noisy pixels in the level2.evt file, extra rows are filled as -1
| Pixel properties | Quadrant properties | ||||||
|---|---|---|---|---|---|---|---|
| Quadrant | DetID | PixID | Counts | Sigma | Mean | Median | Sigma |
| A | 0 | 199 | 48945 | 307.18 | 760 | 745 | 156.9 |
| A | 15 | 234 | 34012 | 212.01 | 760 | 745 | 156.9 |
| A | 11 | 192 | 23767 | 146.72 | 760 | 745 | 156.9 |
| B | 14 | 167 | 1115861 | 7770.26 | 745 | 728 | 143.5 |
| B | 10 | 16 | 403633 | 2807.45 | 745 | 728 | 143.5 |
| B | 8 | 3 | 112861 | 781.34 | 745 | 728 | 143.5 |
| C | 9 | 144 | 4769155 | 32869.48 | 621 | 625 | 145.1 |
| C | 9 | 54 | 7219 | 45.45 | 621 | 625 | 145.1 |
| C | 13 | 61 | 5245 | 31.85 | 621 | 625 | 145.1 |
| D | 2 | 232 | 2005179 | 11686.49 | 713 | 693 | 171.5 |
| D | 2 | 63 | 689147 | 4013.8 | 713 | 693 | 171.5 |
| D | 2 | 136 | 154056 | 894.13 | 713 | 693 | 171.5 |
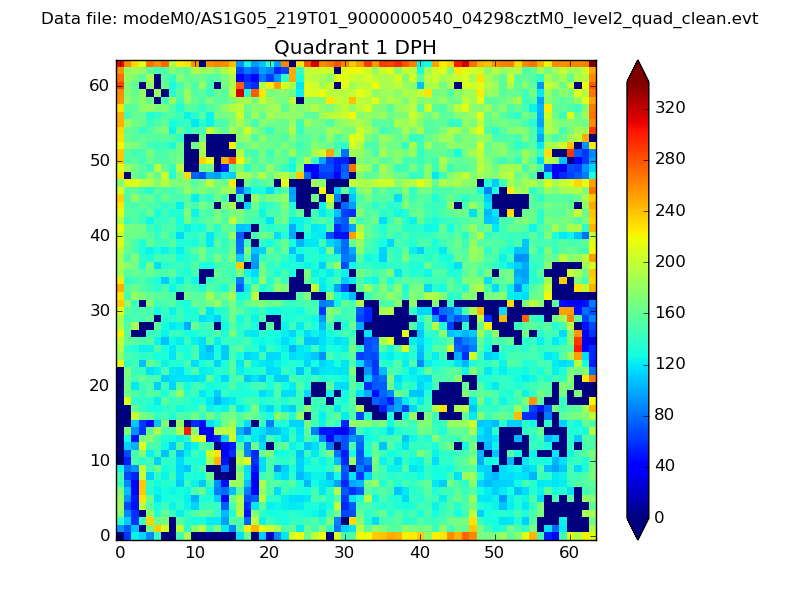
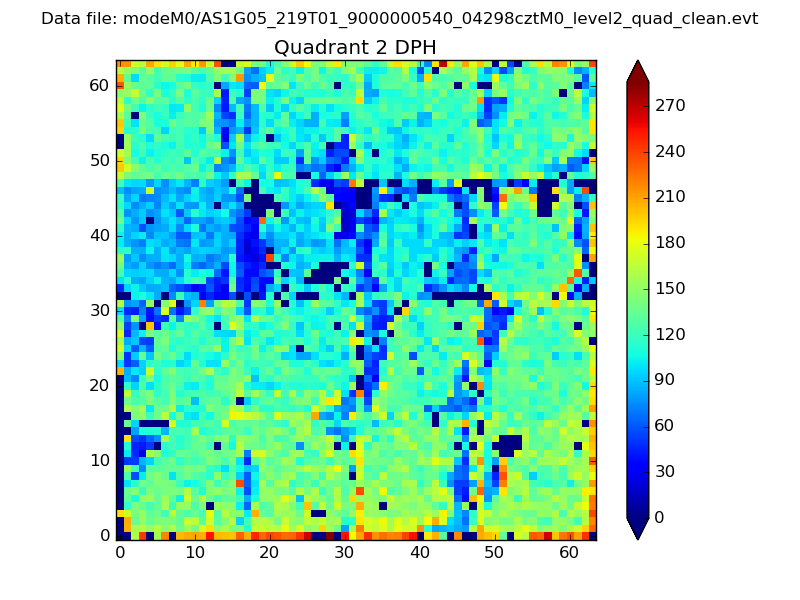
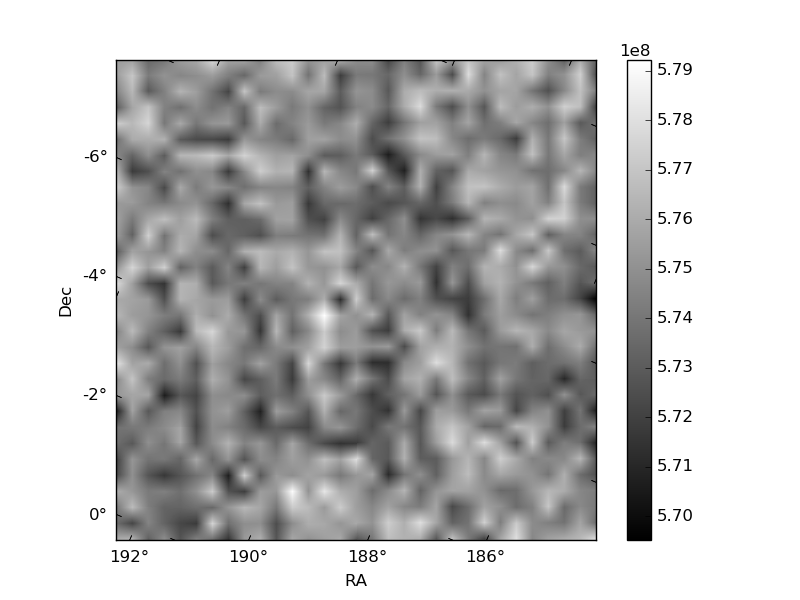
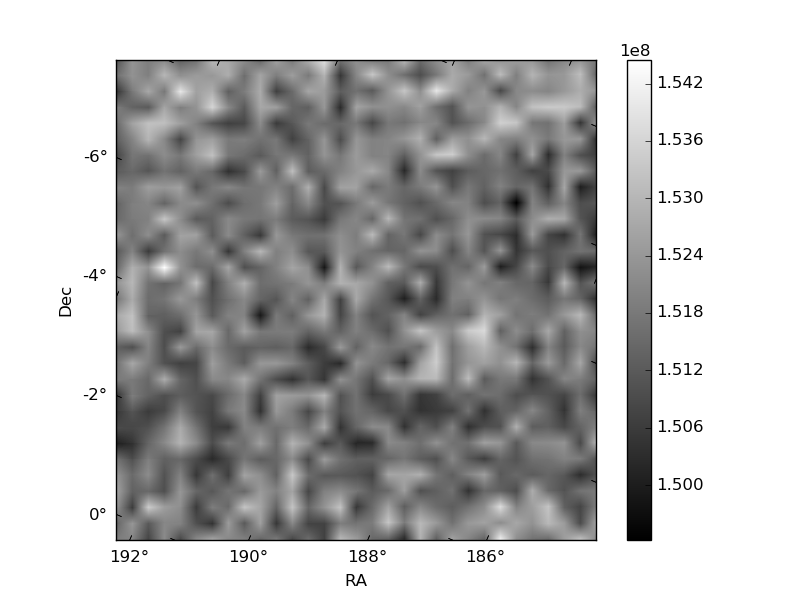
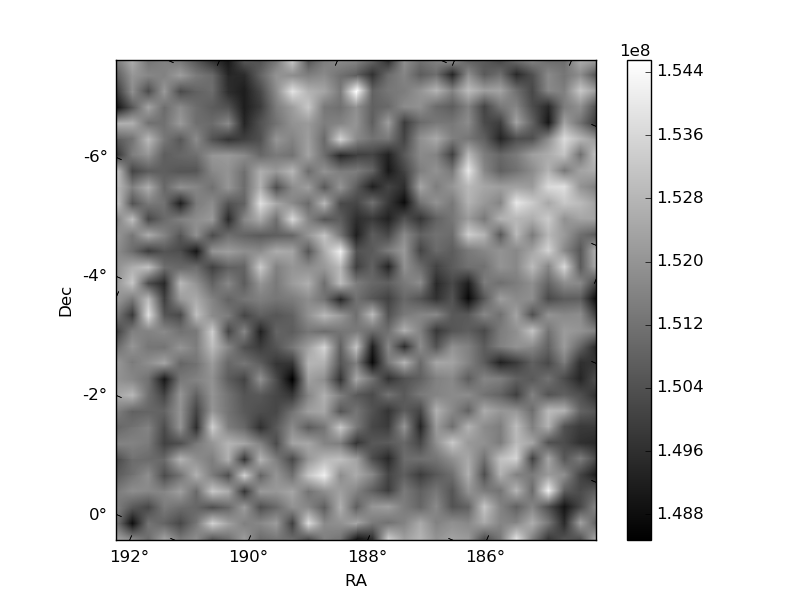
Histogram calculated using DETX and DETY for each event in the final _common_clean file
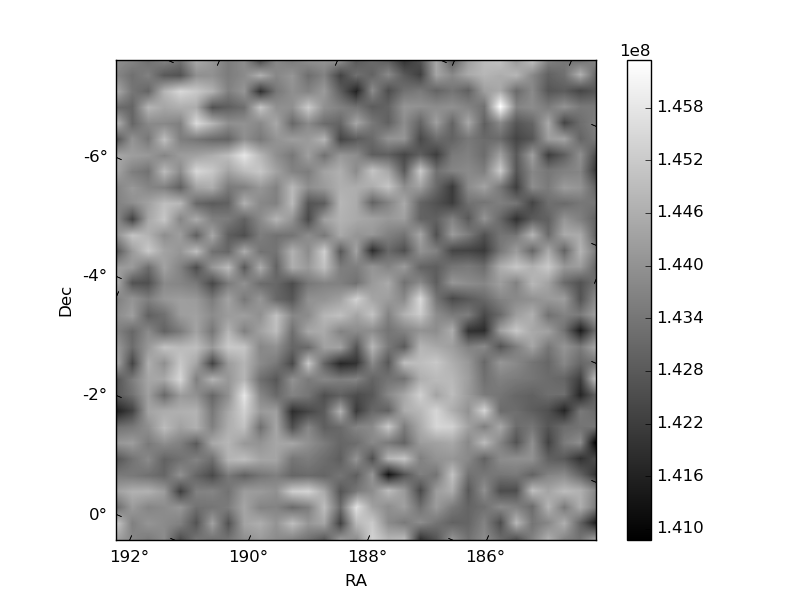
| Quadrant A | 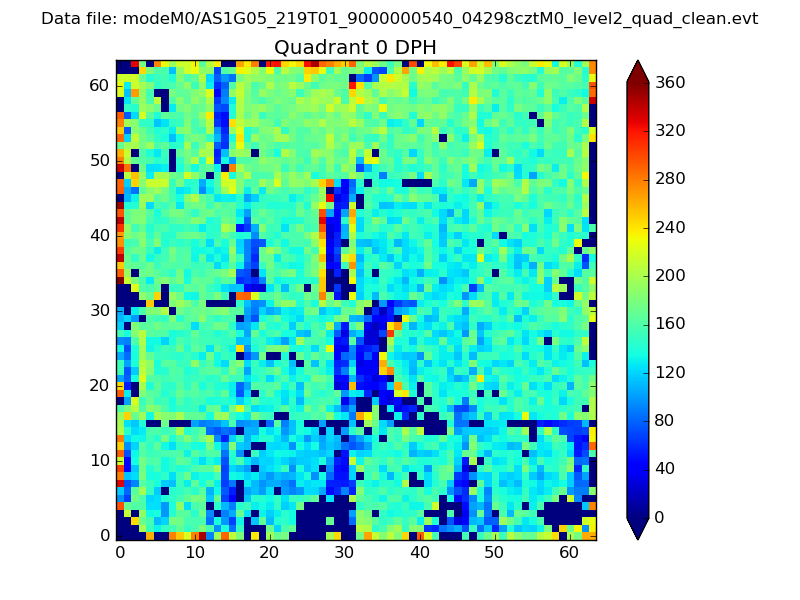 |
 |
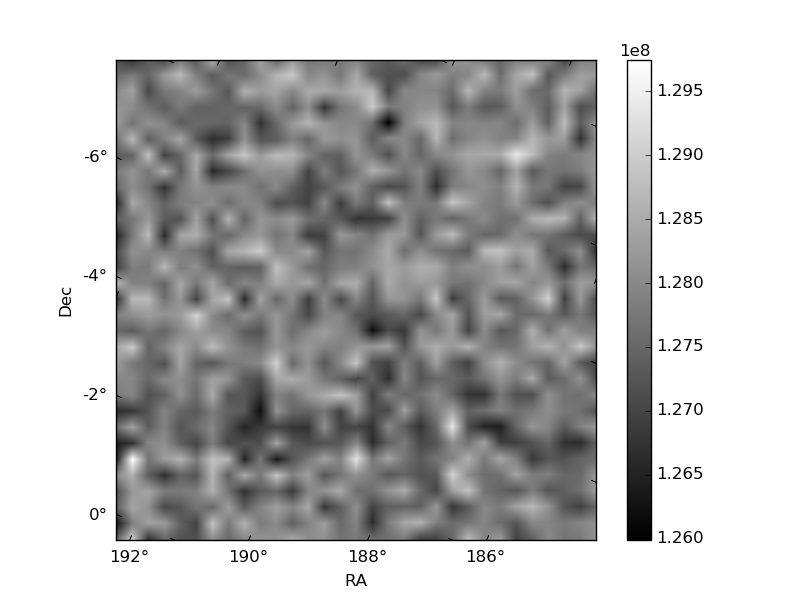
Quadrant B |
|---|---|---|---|
| Quadrant D | 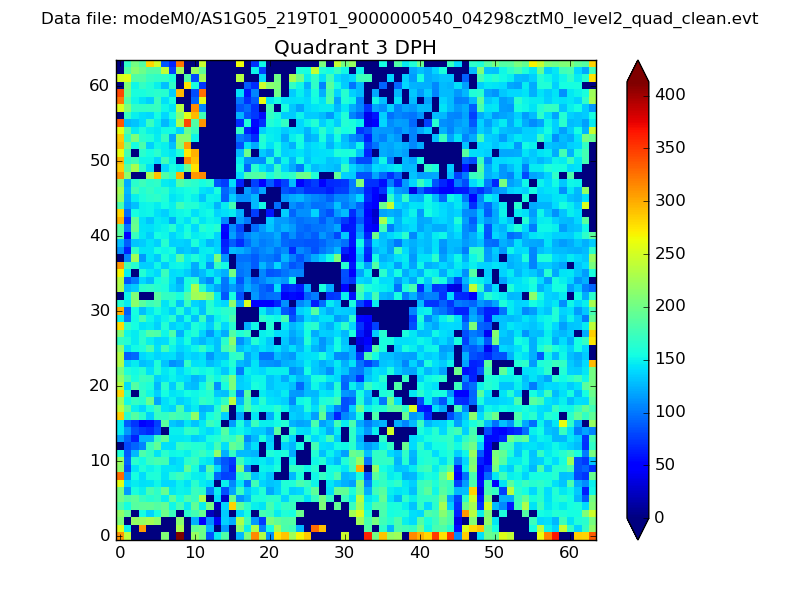 |
 |
Quadrant C |
| Plot type | Count rate plots | Images |
|---|---|---|
| Comparison with Poisson distribution Blue bars denote a histogram of data divided into 1 sec bins. Red curve is a Poisson curve with rate = median count rate of data. |
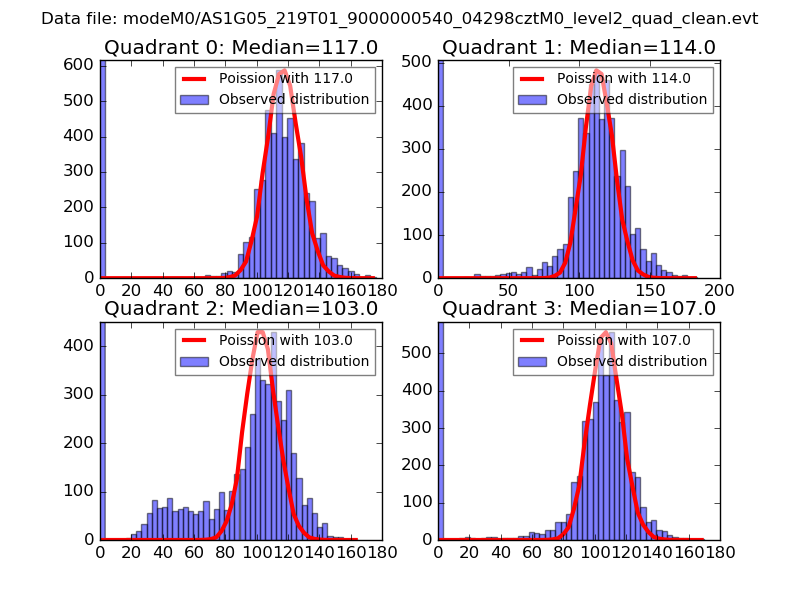 |
 |
| Quadrant-wise count rates Data is divided into 100 sec bins |
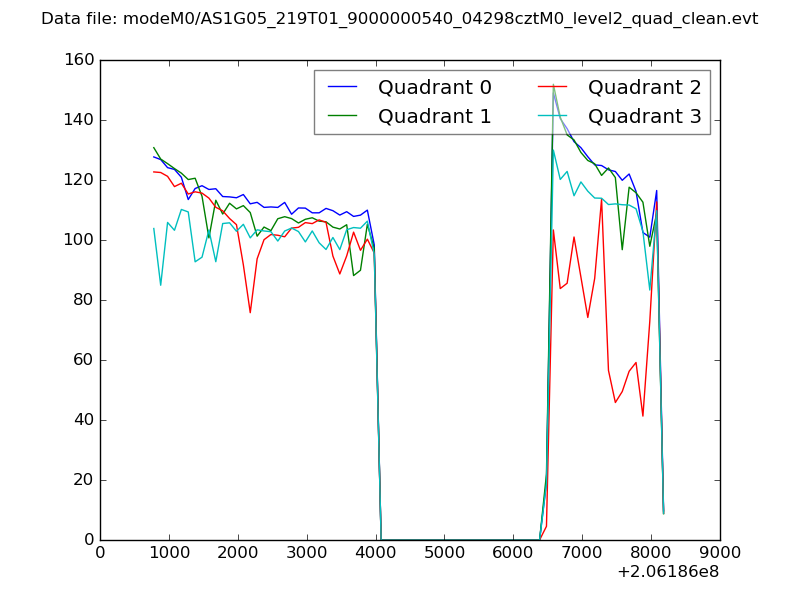 |
|
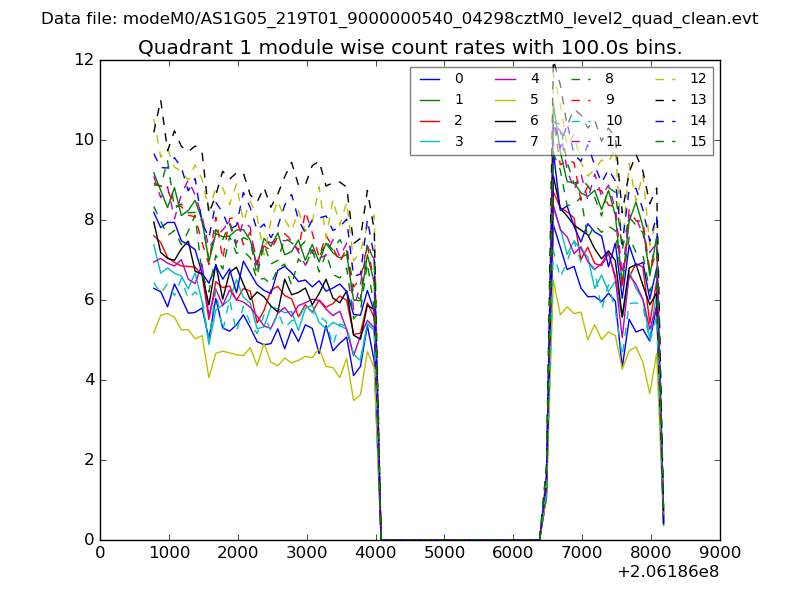
| Module-wise count rates for Quadrant A Data is divided into 100 sec bins |
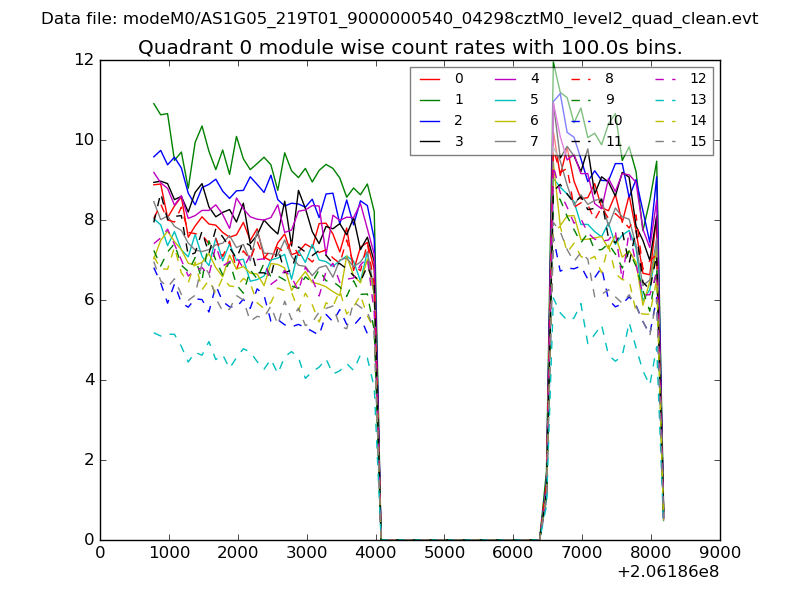 |
 |
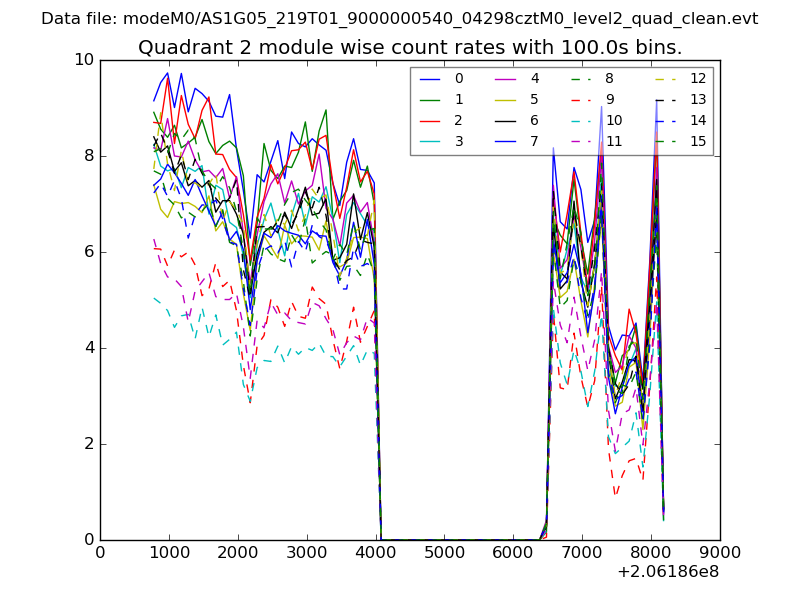
| Module-wise count rates for Quadrant B Data is divided into 100 sec bins |
 |
 |
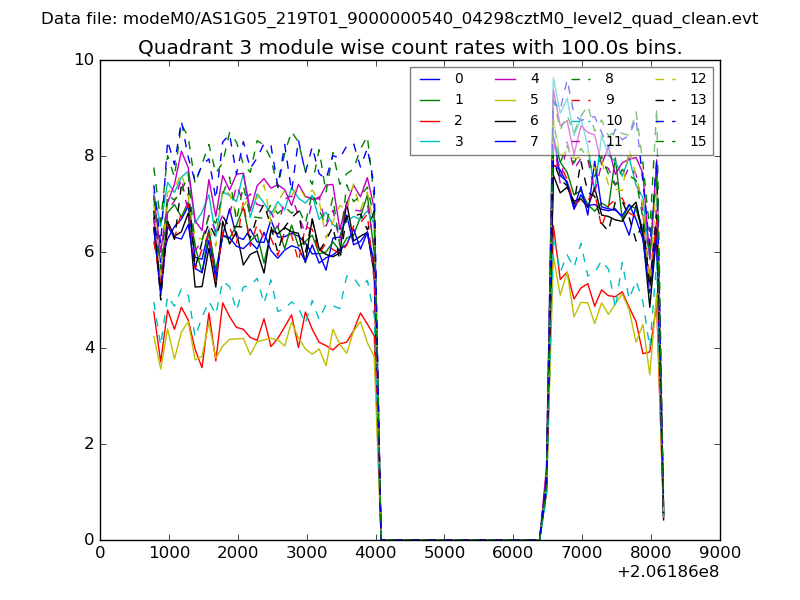
| Module-wise count rates for Quadrant C Data is divided into 100 sec bins |
 |
 |
| Module-wise count rates for Quadrant D Data is divided into 100 sec bins |
 |
 |
| Parameter | Plot |
|---|---|
| CZT HV Monitor | 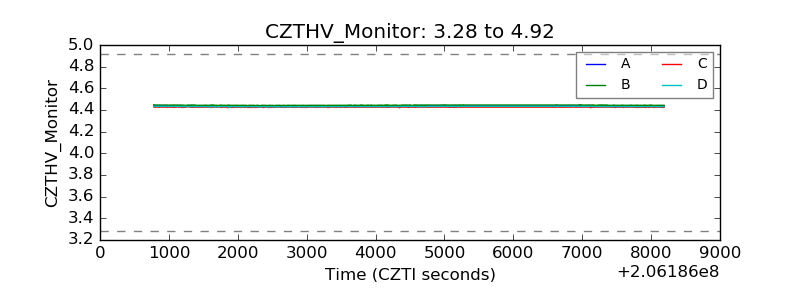 |
| D_VDD | 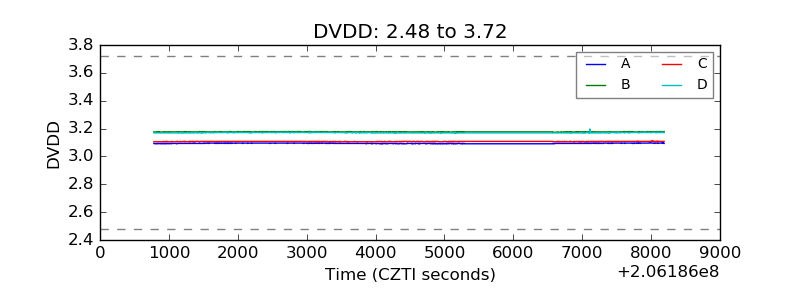 |
| Temperature 1 | 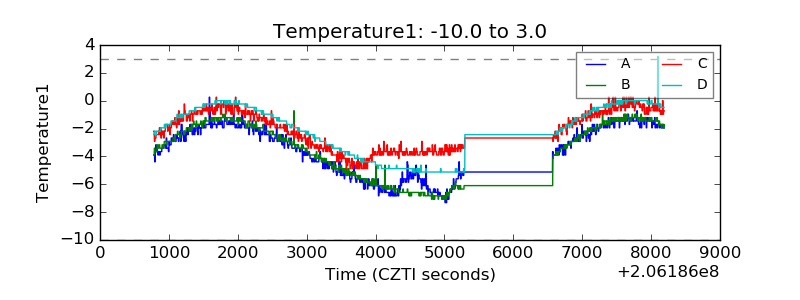 |
| Veto HV Monitor | 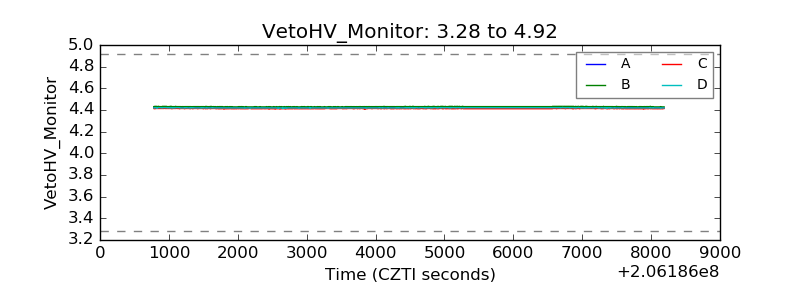 |
| Veto LLD | 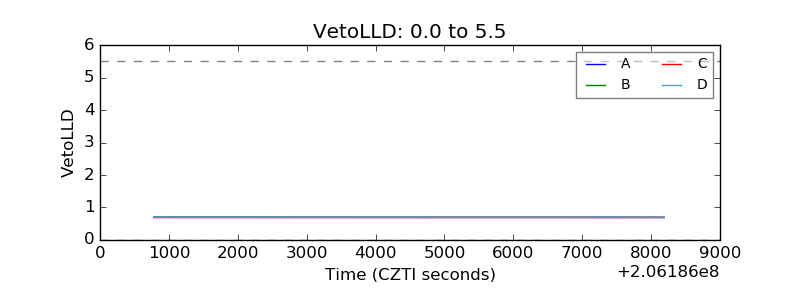 |
| Alpha Counter | 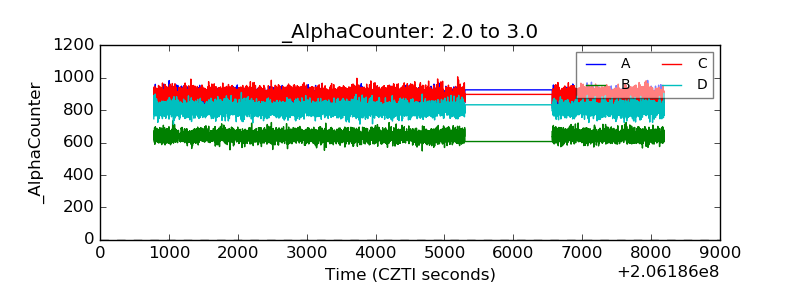 |
| _CPM_Rate | 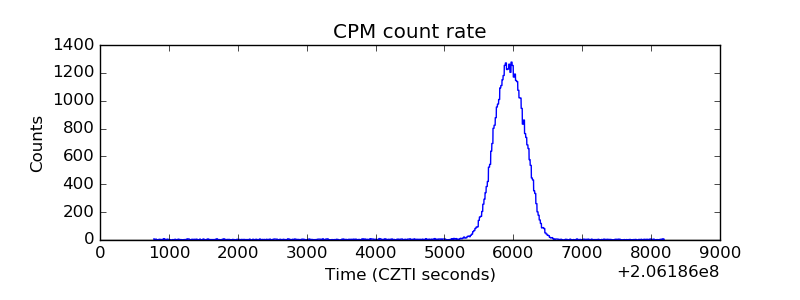 |
| CZT Counter | 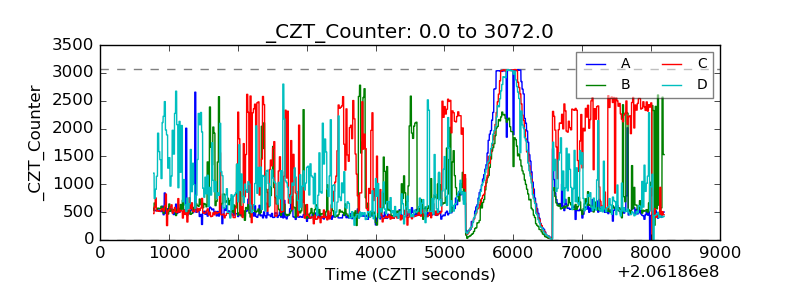 |
| +2.5 Volts monitor |  |
| +5 Volts monitor |  |
| _ROLL_ROT | 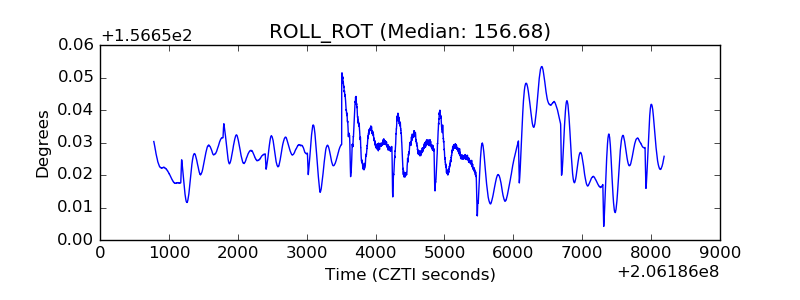 |
| _Roll_DEC | 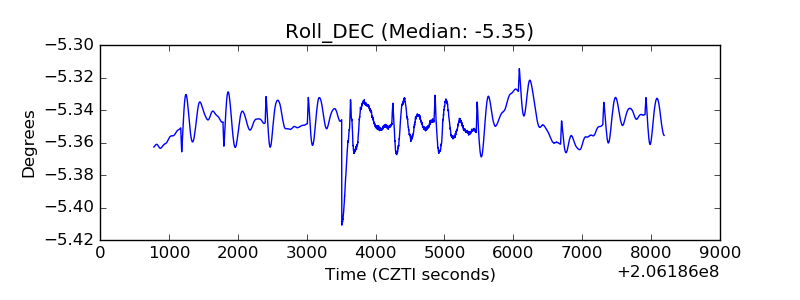 |
| _Roll_RA | 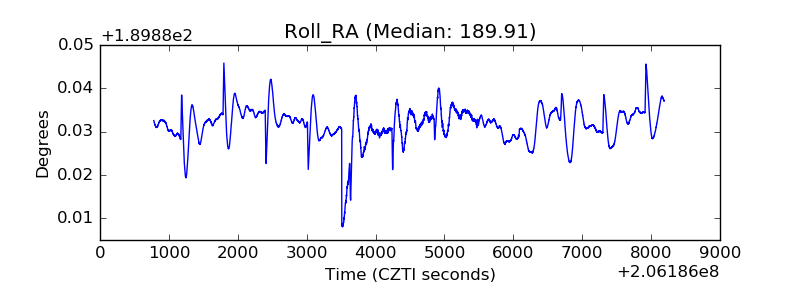 |
| Veto Counter | 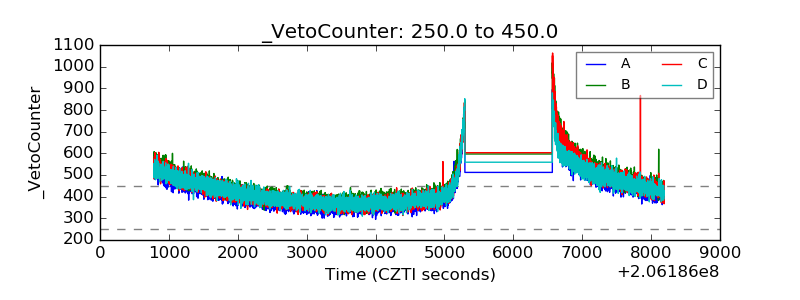 |