| Param | Original file | Final file |
|---|---|---|
| Filename | modeM0/AS1G05_219T01_9000000540_04299cztM0_level2.evt | modeM0/AS1G05_219T01_9000000540_04299cztM0_level2_quad_clean.evt |
| Size (bytes) | 495,924,480 | 74,373,120 |
| Size | 473.0 MB | 70.9 MB |
| Events in quadrant A | 3,167,062 | 483,740 |
| Events in quadrant B | 4,052,374 | 472,972 |
| Events in quadrant C | 3,952,880 | 432,788 |
| Events in quadrant D | 3,450,379 | 454,178 |
| Mode SS | |||
|---|---|---|---|
| Quadrant | BADHDUFLAG | Total packets | Discarded packets |
| A | 0 | 120 | 0 |
| B | 0 | 120 | 0 |
| C | 0 | 120 | 0 |
| D | 0 | 120 | 0 |
| Mode M9 | |||
|---|---|---|---|
| Quadrant | BADHDUFLAG | Total packets | Discarded packets |
| A | 0 | 13 | 0 |
| B | 0 | 13 | 0 |
| C | 0 | 13 | 0 |
| D | 0 | 13 | 0 |
| Mode M0 | |||
|---|---|---|---|
| Quadrant | BADHDUFLAG | Total packets | Discarded packets |
| A | 0 | 13301 | 2 |
| B | 0 | 15887 | 1 |
| C | 0 | 15868 | 5 |
| D | 0 | 14296 | 1 |
| Quadrant | Total seconds | Saturated seconds | Saturation percentage |
|---|---|---|---|
| A | 5828 | 190 | 3.260124% |
| B | 5852 | 268 | 4.579631% |
| C | 5829 | 672 | 11.528564% |
| D | 5829 | 215 | 3.688454% |
Noise dominated data is calculated using 1-second bins in cleaned event files. If a bin has >2000 counts, and if more than 50% of those come from <1% of pixels, then it is considered to be noise-dominated and hence unusable.
| Quadrant | # 1 sec bins | Bins with >0 counts | Bins with >2000 counts | High rate bins dominated by noise | Noise dominated (total time) | Noise dominated (detector-on time) | Marked lightcurve |
|---|---|---|---|---|---|---|---|
| A | 7132 | 5829 | 94 | 94 | 1.32% | 1.61% |  |
| B | 7132 | 5852 | 196 | 196 | 2.75% | 3.35% |  |
| C | 7132 | 5830 | 595 | 595 | 8.34% | 10.21% |  |
| D | 7132 | 5830 | 175 | 175 | 2.45% | 3.00% | 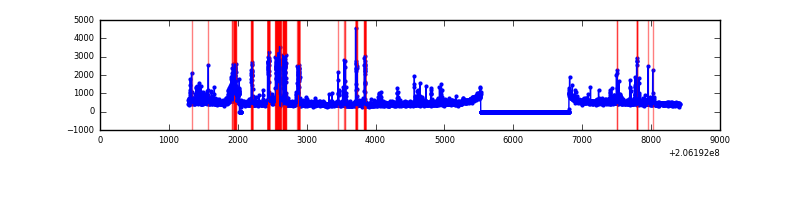 |
Top three noisy pixels from each quadrant. If the there are fewer than three noisy pixels in the level2.evt file, extra rows are filled as -1
| Pixel properties | Quadrant properties | ||||||
|---|---|---|---|---|---|---|---|
| Quadrant | DetID | PixID | Counts | Sigma | Mean | Median | Sigma |
| A | 15 | 234 | 230105 | 1585.72 | 706 | 691 | 144.7 |
| A | 0 | 50 | 172668 | 1188.71 | 706 | 691 | 144.7 |
| A | 13 | 248 | 20687 | 138.21 | 706 | 691 | 144.7 |
| B | 14 | 167 | 1180282 | 8759.17 | 704 | 689 | 134.7 |
| B | 10 | 16 | 49282 | 360.83 | 704 | 689 | 134.7 |
| B | 15 | 204 | 26247 | 189.78 | 704 | 689 | 134.7 |
| C | 9 | 144 | 1348087 | 8960.46 | 642 | 645 | 150.4 |
| C | 14 | 67 | 51948 | 341.16 | 642 | 645 | 150.4 |
| C | 9 | 247 | 40495 | 265.0 | 642 | 645 | 150.4 |
| D | 9 | 35 | 344609 | 2100.24 | 679 | 658 | 163.8 |
| D | 2 | 232 | 152522 | 927.32 | 679 | 658 | 163.8 |
| D | 2 | 136 | 114171 | 693.14 | 679 | 658 | 163.8 |
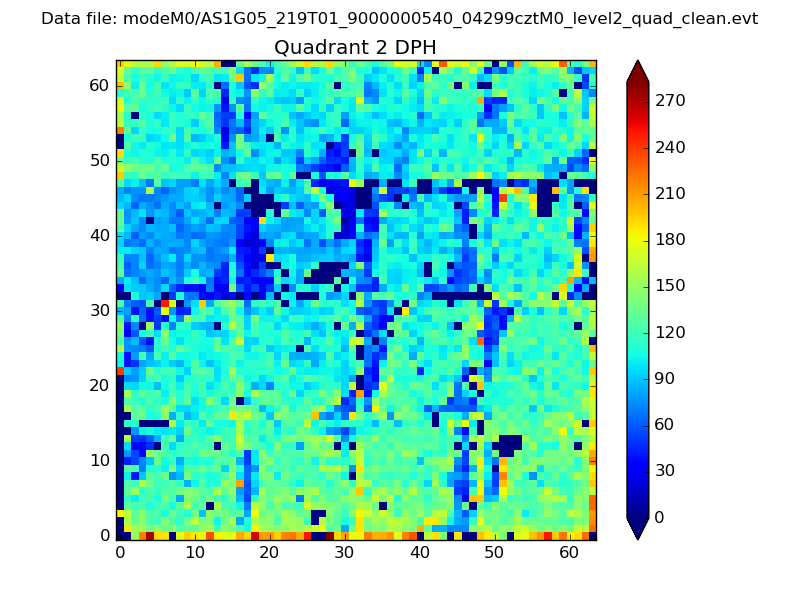
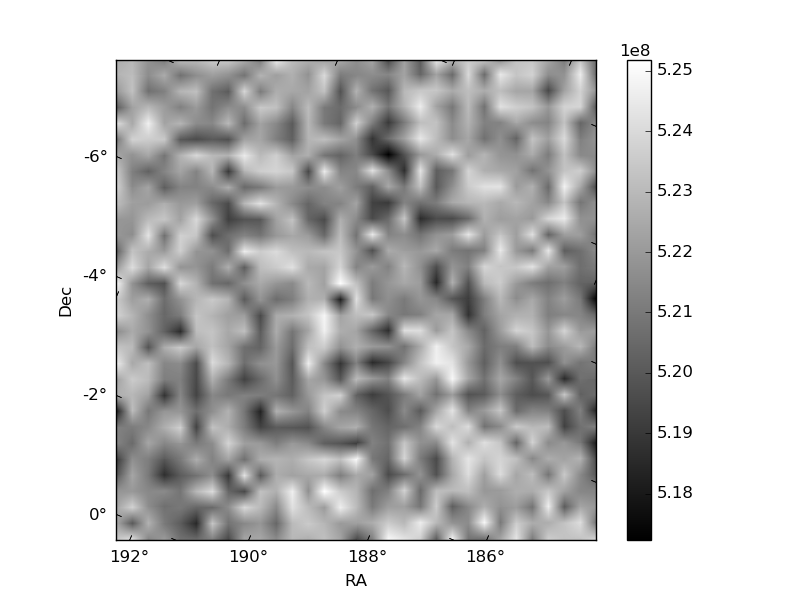
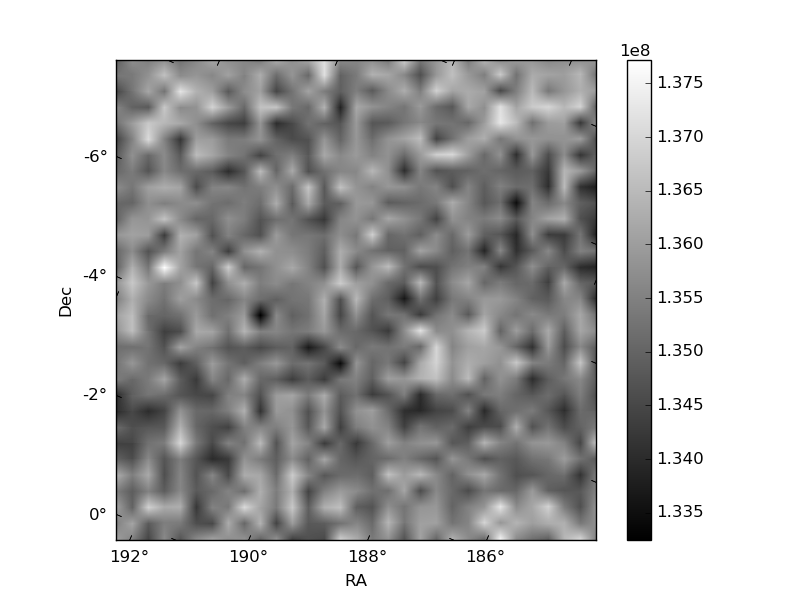
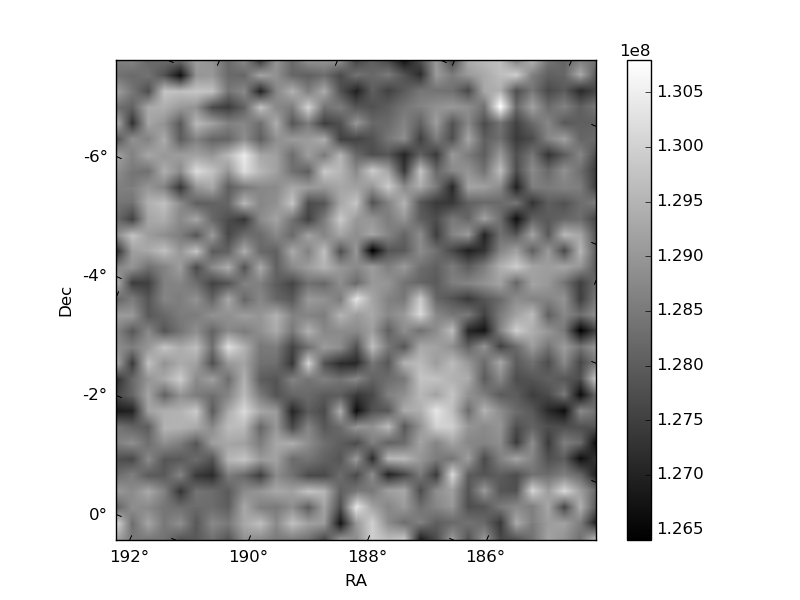
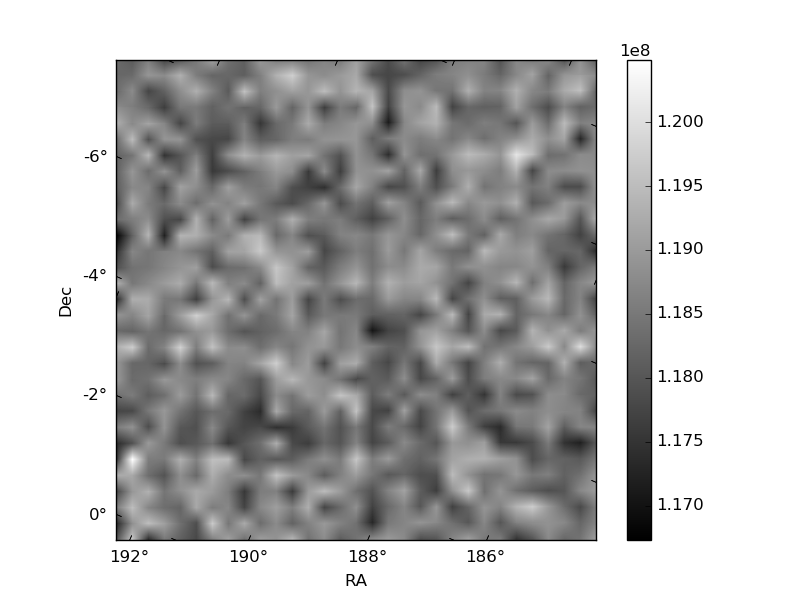
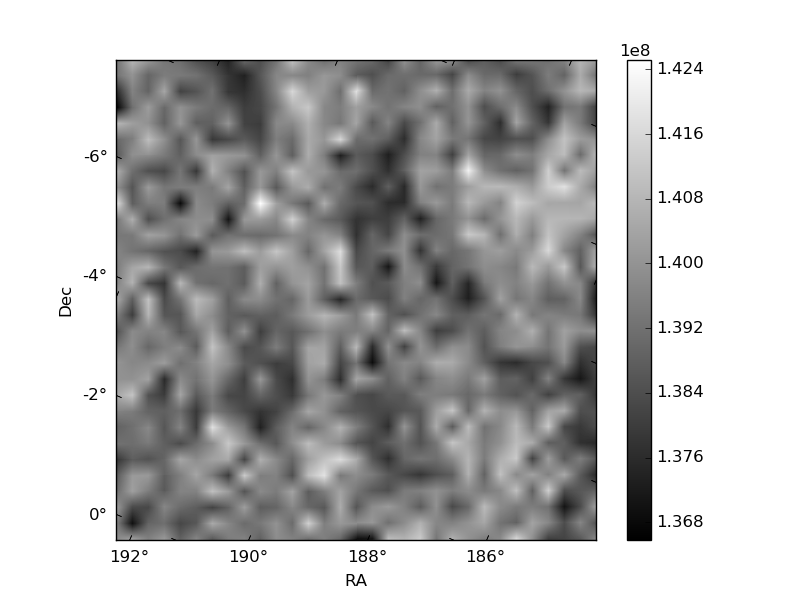
Histogram calculated using DETX and DETY for each event in the final _common_clean file
| Quadrant A |  |
 |
Quadrant B |
|---|---|---|---|
| Quadrant D | 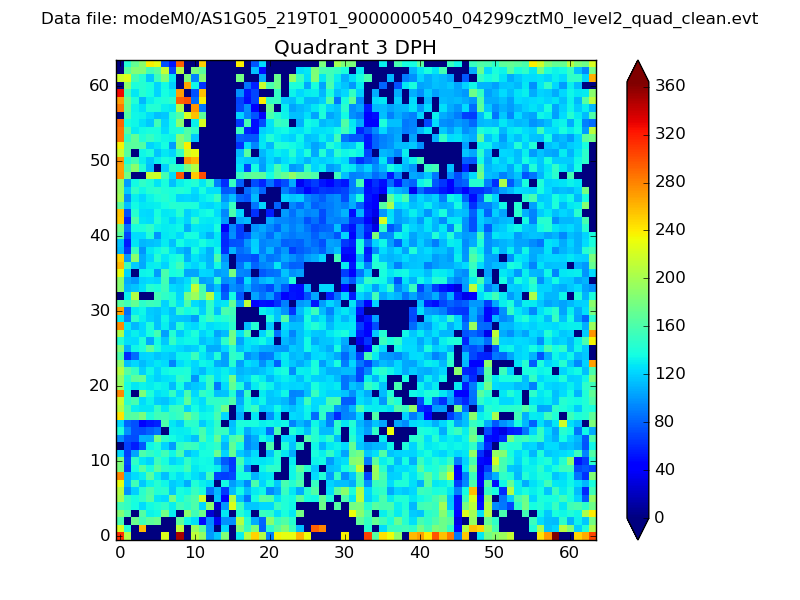 |
 |
Quadrant C |
| Plot type | Count rate plots | Images |
|---|---|---|
| Comparison with Poisson distribution Blue bars denote a histogram of data divided into 1 sec bins. Red curve is a Poisson curve with rate = median count rate of data. |
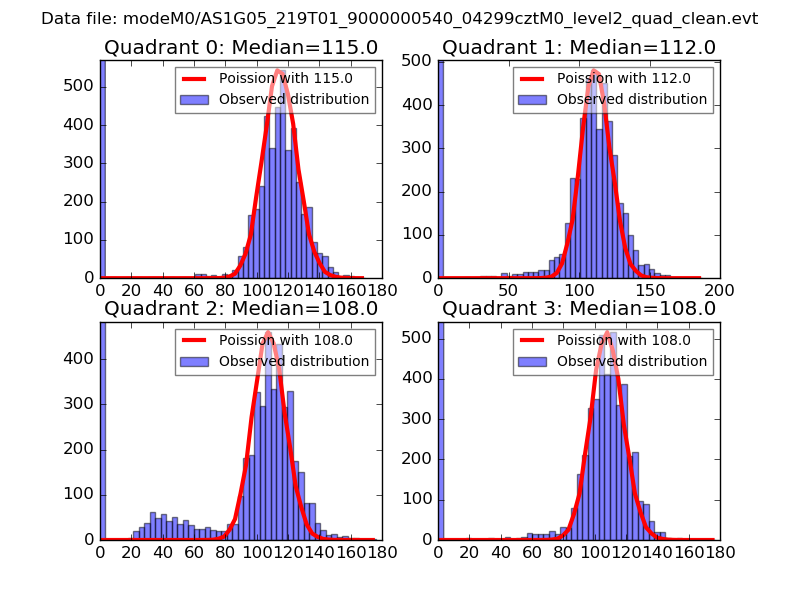 |
 |
| Quadrant-wise count rates Data is divided into 100 sec bins |
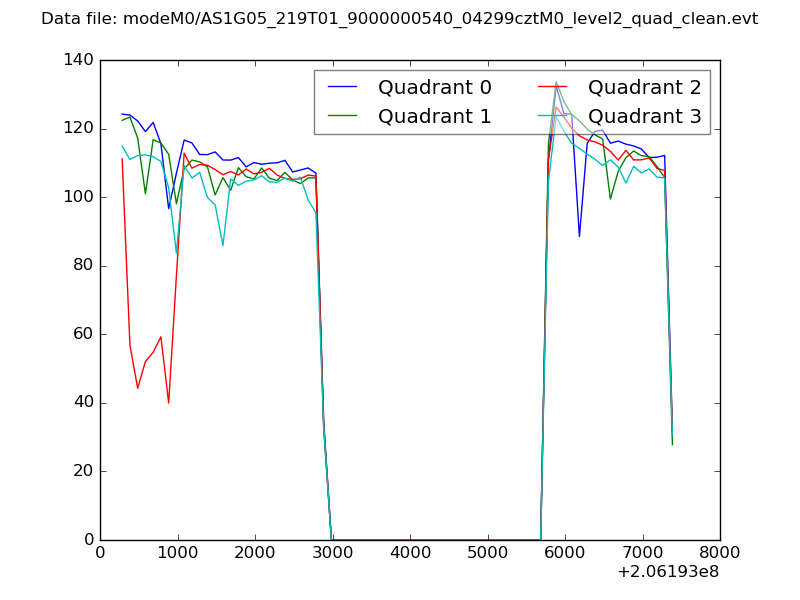 |
|
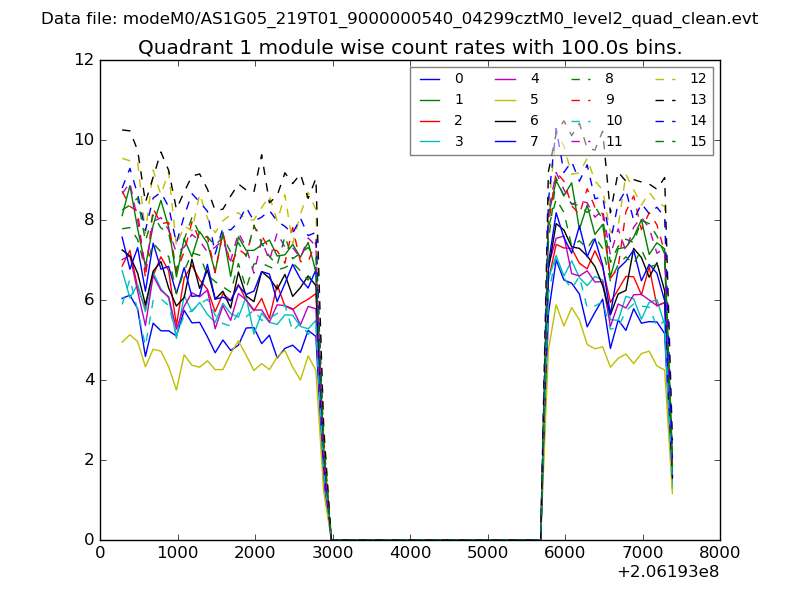
| Module-wise count rates for Quadrant A Data is divided into 100 sec bins |
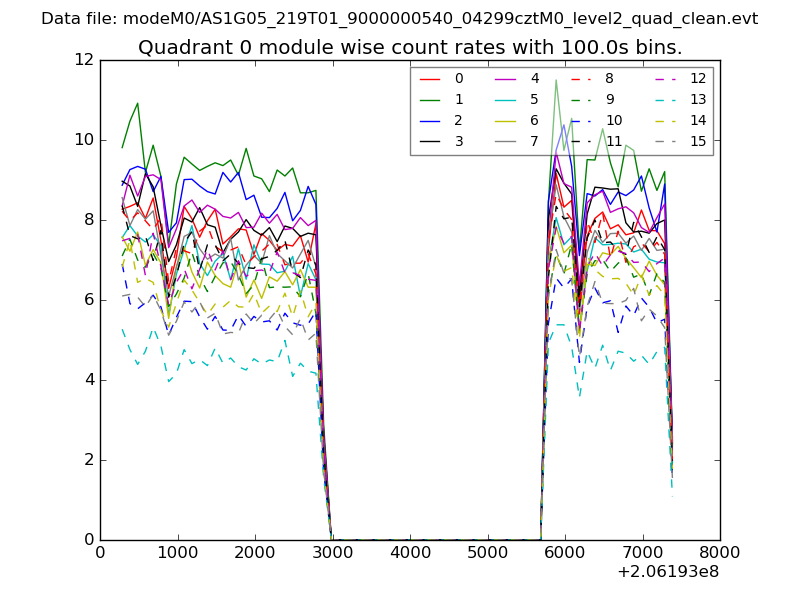 |
 |
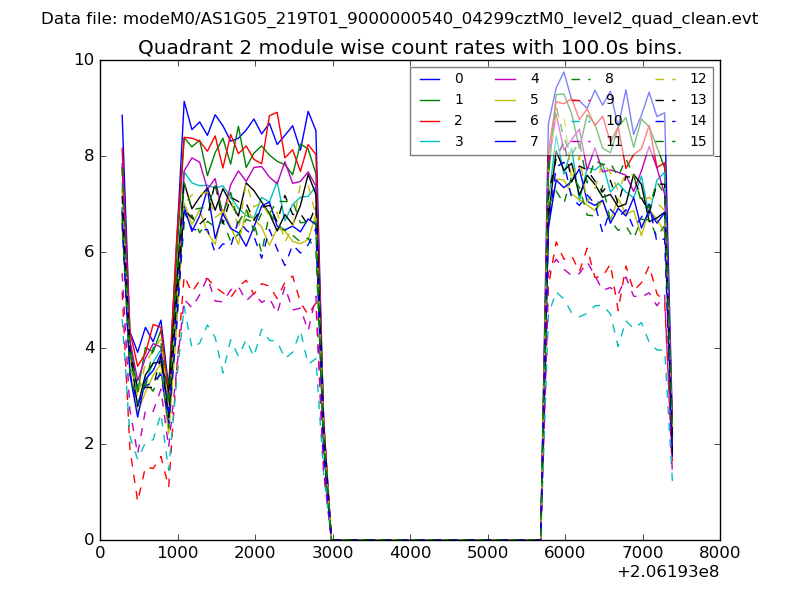
| Module-wise count rates for Quadrant B Data is divided into 100 sec bins |
 |
 |
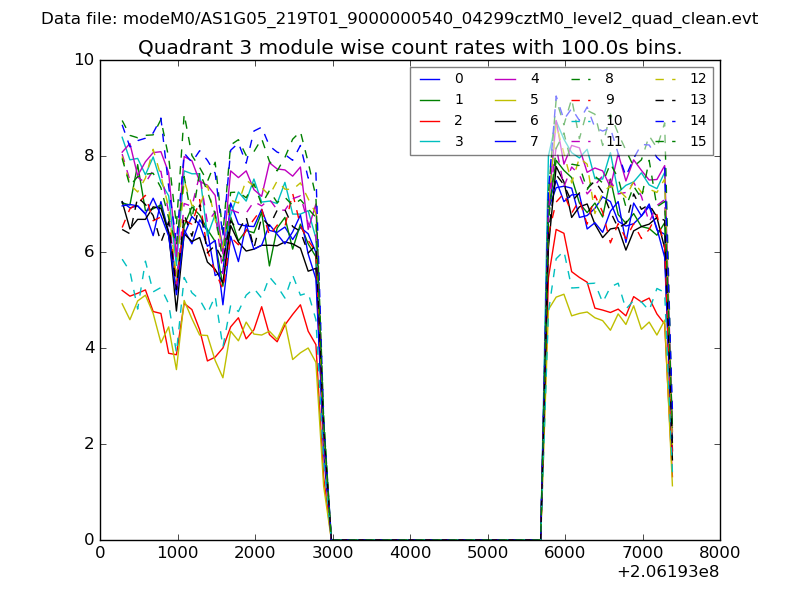
| Module-wise count rates for Quadrant C Data is divided into 100 sec bins |
 |
 |
| Module-wise count rates for Quadrant D Data is divided into 100 sec bins |
 |
 |
| Parameter | Plot |
|---|---|
| CZT HV Monitor | 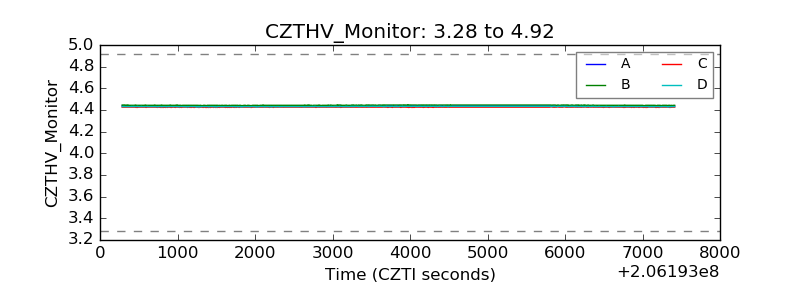 |
| D_VDD | 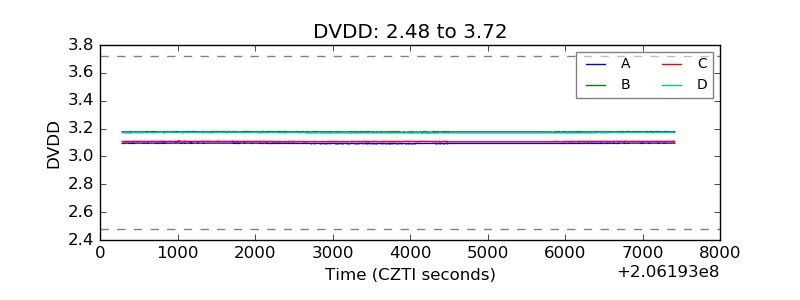 |
| Temperature 1 | 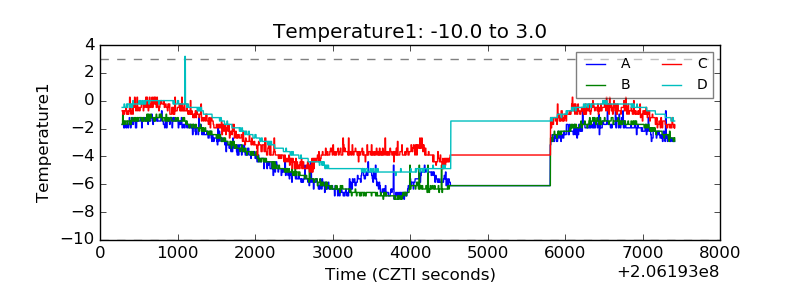 |
| Veto HV Monitor | 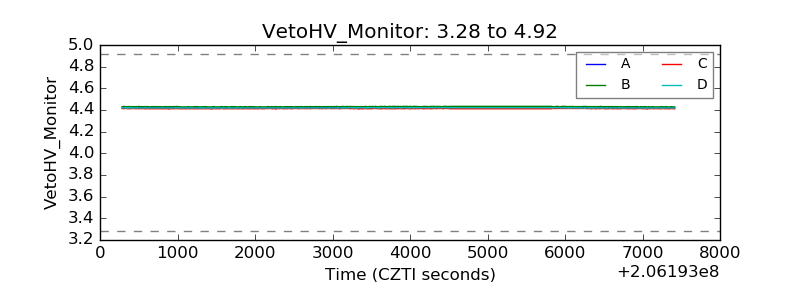 |
| Veto LLD | 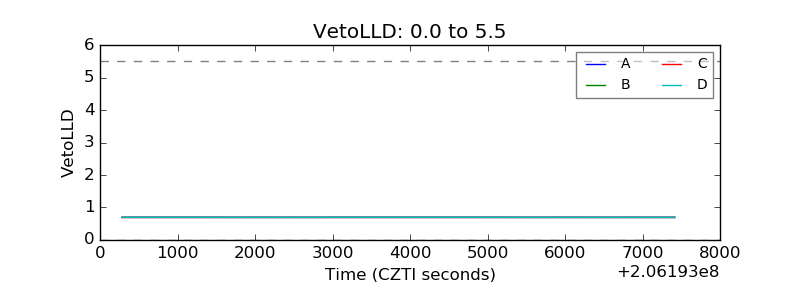 |
| Alpha Counter | 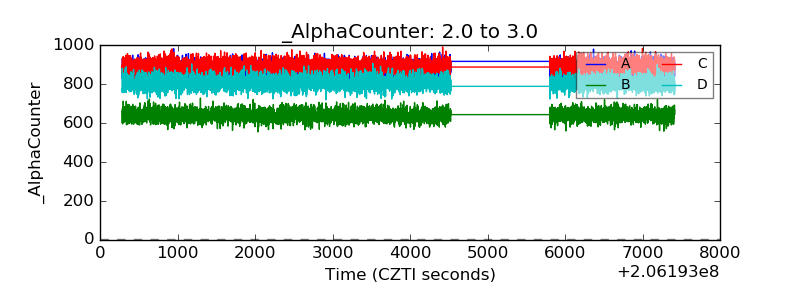 |
| _CPM_Rate | 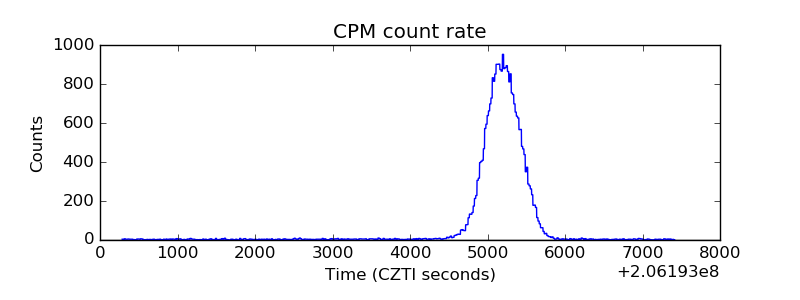 |
| CZT Counter | 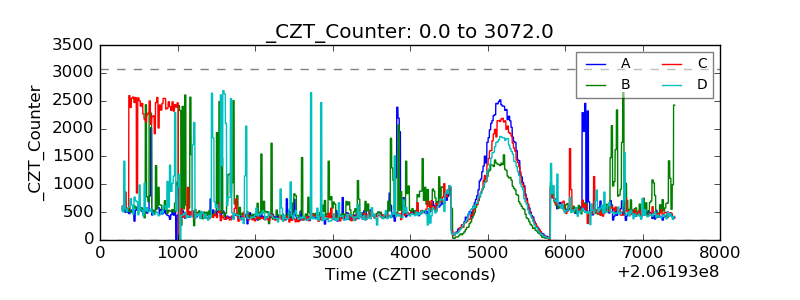 |
| +2.5 Volts monitor | 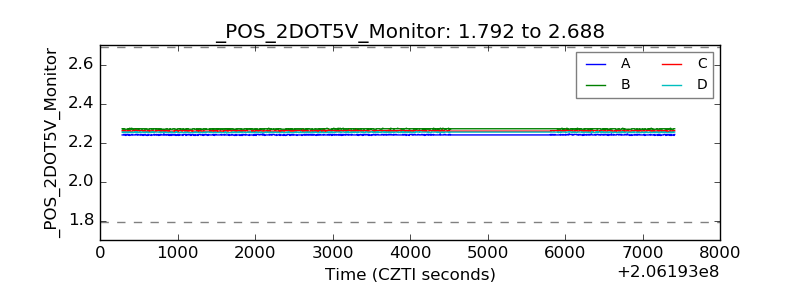 |
| +5 Volts monitor |  |
| _ROLL_ROT | 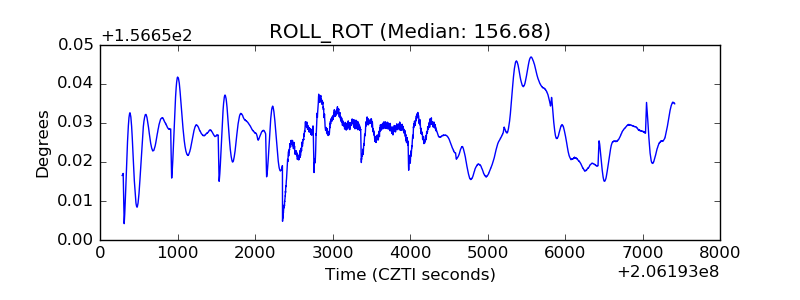 |
| _Roll_DEC | 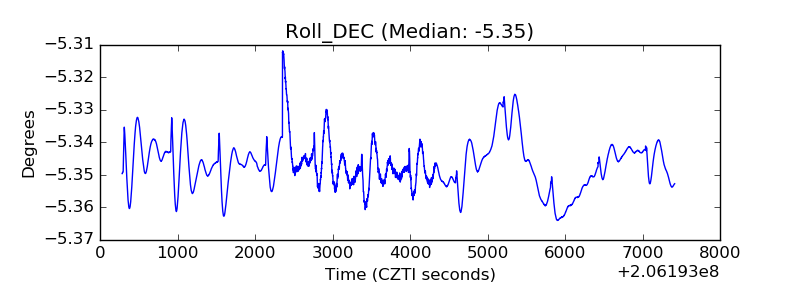 |
| _Roll_RA | 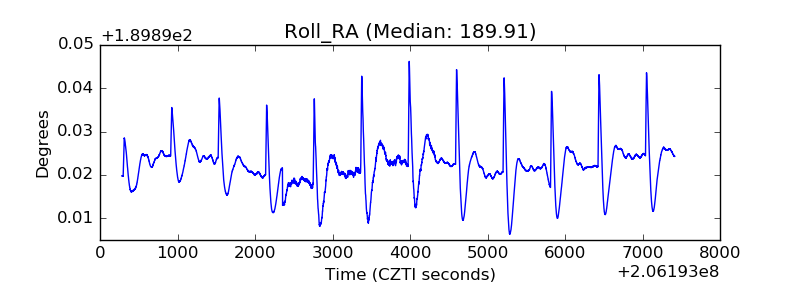 |
| Veto Counter | 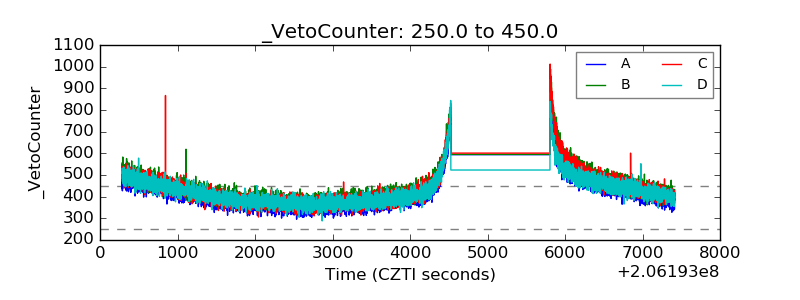 |