| Param | Original file | Final file |
|---|---|---|
| Filename | modeM0/AS1G05_219T01_9000000540_04300cztM0_level2.evt | modeM0/AS1G05_219T01_9000000540_04300cztM0_level2_quad_clean.evt |
| Size (bytes) | 495,354,240 | 77,117,760 |
| Size | 472.4 MB | 73.5 MB |
| Events in quadrant A | 3,852,292 | 464,462 |
| Events in quadrant B | 4,268,446 | 477,287 |
| Events in quadrant C | 3,114,930 | 477,420 |
| Events in quadrant D | 3,328,504 | 466,186 |
| Mode SS | |||
|---|---|---|---|
| Quadrant | BADHDUFLAG | Total packets | Discarded packets |
| A | 0 | 130 | 0 |
| B | 0 | 130 | 0 |
| C | 0 | 130 | 0 |
| D | 0 | 130 | 0 |
| Mode M9 | |||
|---|---|---|---|
| Quadrant | BADHDUFLAG | Total packets | Discarded packets |
| A | 0 | 15 | 0 |
| B | 0 | 15 | 0 |
| C | 0 | 15 | 0 |
| D | 0 | 16 | 0 |
| Mode M0 | |||
|---|---|---|---|
| Quadrant | BADHDUFLAG | Total packets | Discarded packets |
| A | 0 | 15900 | 3 |
| B | 0 | 16909 | 2 |
| C | 0 | 13701 | 2 |
| D | 0 | 14476 | 2 |
| Quadrant | Total seconds | Saturated seconds | Saturation percentage |
|---|---|---|---|
| A | 6448 | 430 | 6.668734% |
| B | 6448 | 255 | 3.954715% |
| C | 6448 | 56 | 0.868486% |
| D | 6448 | 100 | 1.550868% |
Noise dominated data is calculated using 1-second bins in cleaned event files. If a bin has >2000 counts, and if more than 50% of those come from <1% of pixels, then it is considered to be noise-dominated and hence unusable.
| Quadrant | # 1 sec bins | Bins with >0 counts | Bins with >2000 counts | High rate bins dominated by noise | Noise dominated (total time) | Noise dominated (detector-on time) | Marked lightcurve |
|---|---|---|---|---|---|---|---|
| A | 7623 | 6449 | 314 | 314 | 4.12% | 4.87% | 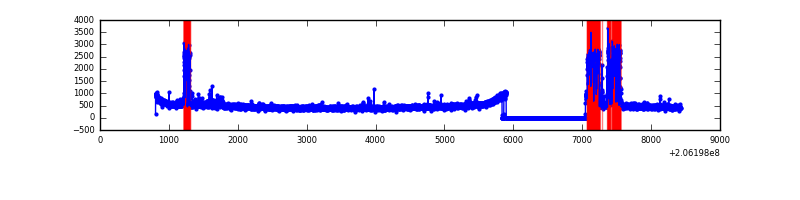 |
| B | 7623 | 6449 | 173 | 173 | 2.27% | 2.68% | 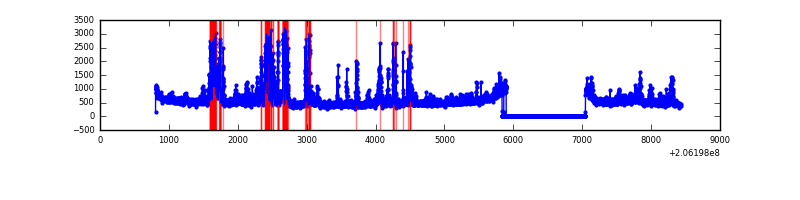 |
| C | 7623 | 6450 | 2 | 2 | 0.03% | 0.03% | 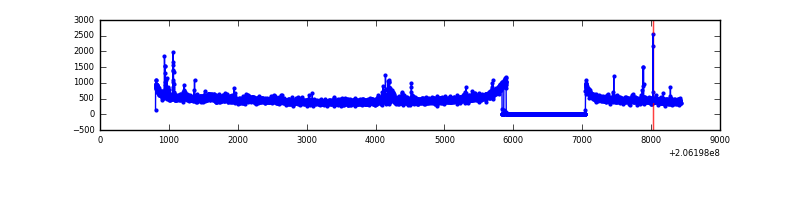 |
| D | 7623 | 6449 | 42 | 42 | 0.55% | 0.65% | 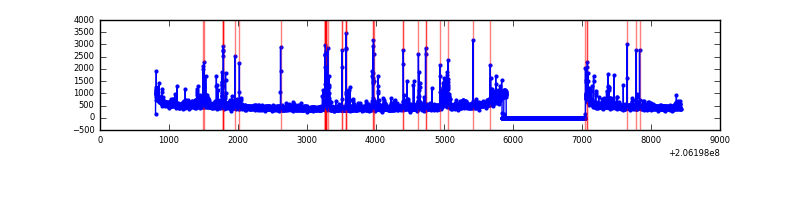 |
Top three noisy pixels from each quadrant. If the there are fewer than three noisy pixels in the level2.evt file, extra rows are filled as -1
| Pixel properties | Quadrant properties | ||||||
|---|---|---|---|---|---|---|---|
| Quadrant | DetID | PixID | Counts | Sigma | Mean | Median | Sigma |
| A | 15 | 234 | 879251 | 5640.68 | 759 | 744 | 155.7 |
| A | 13 | 14 | 21998 | 136.47 | 759 | 744 | 155.7 |
| A | 13 | 248 | 17096 | 104.99 | 759 | 744 | 155.7 |
| B | 14 | 167 | 1059896 | 6995.21 | 785 | 769 | 151.4 |
| B | 15 | 204 | 48844 | 317.52 | 785 | 769 | 151.4 |
| B | 10 | 16 | 34090 | 220.08 | 785 | 769 | 151.4 |
| C | 14 | 67 | 79547 | 445.74 | 755 | 760 | 176.8 |
| C | 9 | 247 | 60284 | 336.76 | 755 | 760 | 176.8 |
| C | 14 | 48 | 23029 | 125.99 | 755 | 760 | 176.8 |
| D | 2 | 136 | 177678 | 961.34 | 760 | 738 | 184.1 |
| D | 14 | 34 | 58858 | 315.77 | 760 | 738 | 184.1 |
| D | 13 | 72 | 37451 | 199.46 | 760 | 738 | 184.1 |
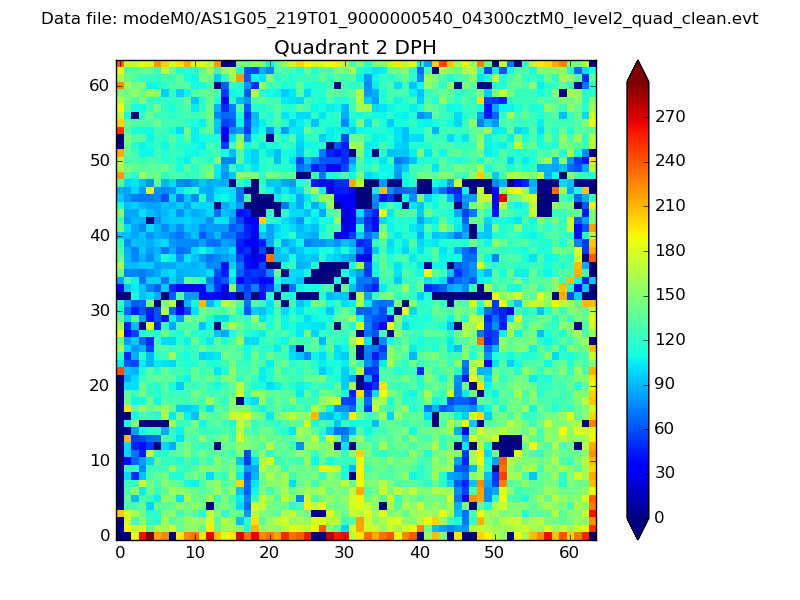
Histogram calculated using DETX and DETY for each event in the final _common_clean file
| Quadrant A | 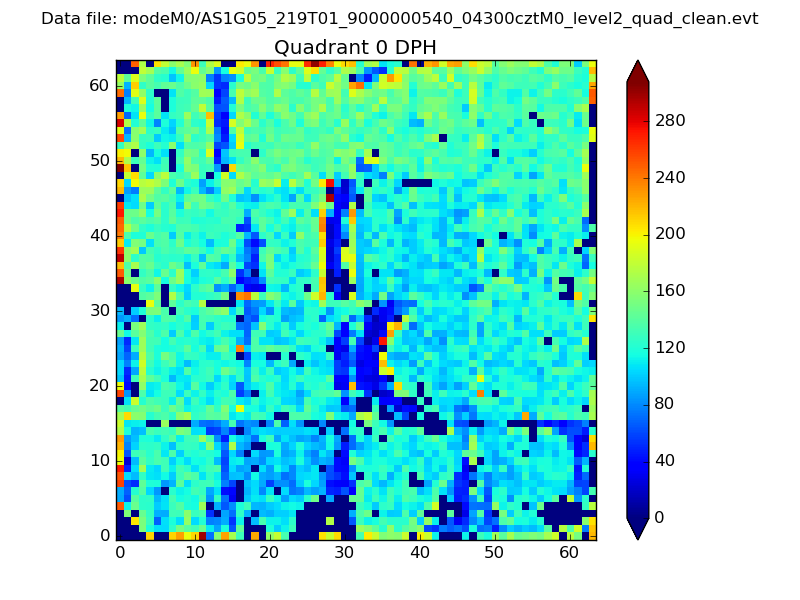 |
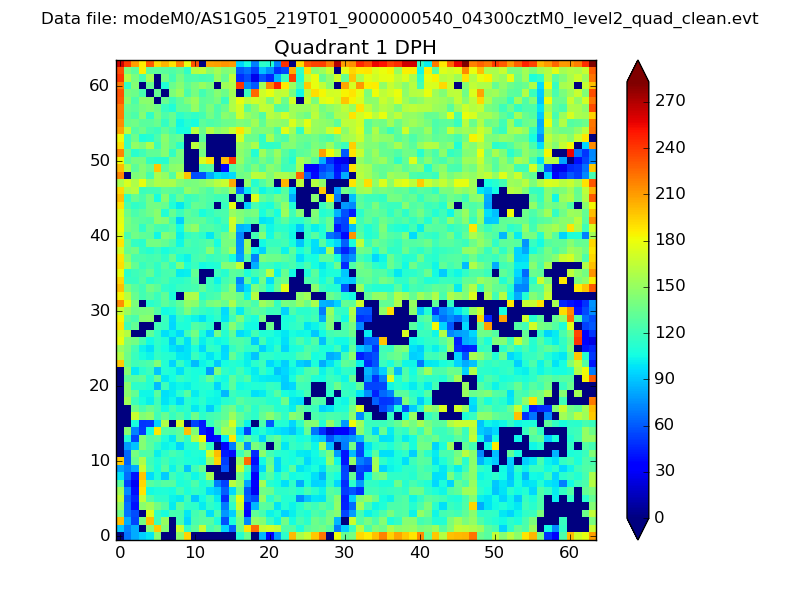 |
Quadrant B |
|---|---|---|---|
| Quadrant D | 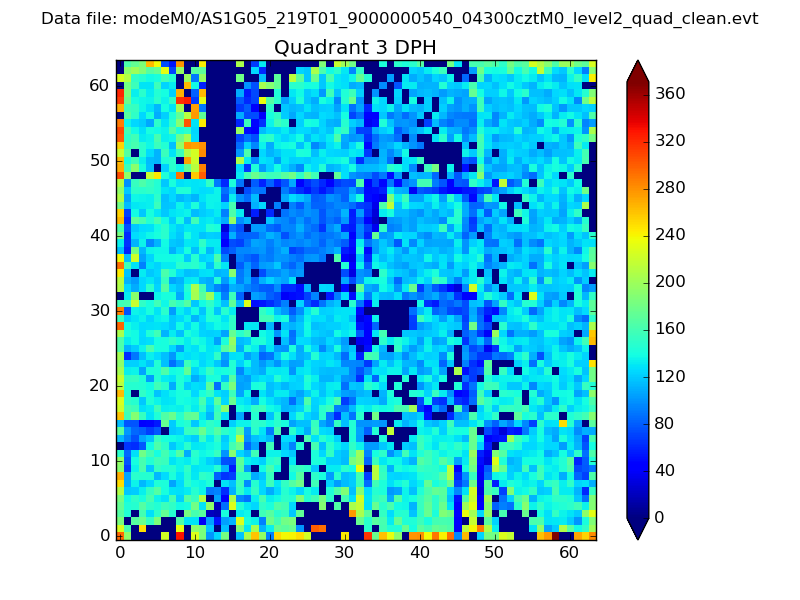 |
 |
Quadrant C |
| Plot type | Count rate plots | Images |
|---|---|---|
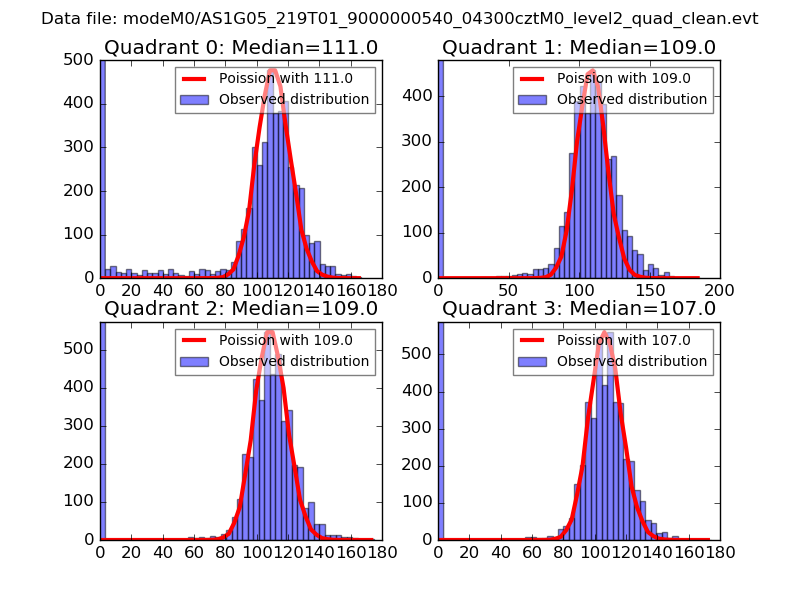
| Comparison with Poisson distribution Blue bars denote a histogram of data divided into 1 sec bins. Red curve is a Poisson curve with rate = median count rate of data. |
 |
 |
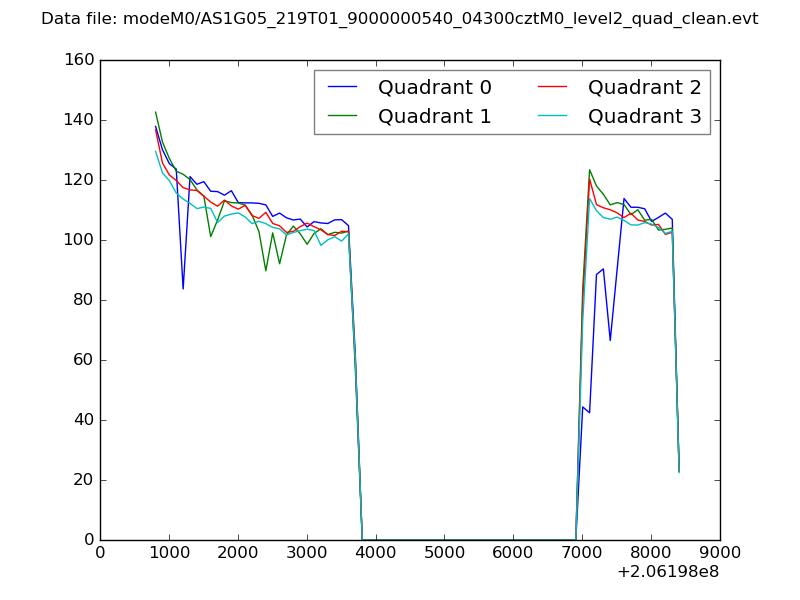
| Quadrant-wise count rates Data is divided into 100 sec bins |
 |
|
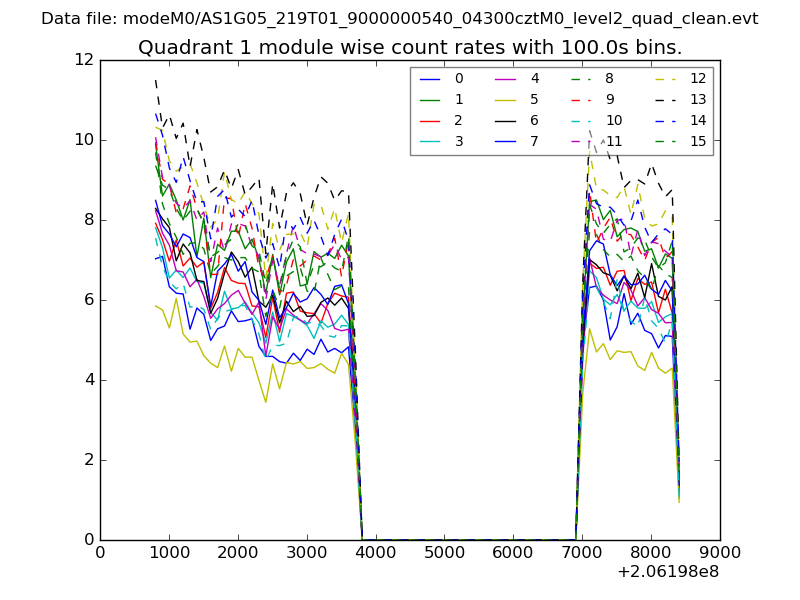
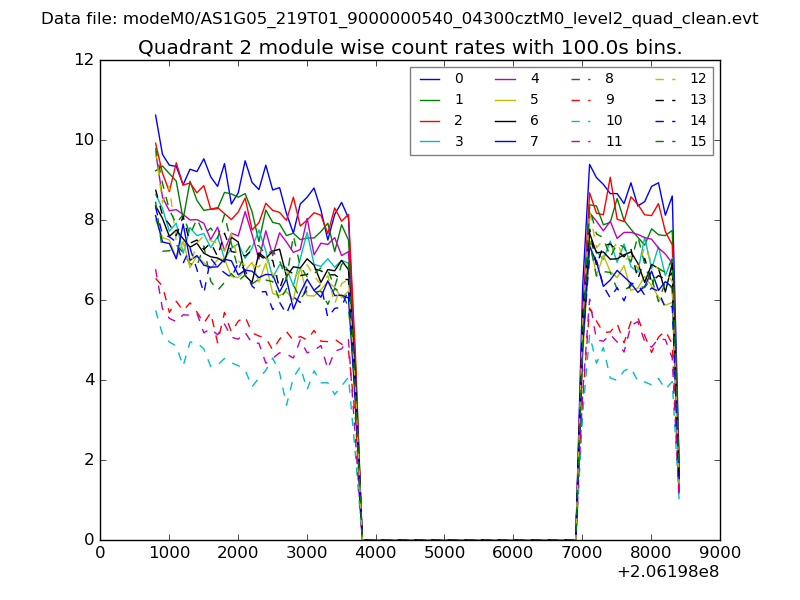
| Module-wise count rates for Quadrant A Data is divided into 100 sec bins |
 |
 |
| Module-wise count rates for Quadrant B Data is divided into 100 sec bins |
 |
 |
| Module-wise count rates for Quadrant C Data is divided into 100 sec bins |
 |
 |
| Module-wise count rates for Quadrant D Data is divided into 100 sec bins |
 |
 |
| Parameter | Plot |
|---|---|
| CZT HV Monitor | 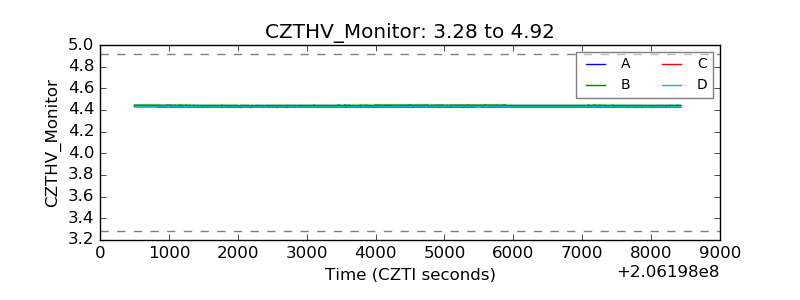 |
| D_VDD | 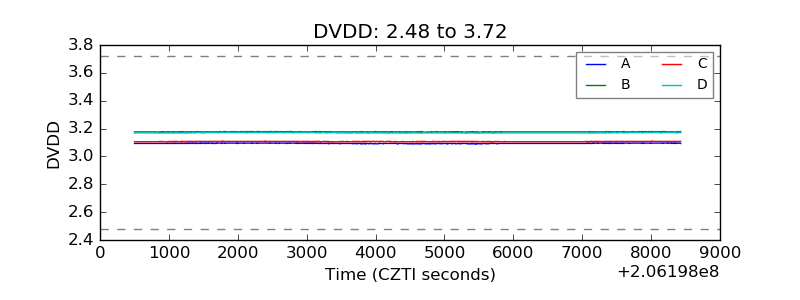 |
| Temperature 1 | 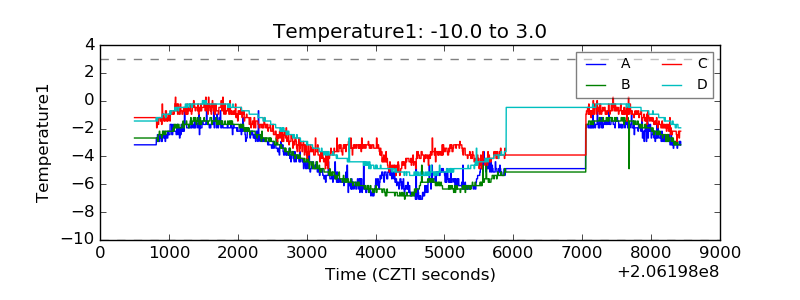 |
| Veto HV Monitor | 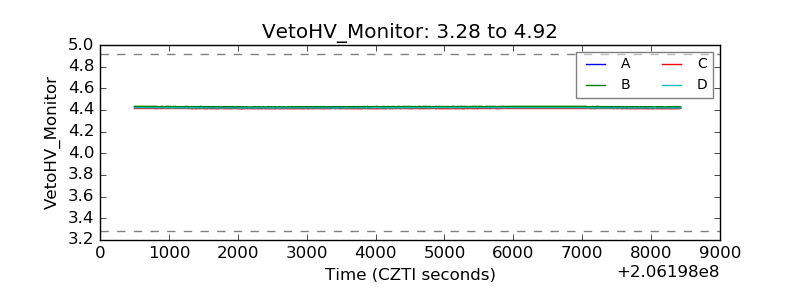 |
| Veto LLD | 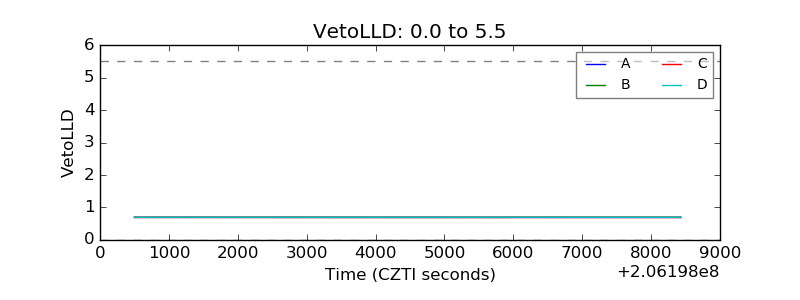 |
| Alpha Counter | 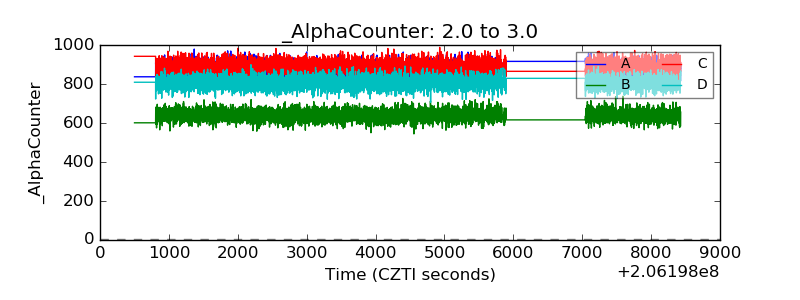 |
| _CPM_Rate | 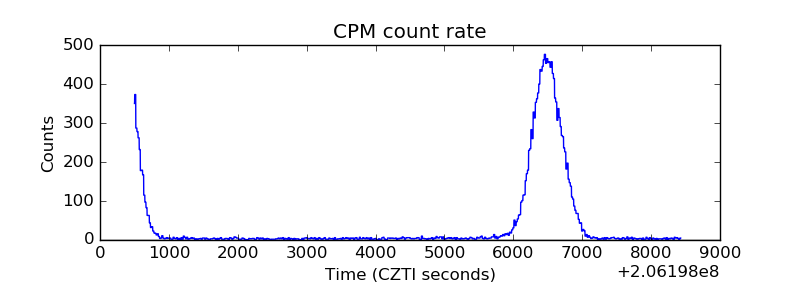 |
| CZT Counter | 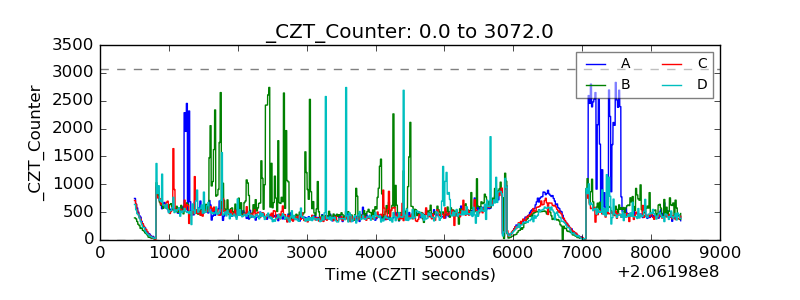 |
| +2.5 Volts monitor |  |
| +5 Volts monitor |  |
| _ROLL_ROT | 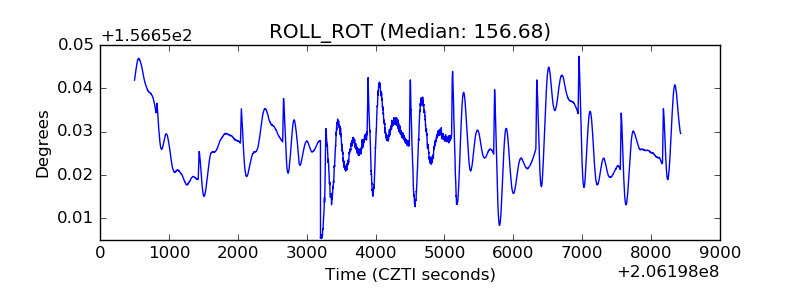 |
| _Roll_DEC | 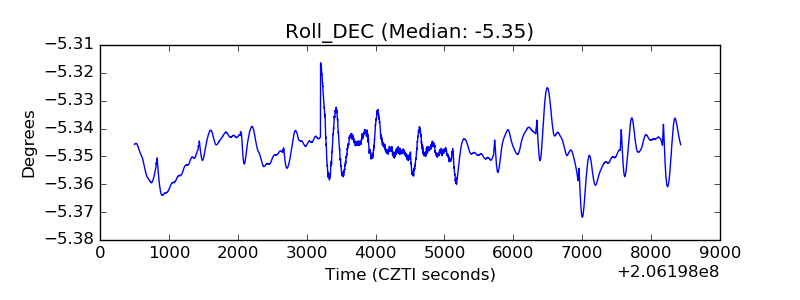 |
| _Roll_RA | 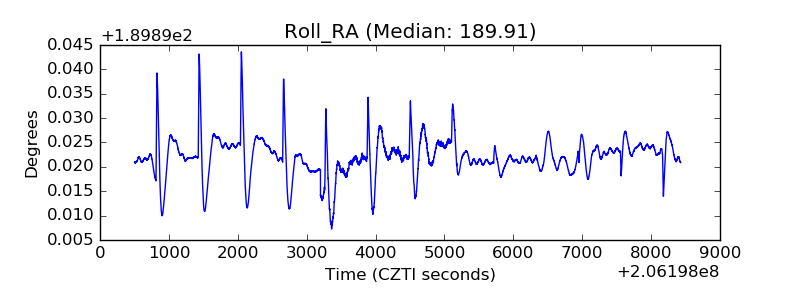 |
| Veto Counter | 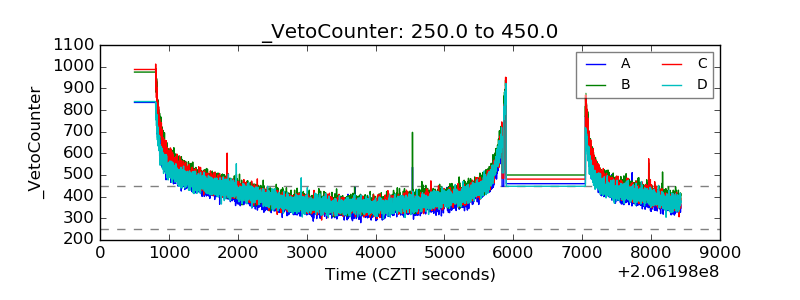 |