| Param | Original file | Final file |
|---|---|---|
| Filename | modeM0/AS1G05_219T01_9000000540_04301cztM0_level2.evt | modeM0/AS1G05_219T01_9000000540_04301cztM0_level2_quad_clean.evt |
| Size (bytes) | 565,986,240 | 76,979,520 |
| Size | 539.8 MB | 73.4 MB |
| Events in quadrant A | 3,871,234 | 470,889 |
| Events in quadrant B | 3,612,251 | 483,660 |
| Events in quadrant C | 3,162,573 | 474,050 |
| Events in quadrant D | 6,040,607 | 435,353 |
| Mode SS | |||
|---|---|---|---|
| Quadrant | BADHDUFLAG | Total packets | Discarded packets |
| A | 0 | 136 | 0 |
| B | 0 | 136 | 0 |
| C | 0 | 136 | 0 |
| D | 0 | 136 | 0 |
| Mode M9 | |||
|---|---|---|---|
| Quadrant | BADHDUFLAG | Total packets | Discarded packets |
| A | 0 | 13 | 0 |
| B | 0 | 13 | 0 |
| C | 0 | 13 | 0 |
| D | 0 | 14 | 0 |
| Mode M0 | |||
|---|---|---|---|
| Quadrant | BADHDUFLAG | Total packets | Discarded packets |
| A | 0 | 16228 | 3 |
| B | 0 | 15280 | 2 |
| C | 0 | 14200 | 2 |
| D | 0 | 22912 | 2 |
| Quadrant | Total seconds | Saturated seconds | Saturation percentage |
|---|---|---|---|
| A | 6693 | 410 | 6.125803% |
| B | 6693 | 123 | 1.837741% |
| C | 6693 | 38 | 0.567757% |
| D | 6693 | 1040 | 15.538622% |
Noise dominated data is calculated using 1-second bins in cleaned event files. If a bin has >2000 counts, and if more than 50% of those come from <1% of pixels, then it is considered to be noise-dominated and hence unusable.
| Quadrant | # 1 sec bins | Bins with >0 counts | Bins with >2000 counts | High rate bins dominated by noise | Noise dominated (total time) | Noise dominated (detector-on time) | Marked lightcurve |
|---|---|---|---|---|---|---|---|
| A | 7603 | 6693 | 308 | 308 | 4.05% | 4.60% | 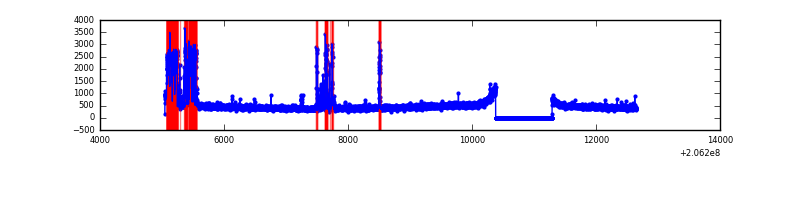 |
| B | 7603 | 6693 | 24 | 24 | 0.32% | 0.36% | 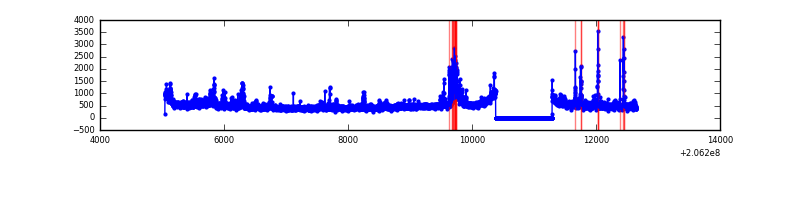 |
| C | 7603 | 6694 | 5 | 5 | 0.07% | 0.07% | 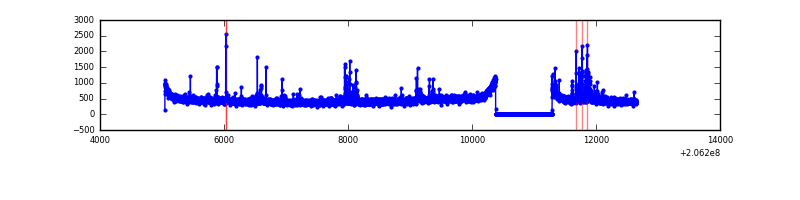 |
| D | 7603 | 6693 | 863 | 863 | 11.35% | 12.89% | 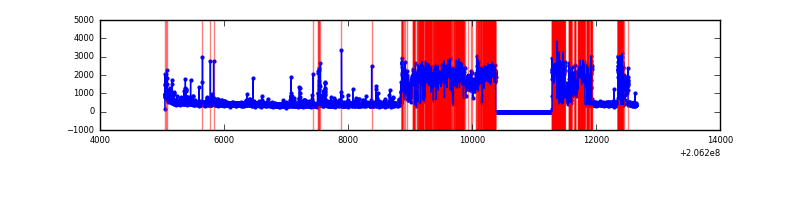 |
Top three noisy pixels from each quadrant. If the there are fewer than three noisy pixels in the level2.evt file, extra rows are filled as -1
| Pixel properties | Quadrant properties | ||||||
|---|---|---|---|---|---|---|---|
| Quadrant | DetID | PixID | Counts | Sigma | Mean | Median | Sigma |
| A | 15 | 234 | 793753 | 5005.99 | 767 | 752 | 158.4 |
| A | 0 | 50 | 87437 | 547.22 | 767 | 752 | 158.4 |
| A | 13 | 14 | 15175 | 91.05 | 767 | 752 | 158.4 |
| B | 14 | 167 | 171209 | 1104.39 | 795 | 778 | 154.3 |
| B | 7 | 252 | 124439 | 801.32 | 795 | 778 | 154.3 |
| B | 10 | 16 | 71987 | 461.44 | 795 | 778 | 154.3 |
| C | 9 | 247 | 158273 | 884.21 | 763 | 770 | 178.1 |
| C | 10 | 65 | 8002 | 40.6 | 763 | 770 | 178.1 |
| C | 14 | 67 | 6467 | 31.98 | 763 | 770 | 178.1 |
| D | 13 | 53 | 2638615 | 14998.39 | 720 | 699 | 175.9 |
| D | 2 | 136 | 503265 | 2857.43 | 720 | 699 | 175.9 |
| D | 12 | 22 | 36423 | 203.11 | 720 | 699 | 175.9 |
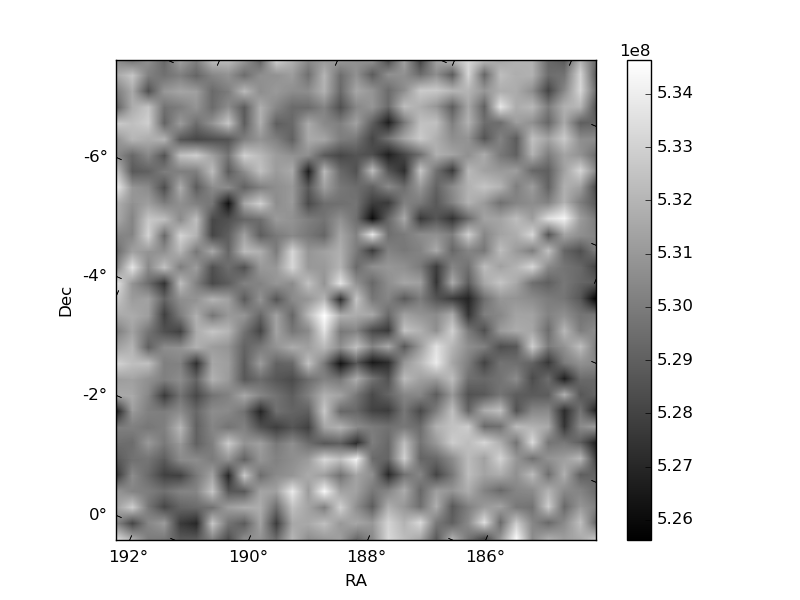
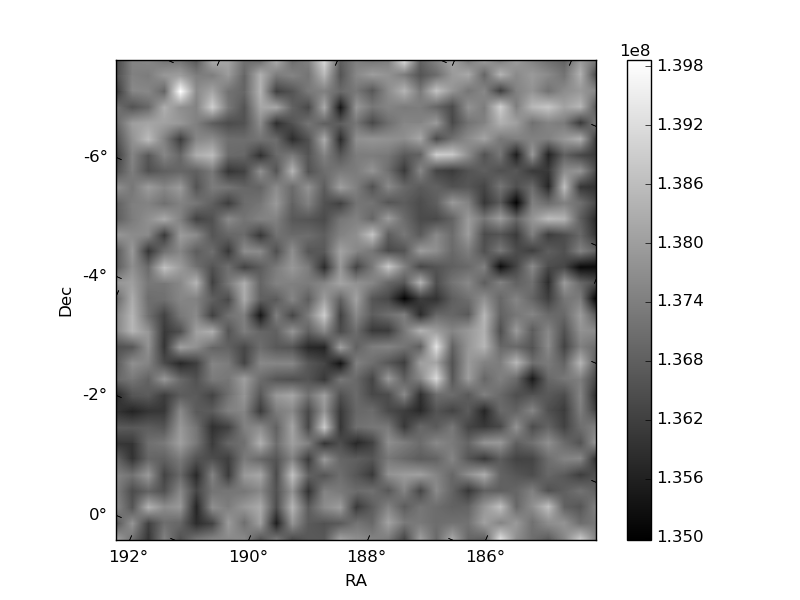
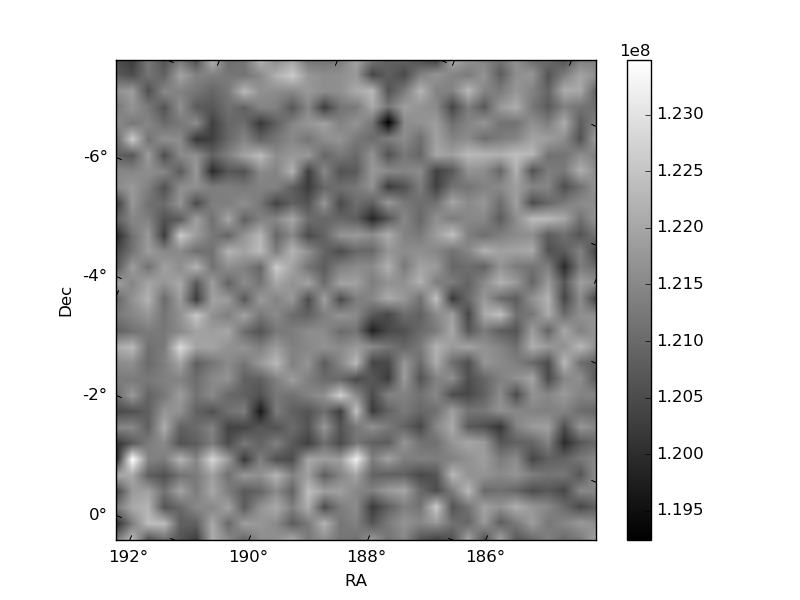
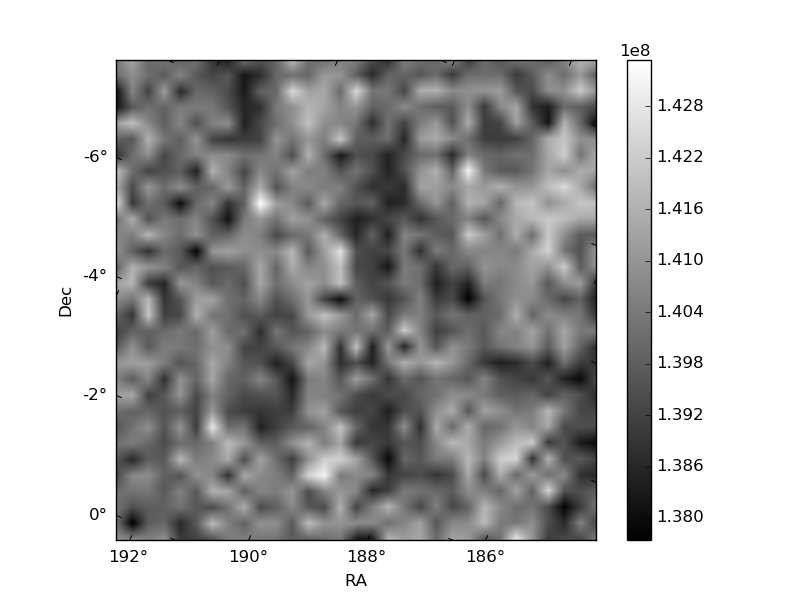
Histogram calculated using DETX and DETY for each event in the final _common_clean file
| Quadrant A | 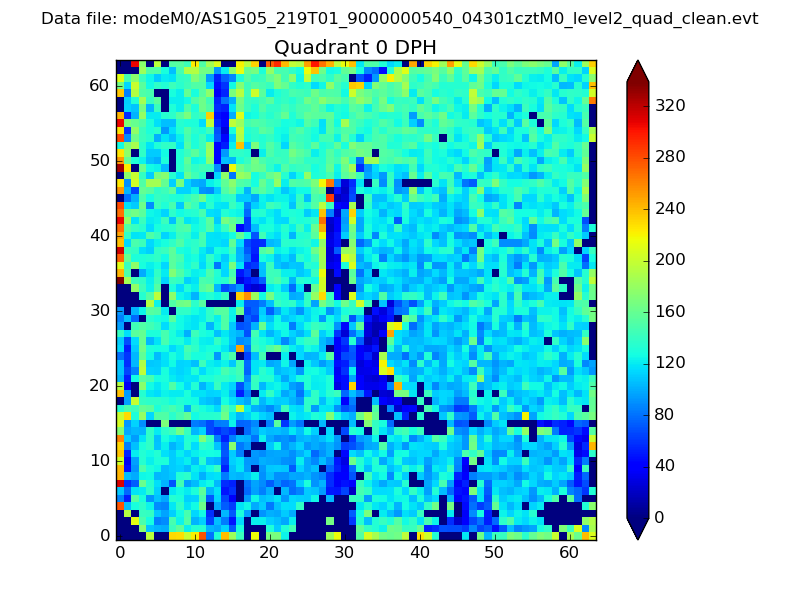 |
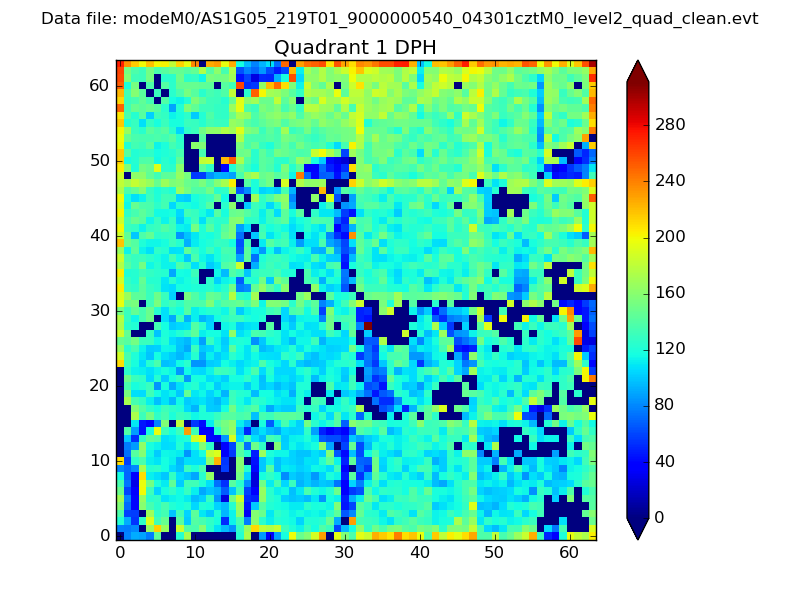 |
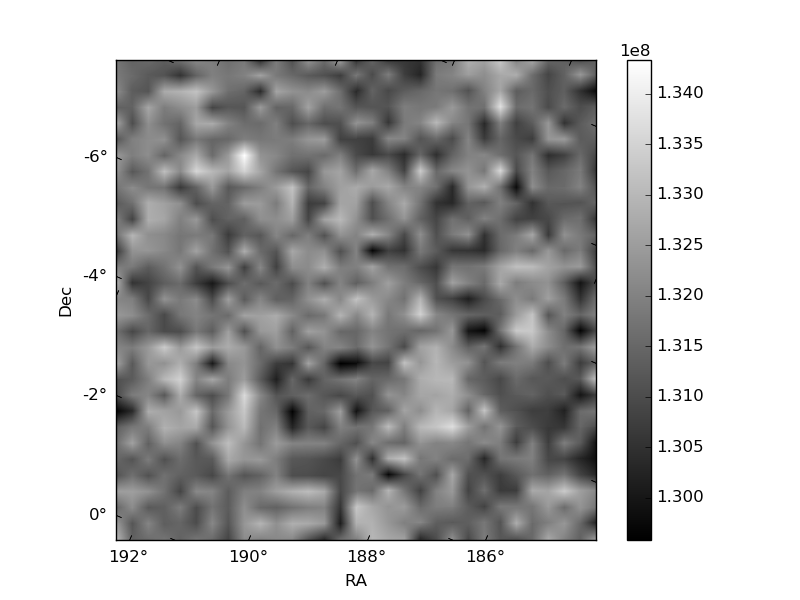
Quadrant B |
|---|---|---|---|
| Quadrant D | 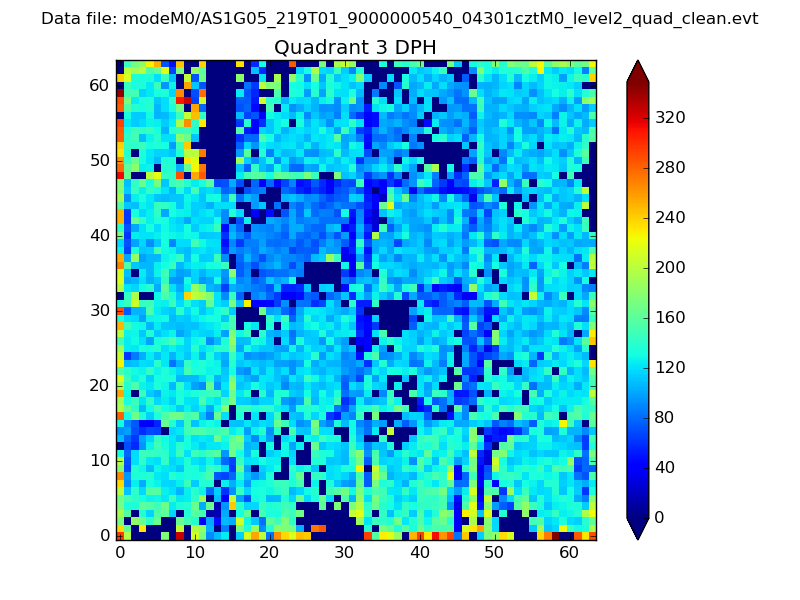 |
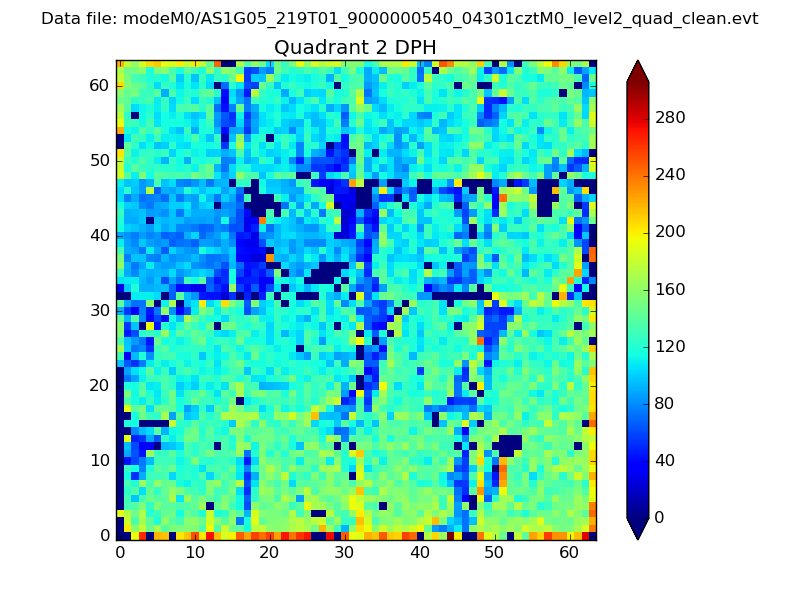 |
Quadrant C |
| Plot type | Count rate plots | Images |
|---|---|---|
| Comparison with Poisson distribution Blue bars denote a histogram of data divided into 1 sec bins. Red curve is a Poisson curve with rate = median count rate of data. |
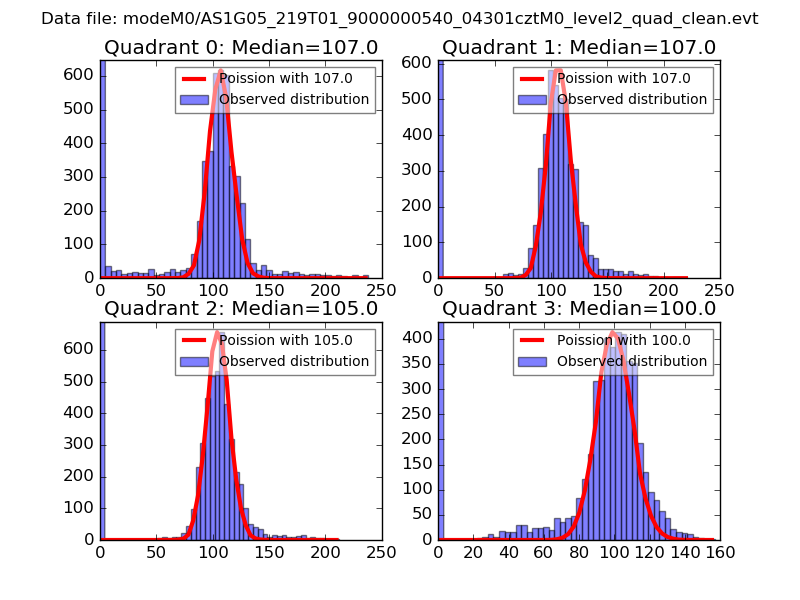 |
 |
| Quadrant-wise count rates Data is divided into 100 sec bins |
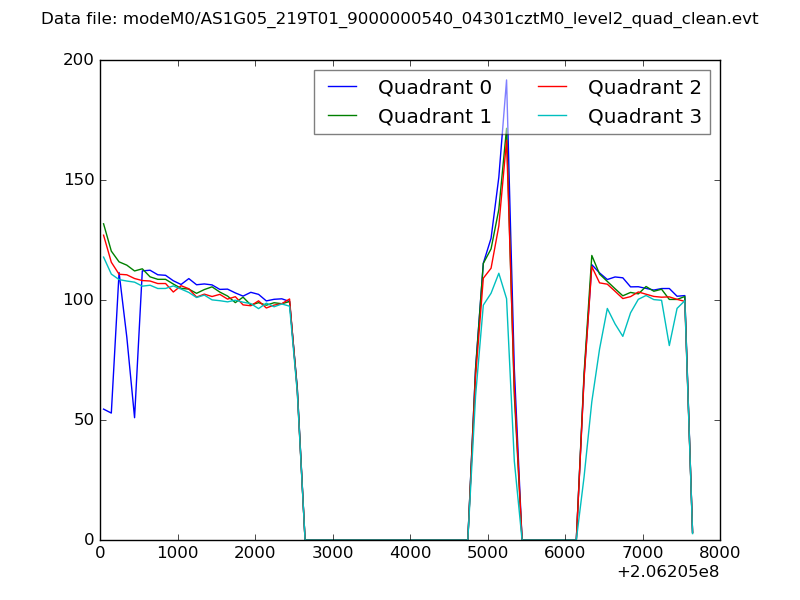 |
|
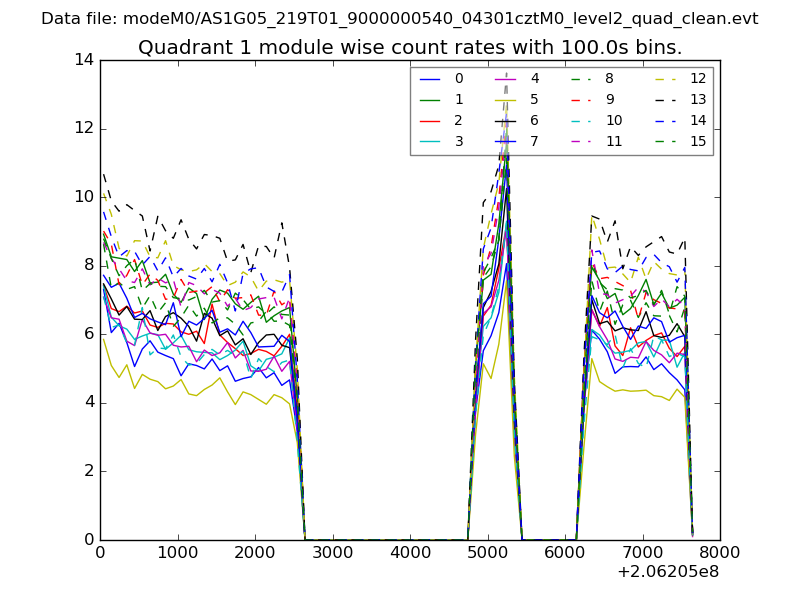
| Module-wise count rates for Quadrant A Data is divided into 100 sec bins |
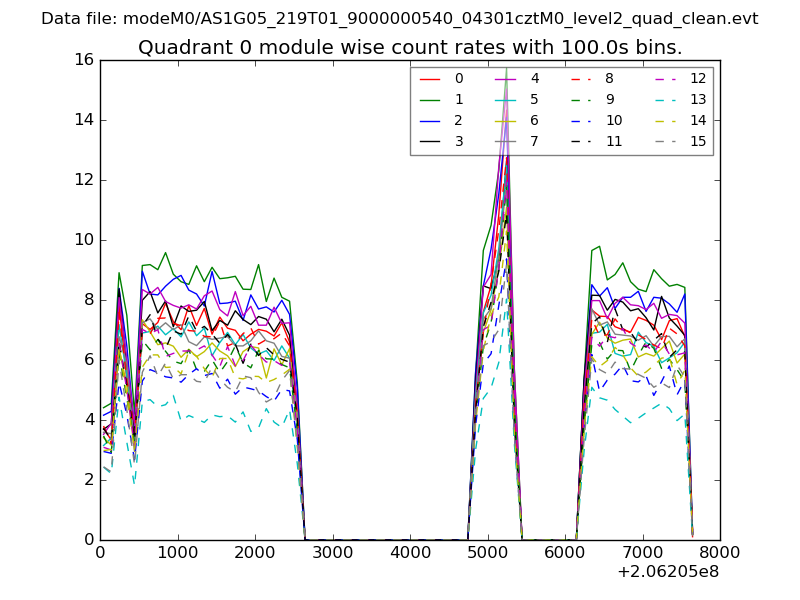 |
 |
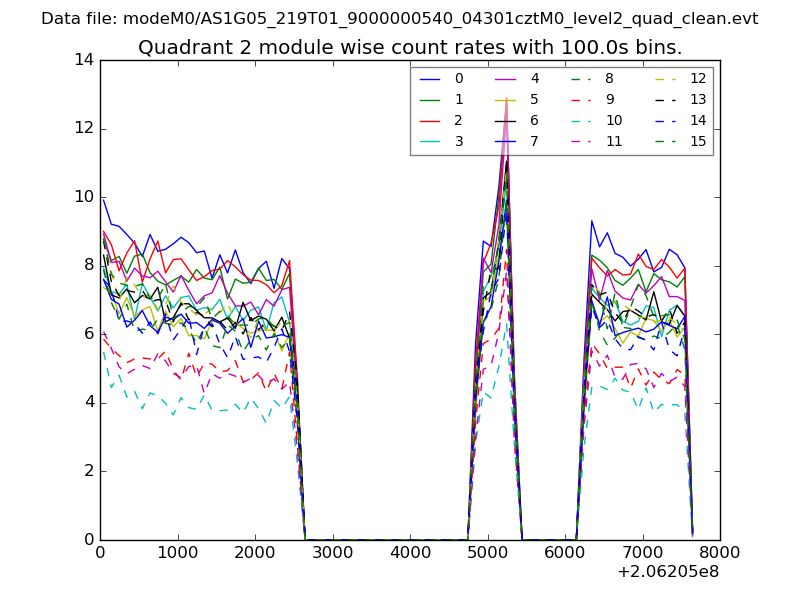
| Module-wise count rates for Quadrant B Data is divided into 100 sec bins |
 |
 |
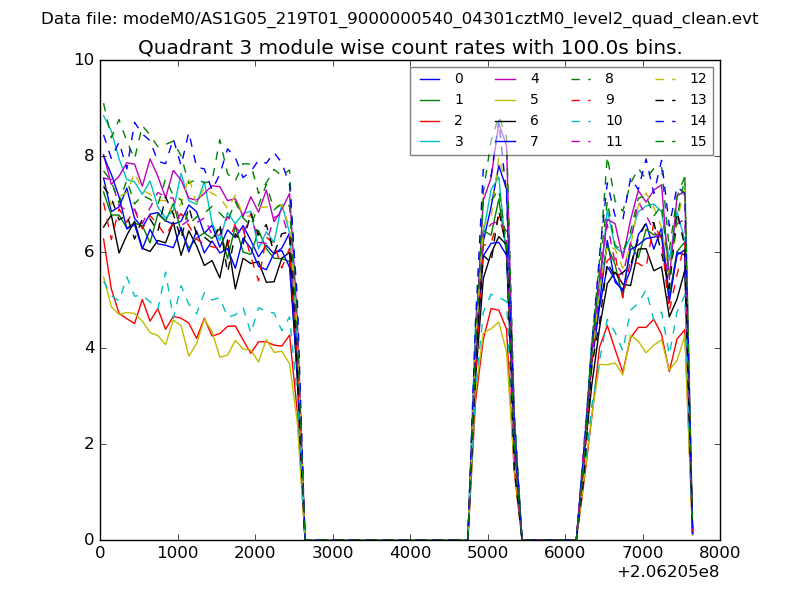
| Module-wise count rates for Quadrant C Data is divided into 100 sec bins |
 |
 |
| Module-wise count rates for Quadrant D Data is divided into 100 sec bins |
 |
 |
| Parameter | Plot |
|---|---|
| CZT HV Monitor | 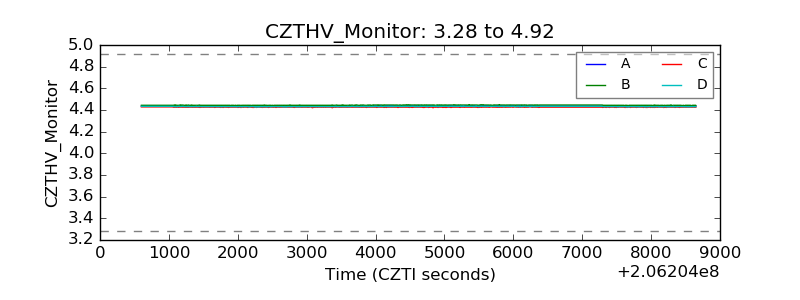 |
| D_VDD | 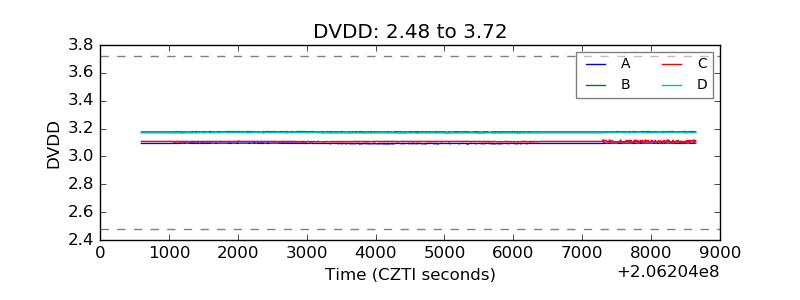 |
| Temperature 1 | 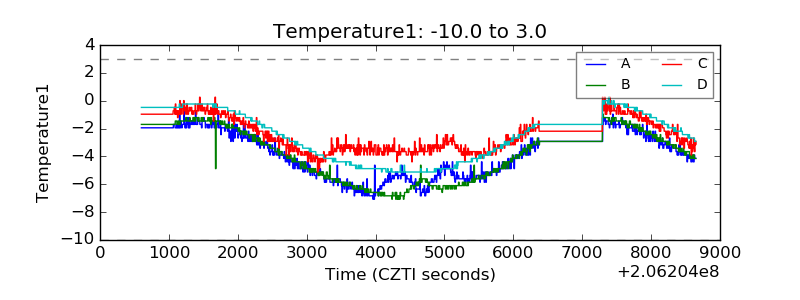 |
| Veto HV Monitor | 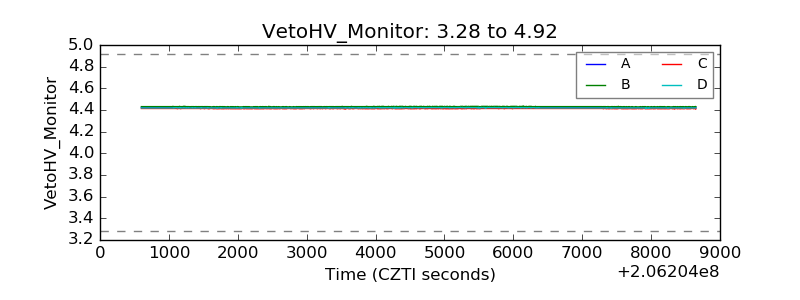 |
| Veto LLD | 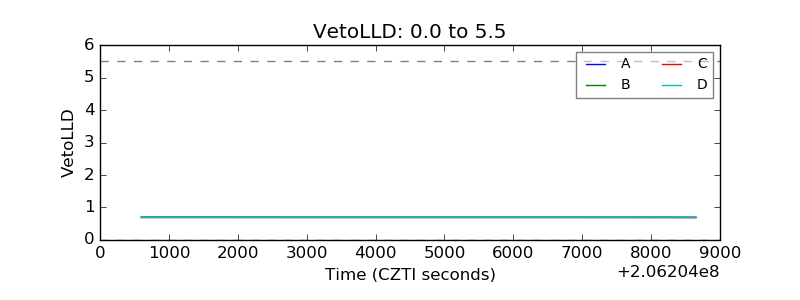 |
| Alpha Counter | 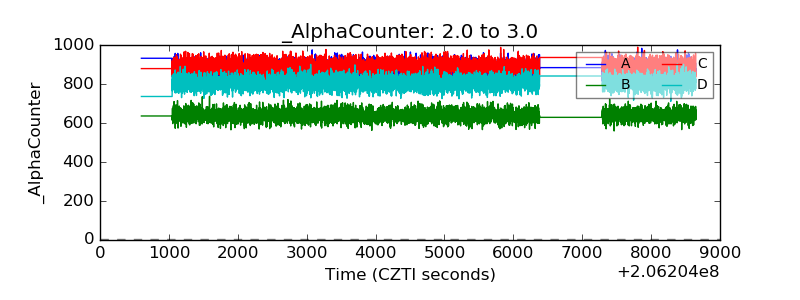 |
| _CPM_Rate | 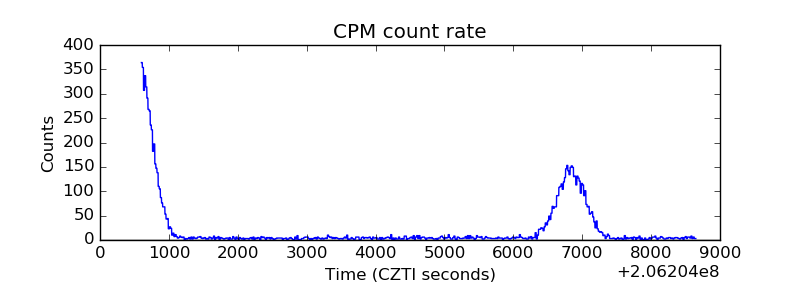 |
| CZT Counter | 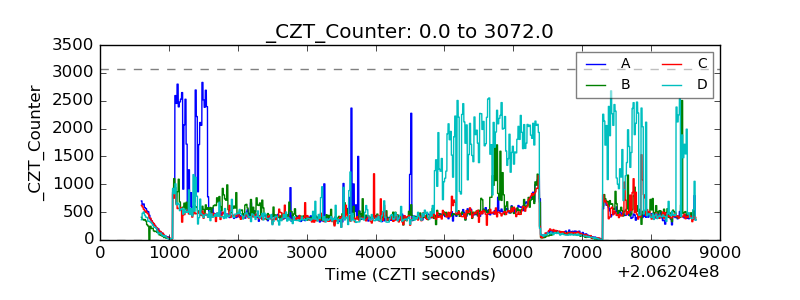 |
| +2.5 Volts monitor | 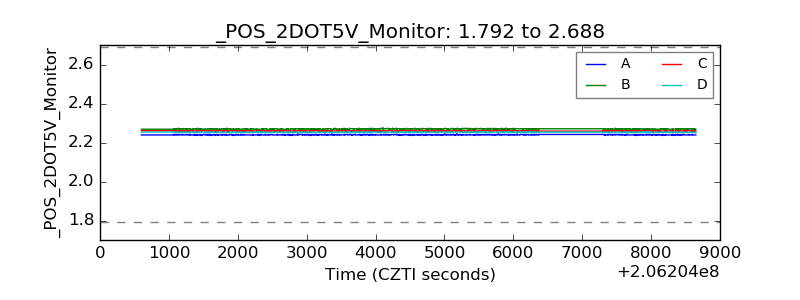 |
| +5 Volts monitor |  |
| _ROLL_ROT | 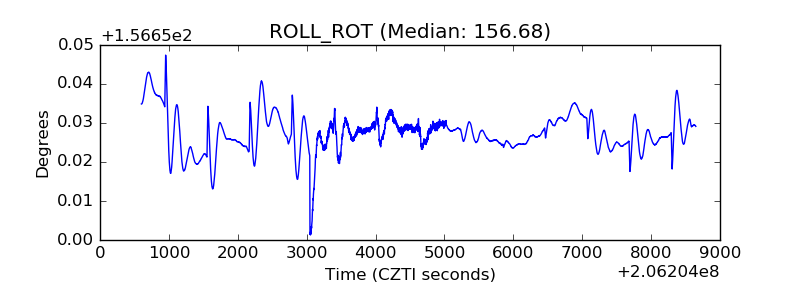 |
| _Roll_DEC | 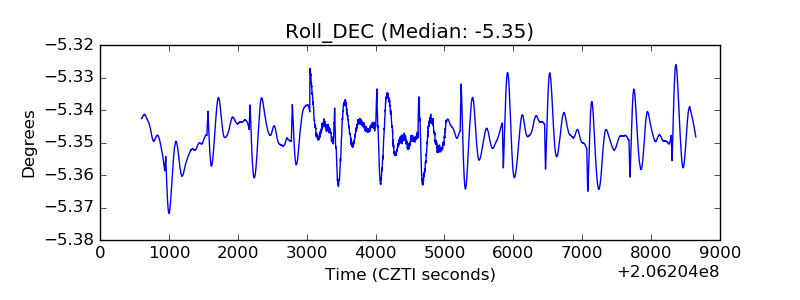 |
| _Roll_RA | 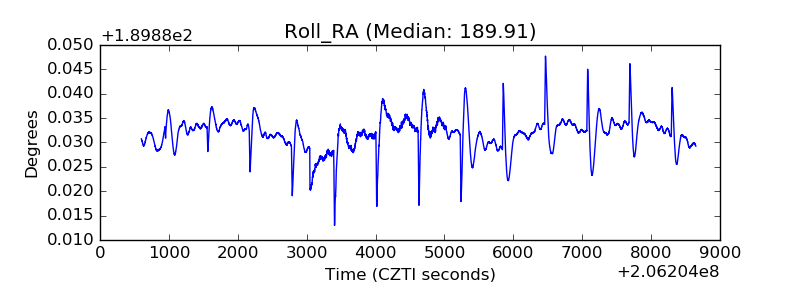 |
| Veto Counter | 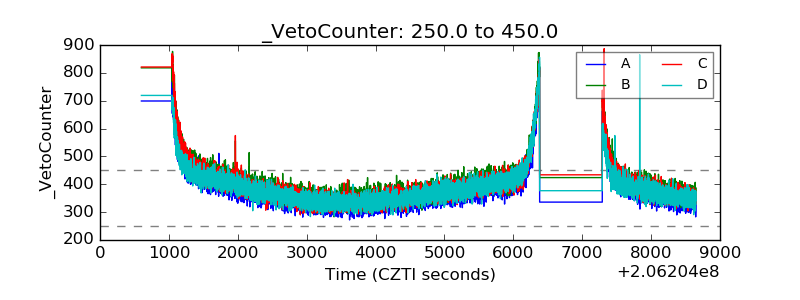 |