| Param | Original file | Final file |
|---|---|---|
| Filename | modeM0/AS1G05_219T01_9000000540_04302cztM0_level2.evt | modeM0/AS1G05_219T01_9000000540_04302cztM0_level2_quad_clean.evt |
| Size (bytes) | 589,812,480 | 84,597,120 |
| Size | 562.5 MB | 80.7 MB |
| Events in quadrant A | 3,469,777 | 534,114 |
| Events in quadrant B | 3,603,954 | 527,638 |
| Events in quadrant C | 3,318,168 | 520,898 |
| Events in quadrant D | 6,977,354 | 472,160 |
| Mode SS | |||
|---|---|---|---|
| Quadrant | BADHDUFLAG | Total packets | Discarded packets |
| A | 0 | 152 | 0 |
| B | 0 | 152 | 0 |
| C | 0 | 152 | 0 |
| D | 0 | 152 | 0 |
| Mode M9 | |||
|---|---|---|---|
| Quadrant | BADHDUFLAG | Total packets | Discarded packets |
| A | 0 | 13 | 0 |
| B | 0 | 13 | 0 |
| C | 0 | 13 | 0 |
| D | 0 | 13 | 0 |
| Mode M0 | |||
|---|---|---|---|
| Quadrant | BADHDUFLAG | Total packets | Discarded packets |
| A | 0 | 15430 | 5 |
| B | 0 | 15733 | 4 |
| C | 0 | 15172 | 4 |
| D | 0 | 25932 | 4 |
| Quadrant | Total seconds | Saturated seconds | Saturation percentage |
|---|---|---|---|
| A | 7267 | 103 | 1.417366% |
| B | 7267 | 89 | 1.224714% |
| C | 7267 | 42 | 0.577955% |
| D | 7267 | 980 | 13.485620% |
Noise dominated data is calculated using 1-second bins in cleaned event files. If a bin has >2000 counts, and if more than 50% of those come from <1% of pixels, then it is considered to be noise-dominated and hence unusable.
| Quadrant | # 1 sec bins | Bins with >0 counts | Bins with >2000 counts | High rate bins dominated by noise | Noise dominated (total time) | Noise dominated (detector-on time) | Marked lightcurve |
|---|---|---|---|---|---|---|---|
| A | 8697 | 7271 | 24 | 24 | 0.28% | 0.33% |  |
| B | 8697 | 7271 | 15 | 15 | 0.17% | 0.21% |  |
| C | 8697 | 7272 | 3 | 3 | 0.03% | 0.04% |  |
| D | 8697 | 7270 | 886 | 886 | 10.19% | 12.19% | 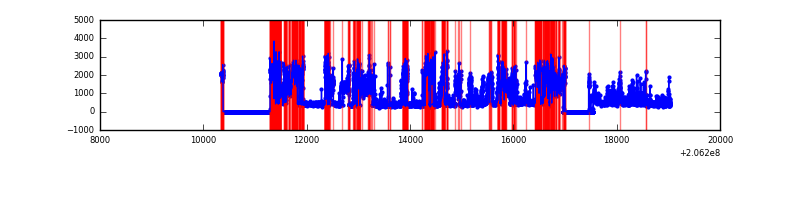 |
Top three noisy pixels from each quadrant. If the there are fewer than three noisy pixels in the level2.evt file, extra rows are filled as -1
| Pixel properties | Quadrant properties | ||||||
|---|---|---|---|---|---|---|---|
| Quadrant | DetID | PixID | Counts | Sigma | Mean | Median | Sigma |
| A | 15 | 234 | 73479 | 420.64 | 843 | 824 | 172.7 |
| A | 0 | 50 | 58635 | 334.7 | 843 | 824 | 172.7 |
| A | 13 | 251 | 29943 | 168.58 | 843 | 824 | 172.7 |
| B | 14 | 167 | 75658 | 452.5 | 850 | 831 | 165.4 |
| B | 7 | 252 | 62355 | 372.06 | 850 | 831 | 165.4 |
| B | 10 | 16 | 45016 | 267.2 | 850 | 831 | 165.4 |
| C | 9 | 247 | 98373 | 511.97 | 813 | 816 | 190.6 |
| C | 8 | 128 | 18935 | 95.09 | 813 | 816 | 190.6 |
| C | 8 | 112 | 10479 | 50.71 | 813 | 816 | 190.6 |
| D | 13 | 53 | 3651800 | 19158.43 | 777 | 756 | 190.6 |
| D | 2 | 136 | 181594 | 948.93 | 777 | 756 | 190.6 |
| D | 13 | 223 | 48228 | 249.1 | 777 | 756 | 190.6 |
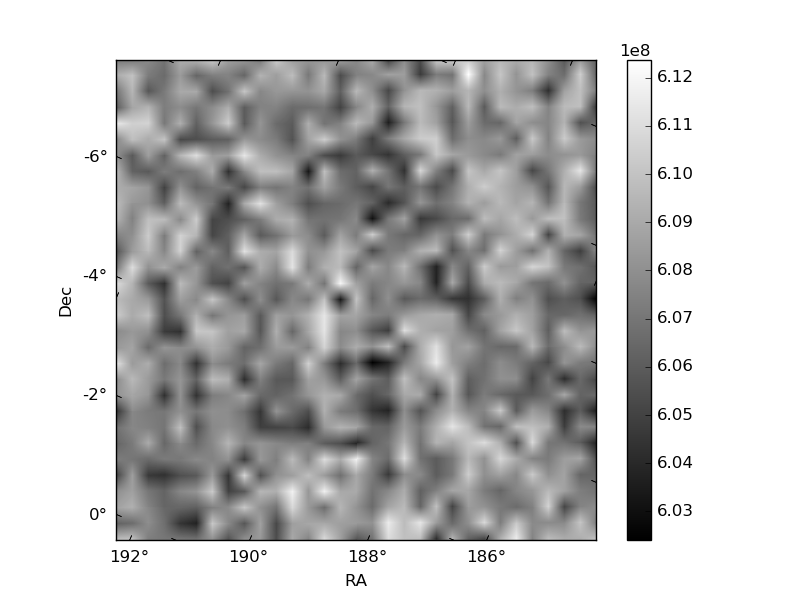
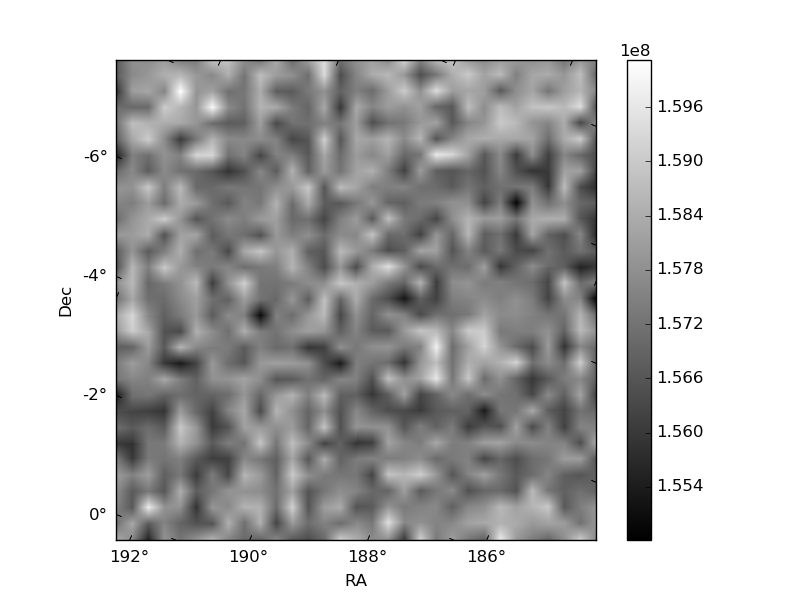
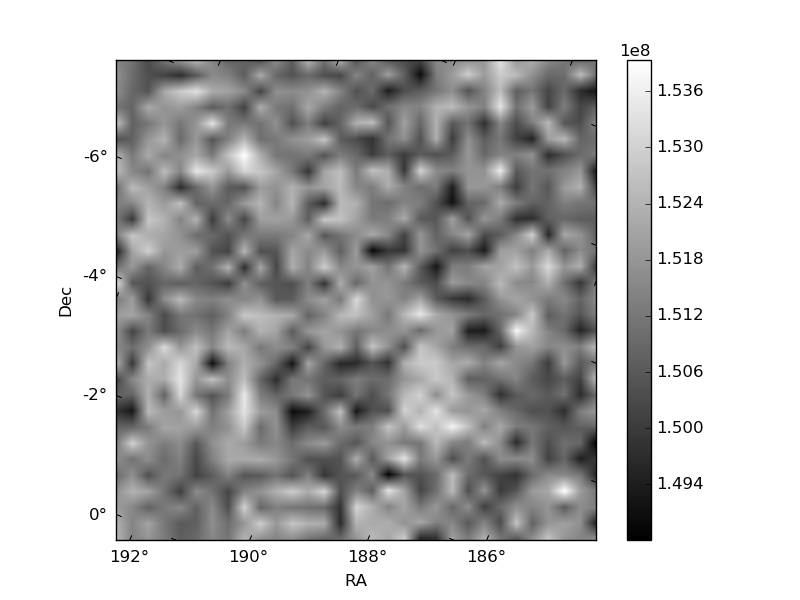
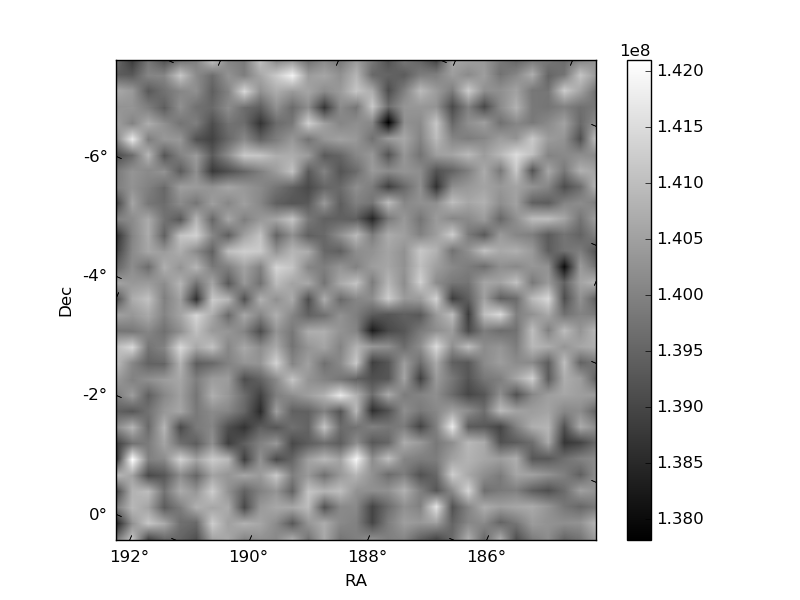
Histogram calculated using DETX and DETY for each event in the final _common_clean file
| Quadrant A | 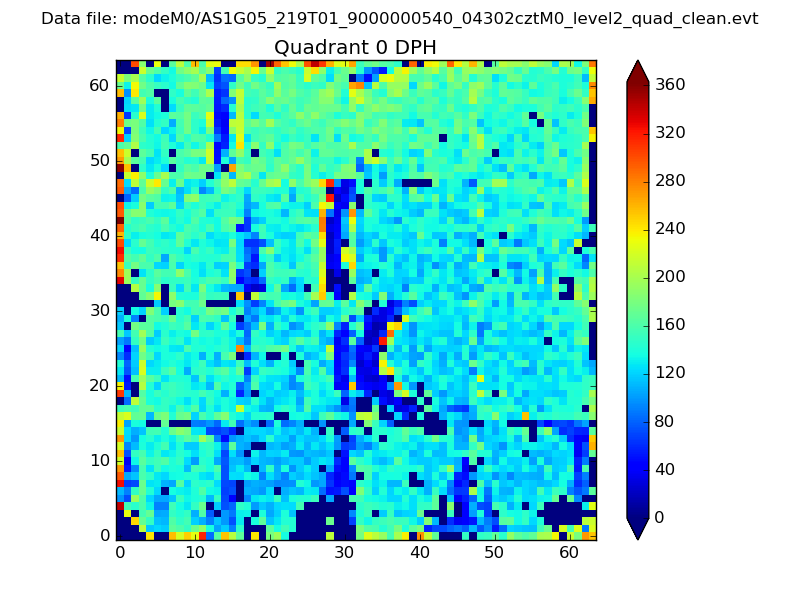 |
 |
Quadrant B |
|---|---|---|---|
| Quadrant D | 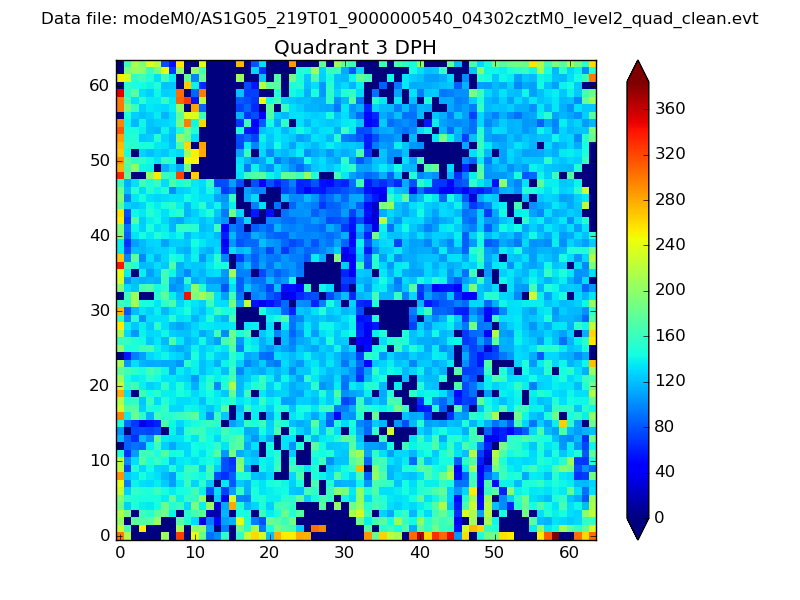 |
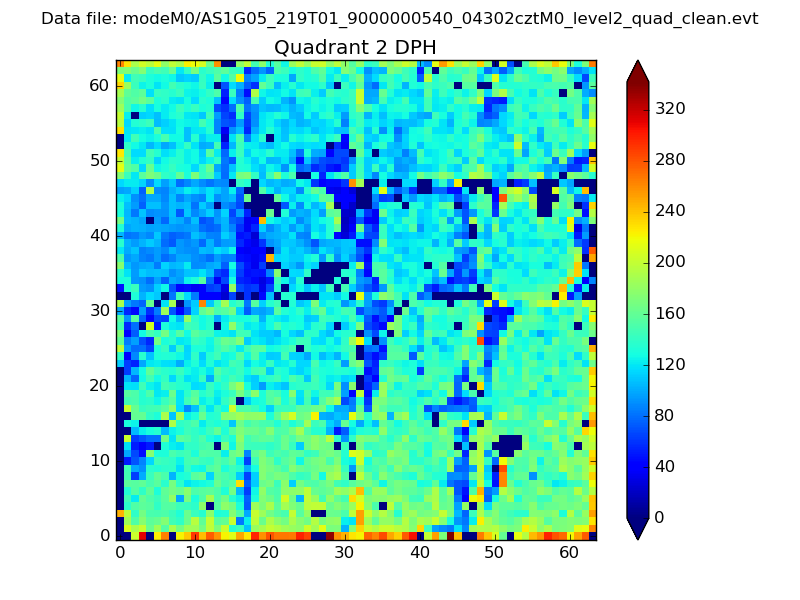 |
Quadrant C |
| Plot type | Count rate plots | Images |
|---|---|---|
| Comparison with Poisson distribution Blue bars denote a histogram of data divided into 1 sec bins. Red curve is a Poisson curve with rate = median count rate of data. |
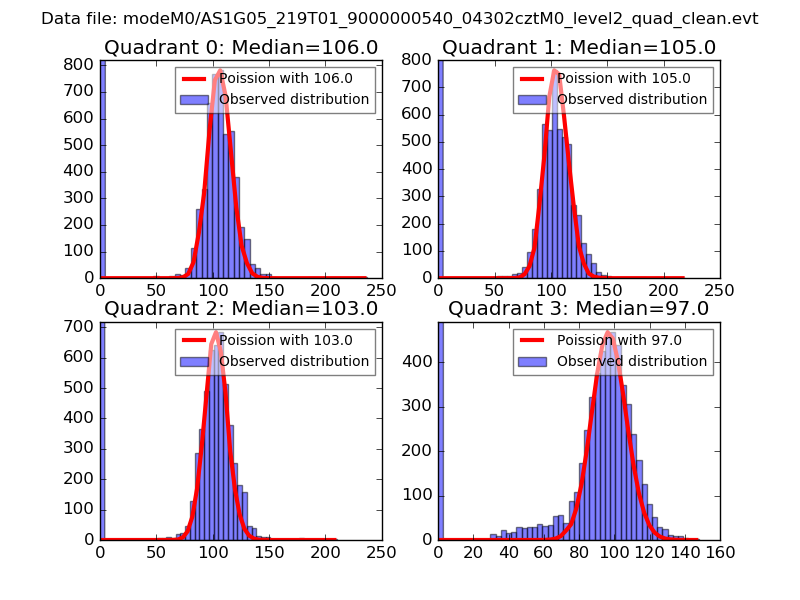 |
 |
| Quadrant-wise count rates Data is divided into 100 sec bins |
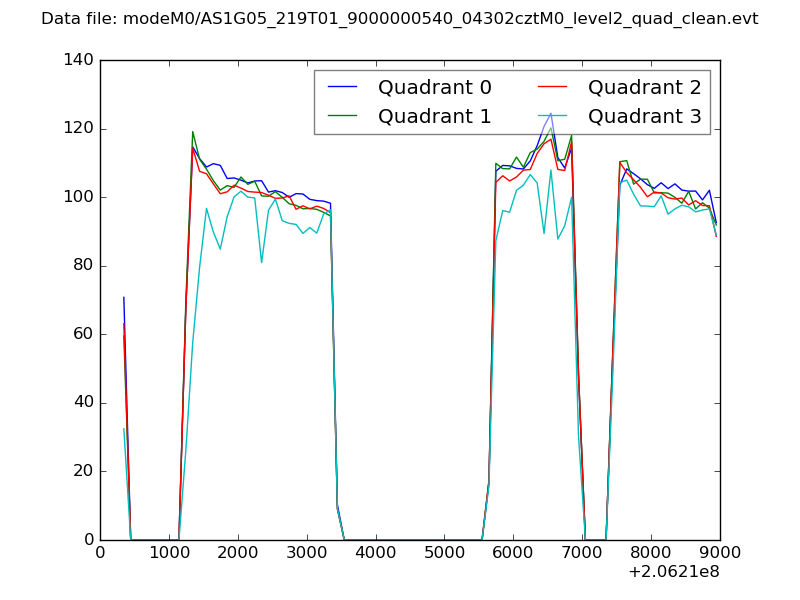 |
|
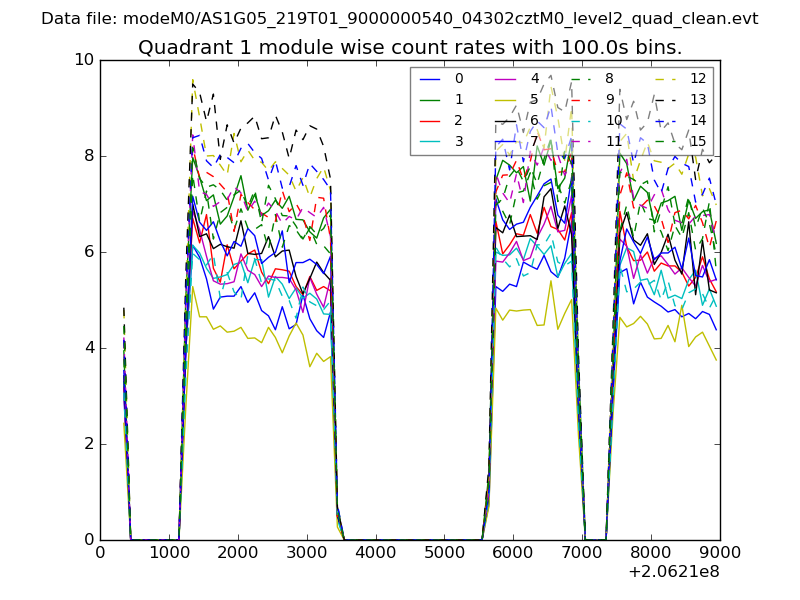
| Module-wise count rates for Quadrant A Data is divided into 100 sec bins |
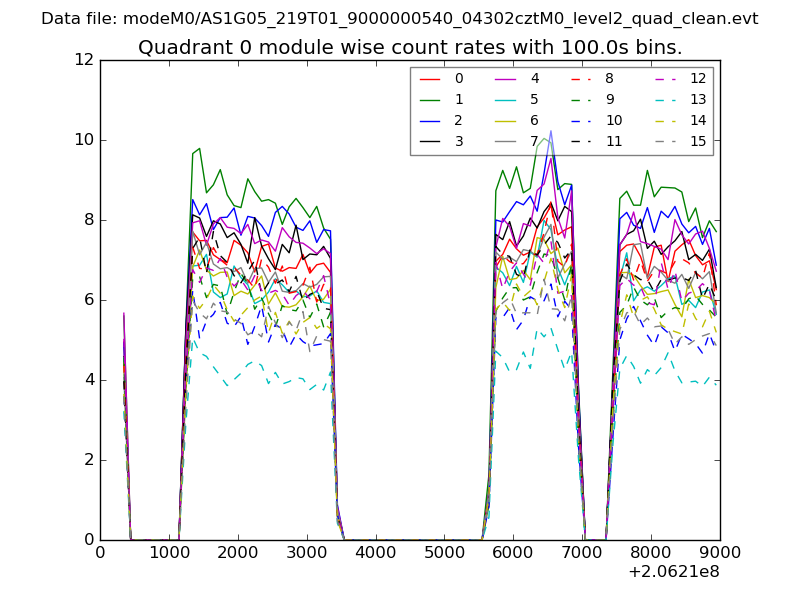 |
 |
| Module-wise count rates for Quadrant B Data is divided into 100 sec bins |
 |
 |
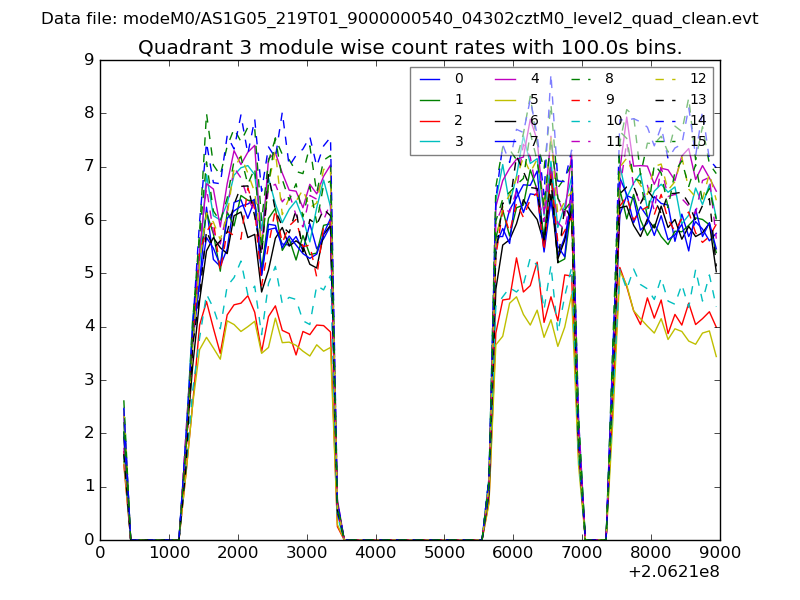
| Module-wise count rates for Quadrant C Data is divided into 100 sec bins |
 |
 |
| Module-wise count rates for Quadrant D Data is divided into 100 sec bins |
 |
 |
| Parameter | Plot |
|---|---|
| CZT HV Monitor | 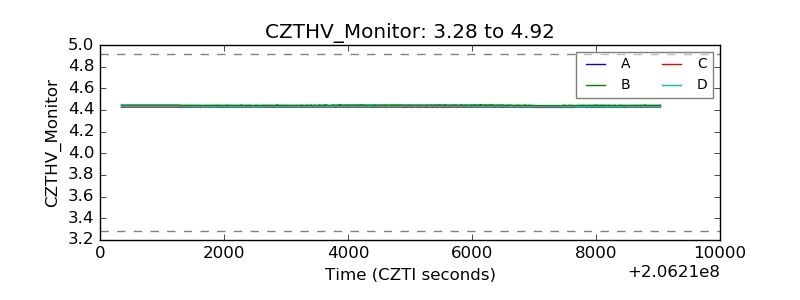 |
| D_VDD | 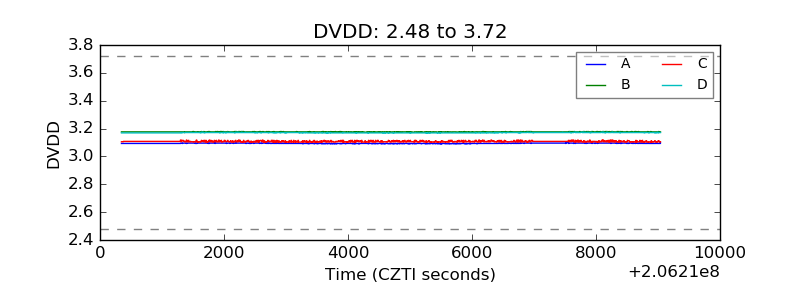 |
| Temperature 1 | 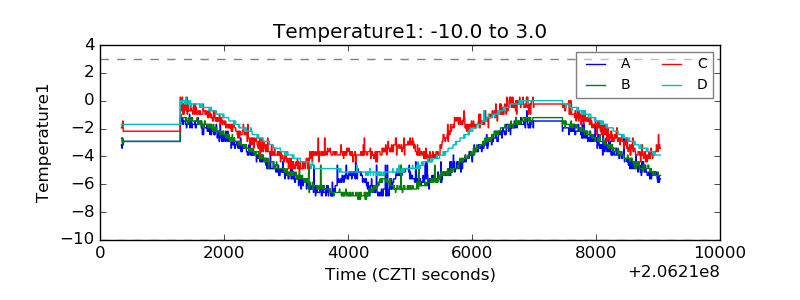 |
| Veto HV Monitor | 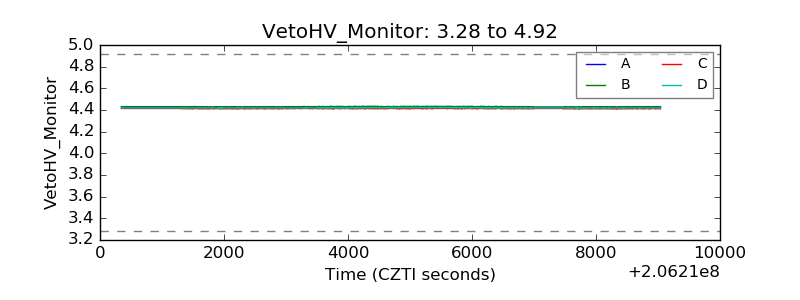 |
| Veto LLD | 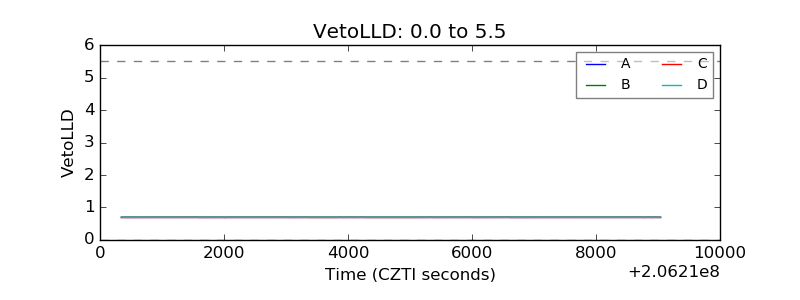 |
| Alpha Counter | 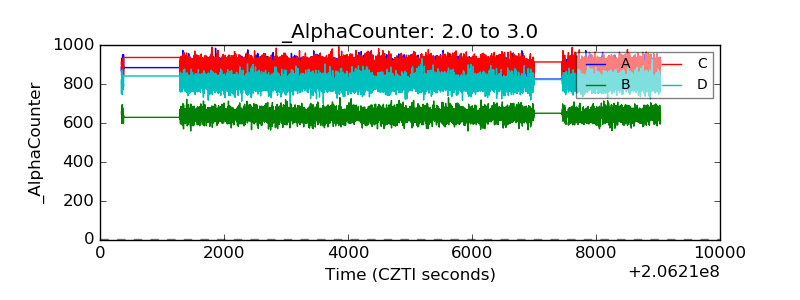 |
| _CPM_Rate | 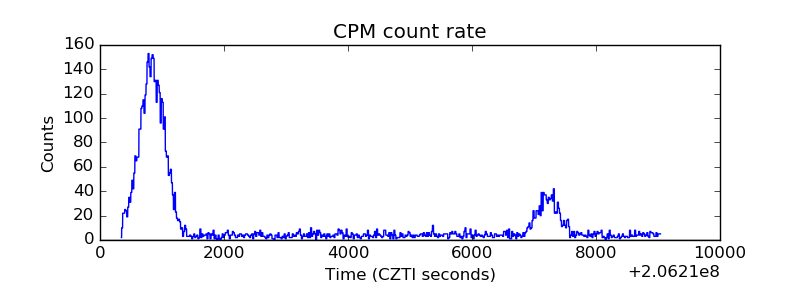 |
| CZT Counter | 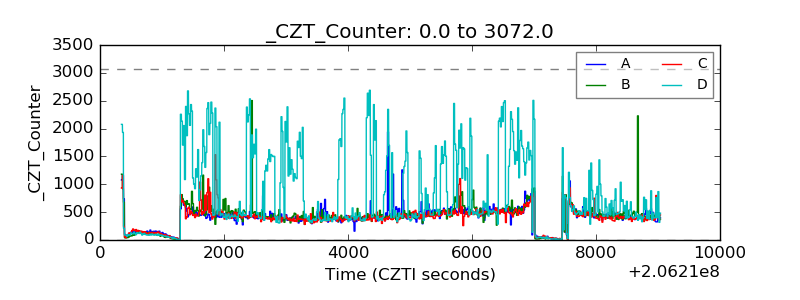 |
| +2.5 Volts monitor |  |
| +5 Volts monitor |  |
| _ROLL_ROT | 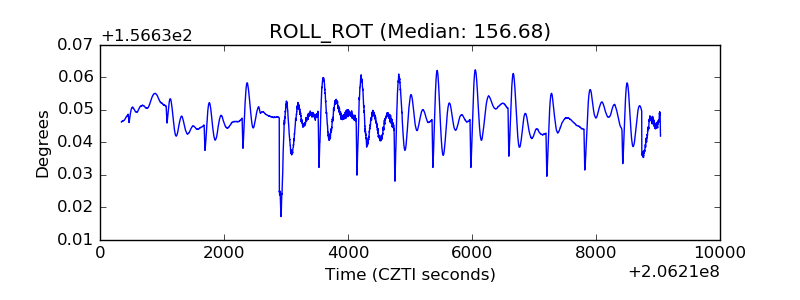 |
| _Roll_DEC | 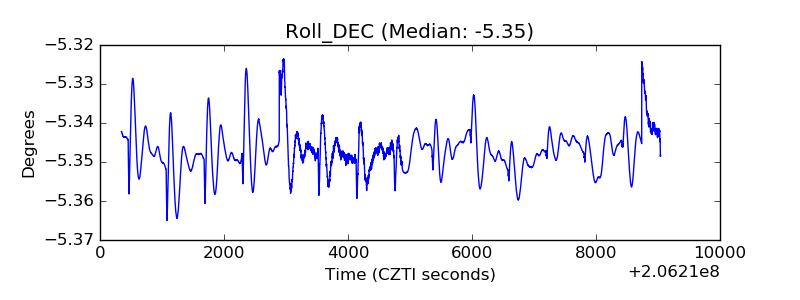 |
| _Roll_RA | 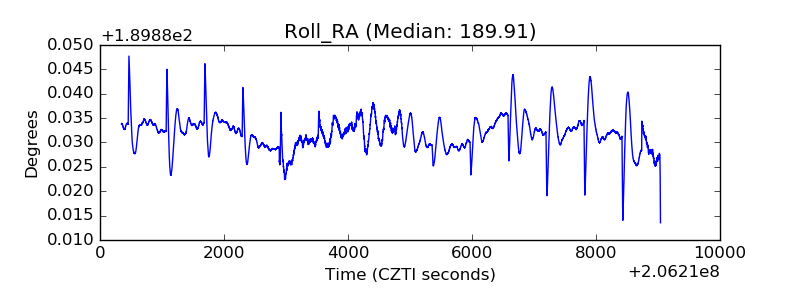 |
| Veto Counter | 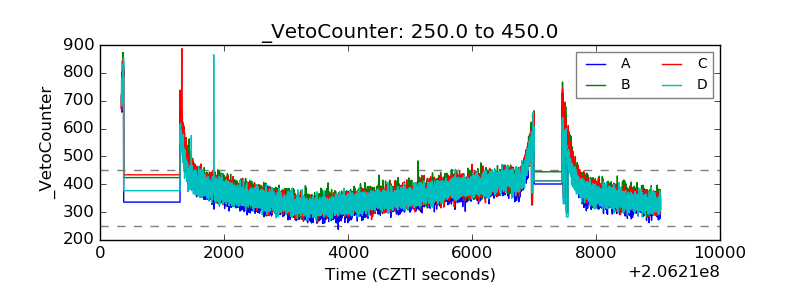 |