| Param | Original file | Final file |
|---|---|---|
| Filename | modeM0/AS1G05_219T01_9000000540_04304cztM0_level2.evt | modeM0/AS1G05_219T01_9000000540_04304cztM0_level2_quad_clean.evt |
| Size (bytes) | 527,523,840 | 84,971,520 |
| Size | 503.1 MB | 81.0 MB |
| Events in quadrant A | 4,024,331 | 513,626 |
| Events in quadrant B | 3,806,817 | 513,061 |
| Events in quadrant C | 3,472,794 | 510,437 |
| Events in quadrant D | 4,141,175 | 492,350 |
| Mode SS | |||
|---|---|---|---|
| Quadrant | BADHDUFLAG | Total packets | Discarded packets |
| A | 0 | 162 | 0 |
| B | 0 | 162 | 0 |
| C | 0 | 162 | 0 |
| D | 0 | 162 | 0 |
| Mode M9 | |||
|---|---|---|---|
| Quadrant | BADHDUFLAG | Total packets | Discarded packets |
| A | 0 | 5 | 0 |
| B | 0 | 5 | 0 |
| C | 0 | 5 | 0 |
| D | 0 | 5 | 0 |
| Mode M0 | |||
|---|---|---|---|
| Quadrant | BADHDUFLAG | Total packets | Discarded packets |
| A | 0 | 17525 | 3 |
| B | 0 | 16681 | 2 |
| C | 0 | 16168 | 2 |
| D | 0 | 18163 | 2 |
| Quadrant | Total seconds | Saturated seconds | Saturation percentage |
|---|---|---|---|
| A | 7819 | 131 | 1.675406% |
| B | 7819 | 129 | 1.649827% |
| C | 7819 | 30 | 0.383681% |
| D | 7819 | 128 | 1.637038% |
Noise dominated data is calculated using 1-second bins in cleaned event files. If a bin has >2000 counts, and if more than 50% of those come from <1% of pixels, then it is considered to be noise-dominated and hence unusable.
| Quadrant | # 1 sec bins | Bins with >0 counts | Bins with >2000 counts | High rate bins dominated by noise | Noise dominated (total time) | Noise dominated (detector-on time) | Marked lightcurve |
|---|---|---|---|---|---|---|---|
| A | 8234 | 7821 | 12 | 12 | 0.15% | 0.15% |  |
| B | 8234 | 7822 | 0 | 0 | 0.00% | 0.00% | 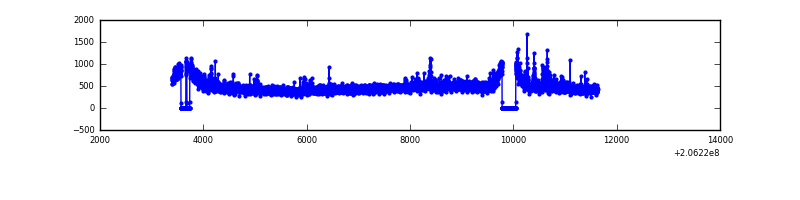 |
| C | 8234 | 7822 | 3 | 3 | 0.04% | 0.04% |  |
| D | 8234 | 7822 | 92 | 92 | 1.12% | 1.18% |  |
Top three noisy pixels from each quadrant. If the there are fewer than three noisy pixels in the level2.evt file, extra rows are filled as -1
| Pixel properties | Quadrant properties | ||||||
|---|---|---|---|---|---|---|---|
| Quadrant | DetID | PixID | Counts | Sigma | Mean | Median | Sigma |
| A | 13 | 251 | 497978 | 2646.34 | 906 | 882 | 187.8 |
| A | 0 | 50 | 20856 | 106.33 | 906 | 882 | 187.8 |
| A | 12 | 194 | 9184 | 44.19 | 906 | 882 | 187.8 |
| B | 15 | 204 | 97092 | 534.88 | 918 | 894 | 179.8 |
| B | 14 | 167 | 75352 | 414.0 | 918 | 894 | 179.8 |
| B | 3 | 0 | 30381 | 163.95 | 918 | 894 | 179.8 |
| C | 10 | 65 | 43932 | 209.5 | 875 | 877 | 205.5 |
| C | 9 | 247 | 7527 | 32.36 | 875 | 877 | 205.5 |
| C | 13 | 61 | 7185 | 30.69 | 875 | 877 | 205.5 |
| D | 13 | 223 | 182807 | 857.65 | 868 | 842 | 212.2 |
| D | 13 | 53 | 139901 | 655.42 | 868 | 842 | 212.2 |
| D | 2 | 136 | 139071 | 651.51 | 868 | 842 | 212.2 |
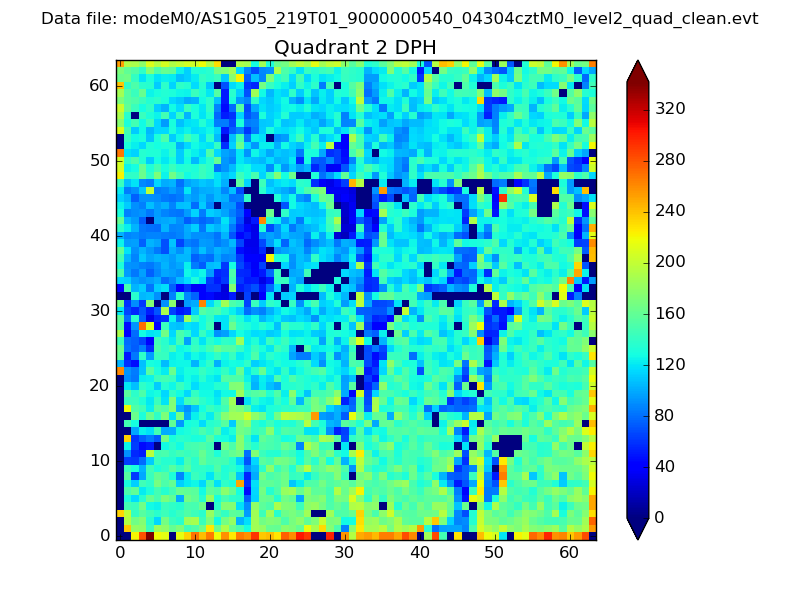
Histogram calculated using DETX and DETY for each event in the final _common_clean file
| Quadrant A | 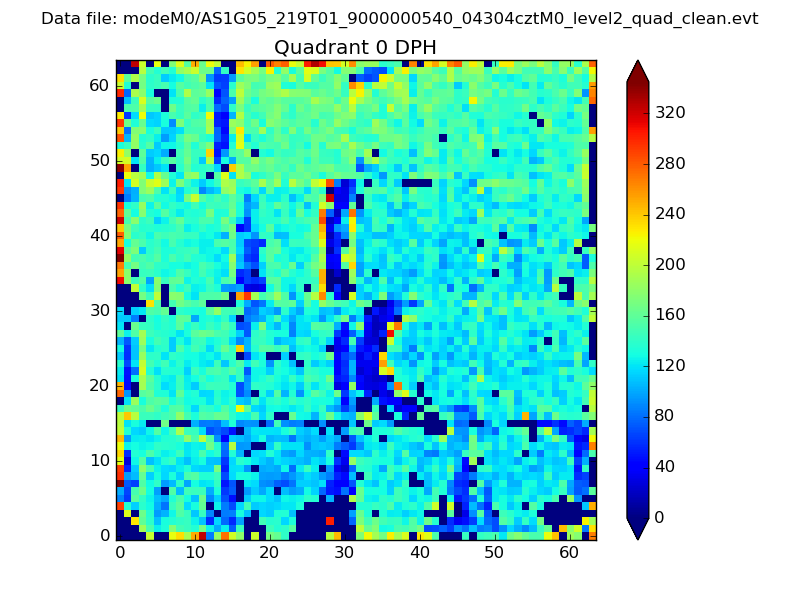 |
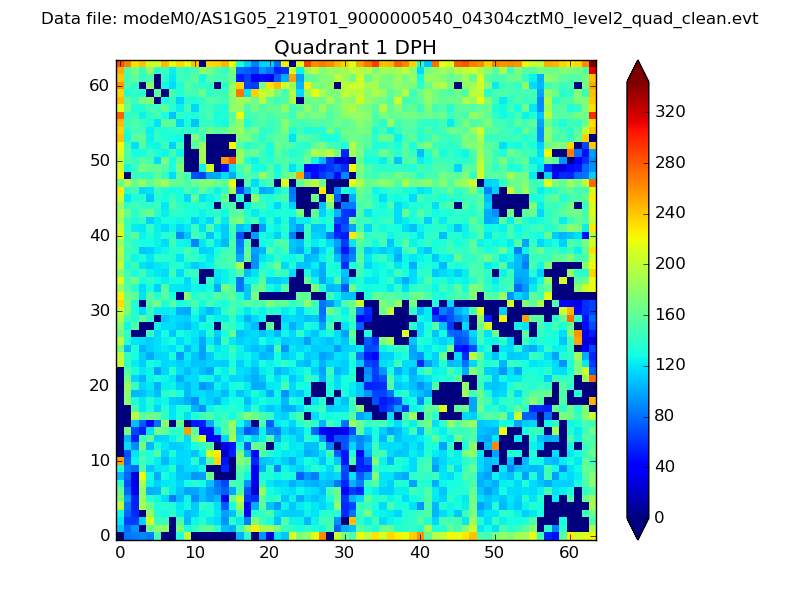 |
Quadrant B |
|---|---|---|---|
| Quadrant D | 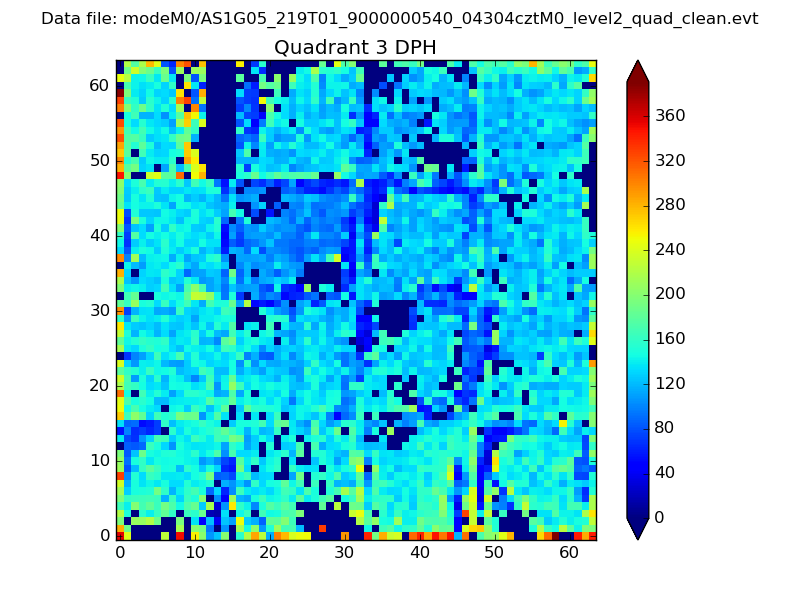 |
 |
Quadrant C |
| Plot type | Count rate plots | Images |
|---|---|---|
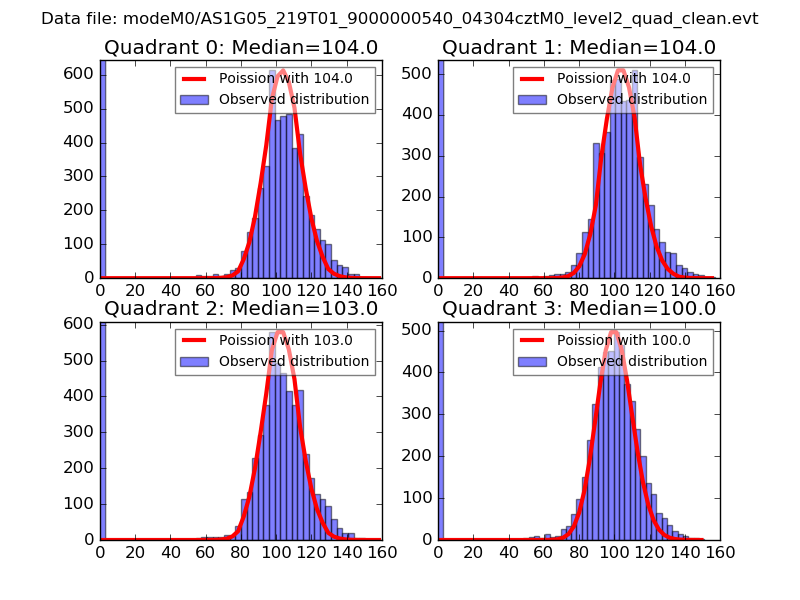
| Comparison with Poisson distribution Blue bars denote a histogram of data divided into 1 sec bins. Red curve is a Poisson curve with rate = median count rate of data. |
 |
 |
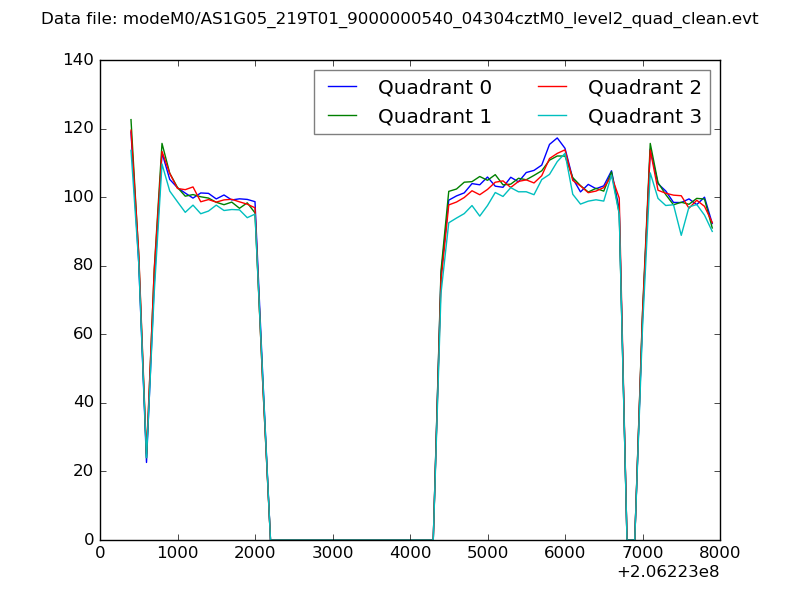
| Quadrant-wise count rates Data is divided into 100 sec bins |
 |
|
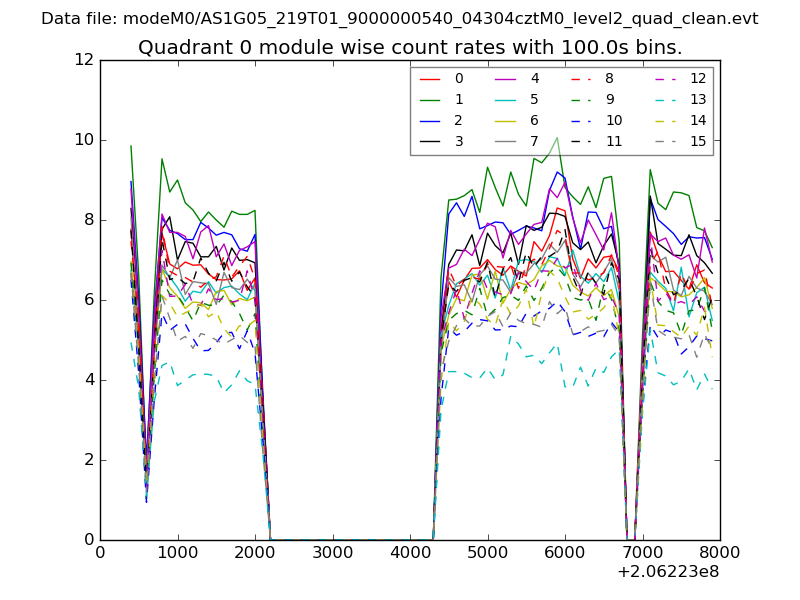
| Module-wise count rates for Quadrant A Data is divided into 100 sec bins |
 |
 |
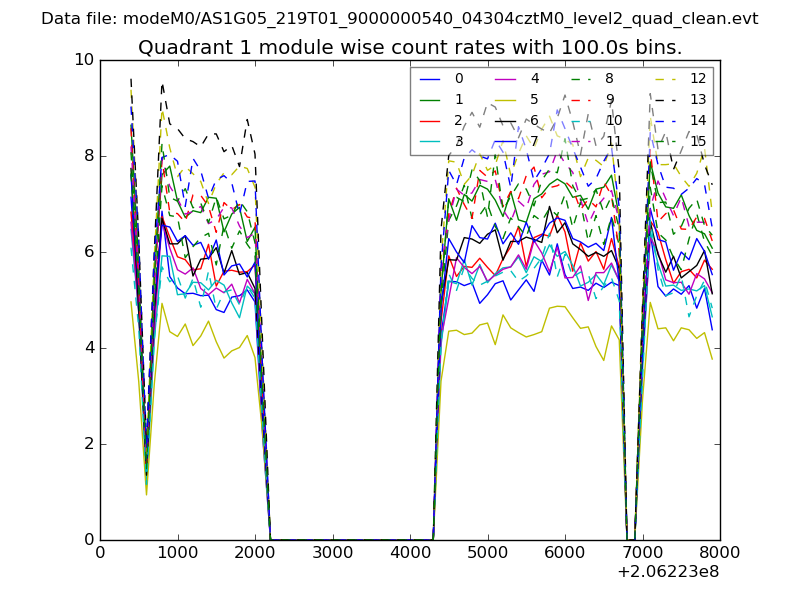
| Module-wise count rates for Quadrant B Data is divided into 100 sec bins |
 |
 |
| Module-wise count rates for Quadrant C Data is divided into 100 sec bins |
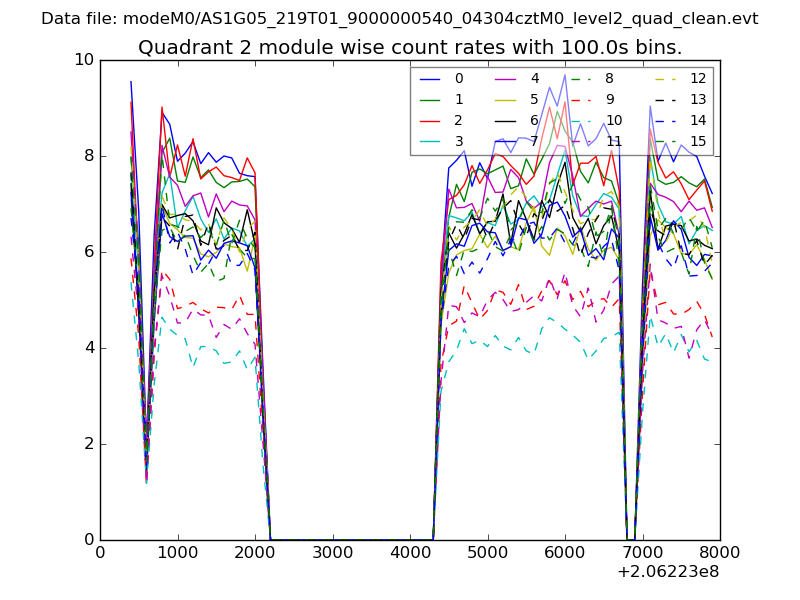 |
 |
| Module-wise count rates for Quadrant D Data is divided into 100 sec bins |
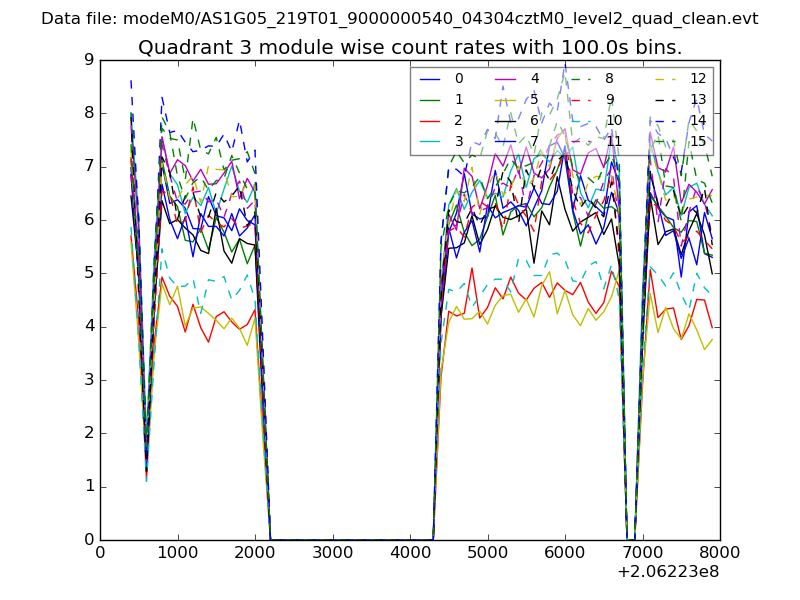 |
 |
| Parameter | Plot |
|---|---|
| CZT HV Monitor | 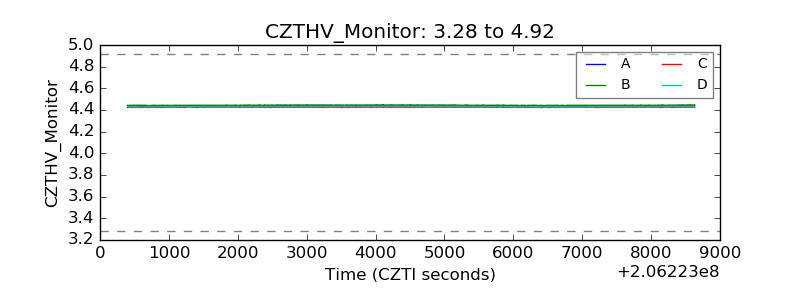 |
| D_VDD | 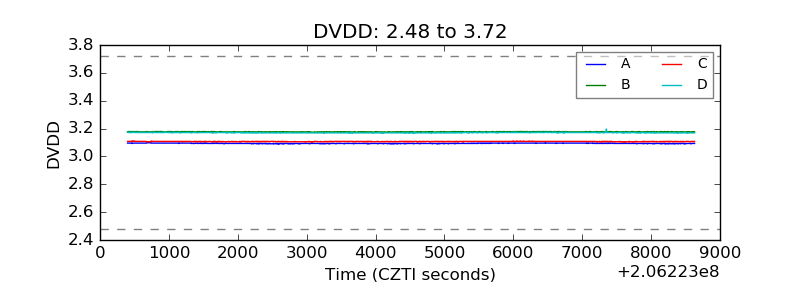 |
| Temperature 1 | 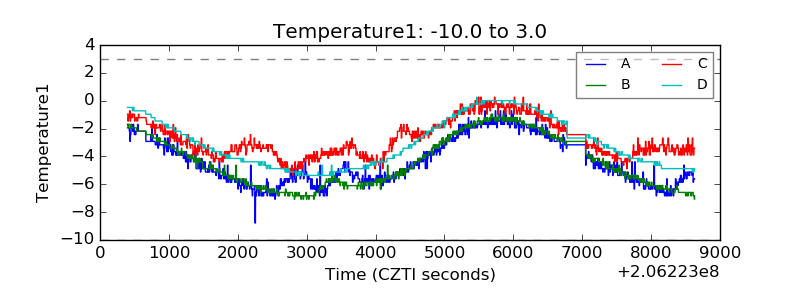 |
| Veto HV Monitor | 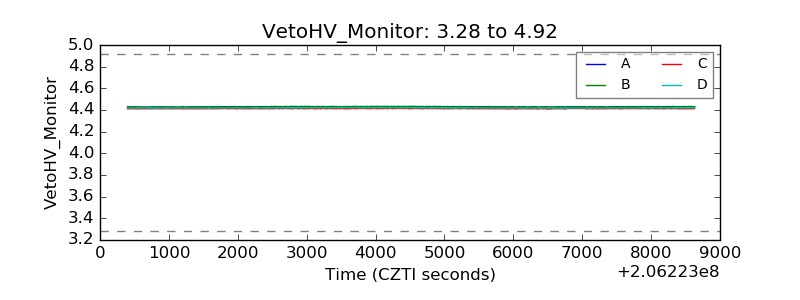 |
| Veto LLD | 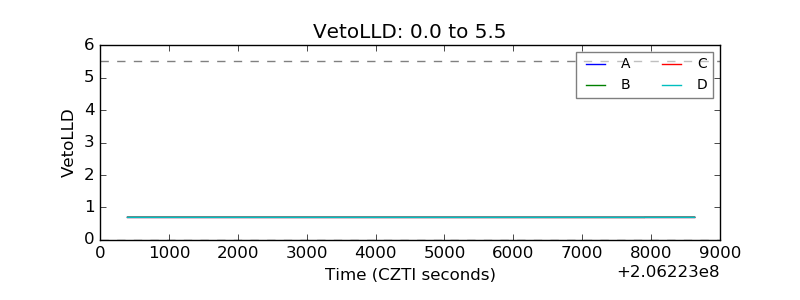 |
| Alpha Counter | 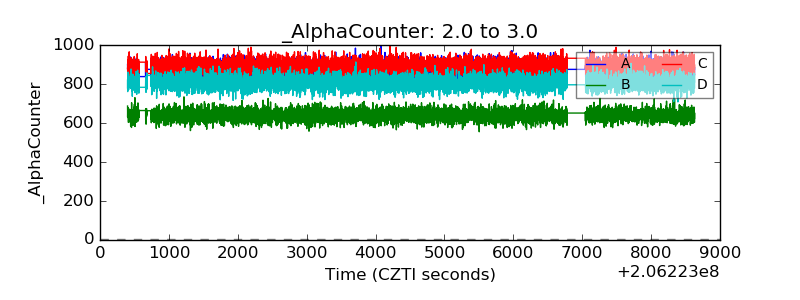 |
| _CPM_Rate | 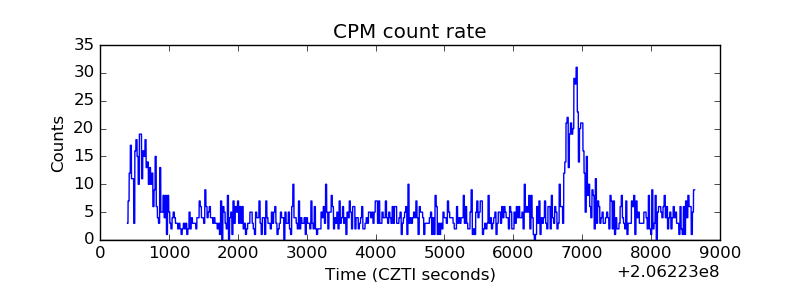 |
| CZT Counter | 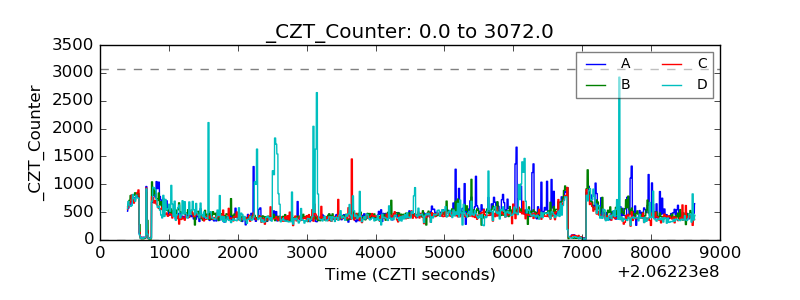 |
| +2.5 Volts monitor |  |
| +5 Volts monitor |  |
| _ROLL_ROT | 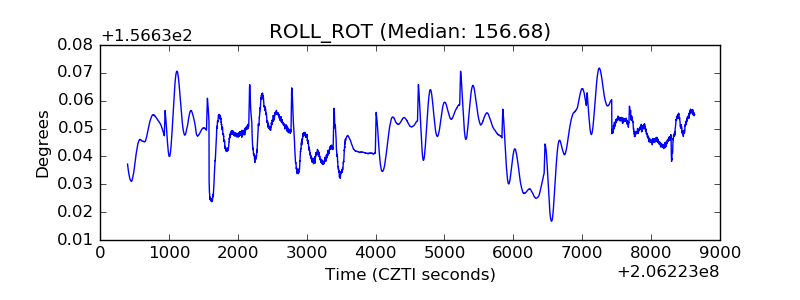 |
| _Roll_DEC | 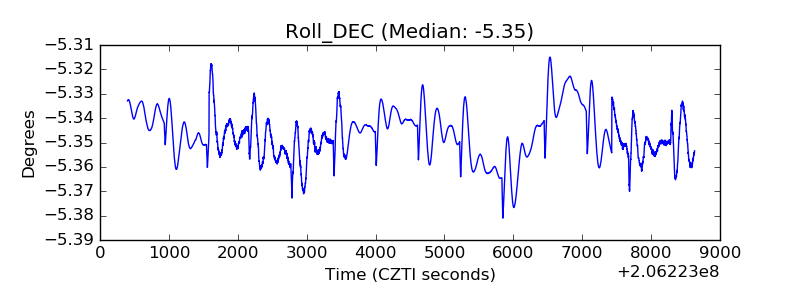 |
| _Roll_RA | 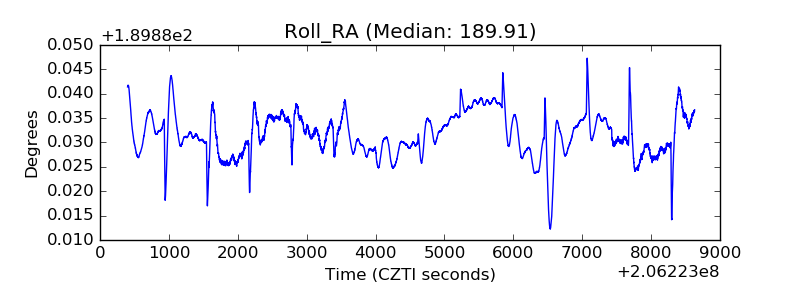 |
| Veto Counter | 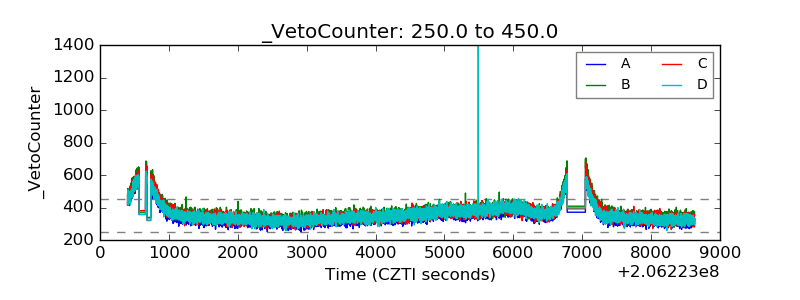 |