| Param | Original file | Final file |
|---|---|---|
| Filename | modeM0/AS1G05_219T01_9000000540_04307cztM0_level2.evt | modeM0/AS1G05_219T01_9000000540_04307cztM0_level2_quad_clean.evt |
| Size (bytes) | 1,300,792,320 | 182,689,920 |
| Size | 1.2 GB | 174.2 MB |
| Events in quadrant A | 11,960,823 | 1,051,864 |
| Events in quadrant B | 9,098,094 | 1,078,842 |
| Events in quadrant C | 8,192,499 | 1,072,170 |
| Events in quadrant D | 8,883,870 | 1,046,409 |
| Mode SS | |||
|---|---|---|---|
| Quadrant | BADHDUFLAG | Total packets | Discarded packets |
| A | 0 | 386 | 4 |
| B | 0 | 386 | 10 |
| C | 0 | 386 | 2 |
| D | 0 | 386 | 6 |
| Mode M9 | |||
|---|---|---|---|
| Quadrant | BADHDUFLAG | Total packets | Discarded packets |
| A | 0 | 21 | 0 |
| B | 0 | 21 | 0 |
| C | 0 | 21 | 0 |
| D | 0 | 21 | 0 |
| Mode M0 | |||
|---|---|---|---|
| Quadrant | BADHDUFLAG | Total packets | Discarded packets |
| A | 0 | 48840 | 656 |
| B | 0 | 40173 | 635 |
| C | 0 | 38771 | 612 |
| D | 0 | 40787 | 664 |
| Quadrant | Total seconds | Saturated seconds | Saturation percentage |
|---|---|---|---|
| A | 18620 | 730 | 3.920516% |
| B | 18614 | 219 | 1.176534% |
| C | 18625 | 117 | 0.628188% |
| D | 18608 | 198 | 1.064058% |
Noise dominated data is calculated using 1-second bins in cleaned event files. If a bin has >2000 counts, and if more than 50% of those come from <1% of pixels, then it is considered to be noise-dominated and hence unusable.
| Quadrant | # 1 sec bins | Bins with >0 counts | Bins with >2000 counts | High rate bins dominated by noise | Noise dominated (total time) | Noise dominated (detector-on time) | Marked lightcurve |
|---|---|---|---|---|---|---|---|
| A | 21000 | 18844 | 462 | 462 | 2.20% | 2.45% |  |
| B | 20999 | 18852 | 12 | 12 | 0.06% | 0.06% |  |
| C | 21000 | 18842 | 3 | 3 | 0.01% | 0.02% | 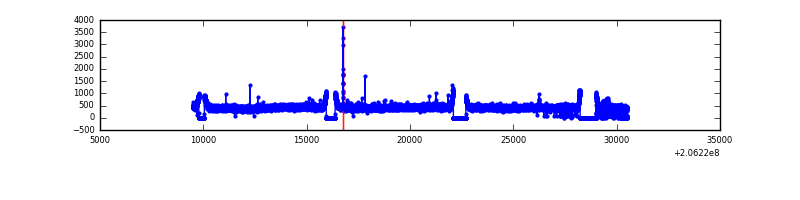 |
| D | 21000 | 18821 | 89 | 89 | 0.42% | 0.47% | 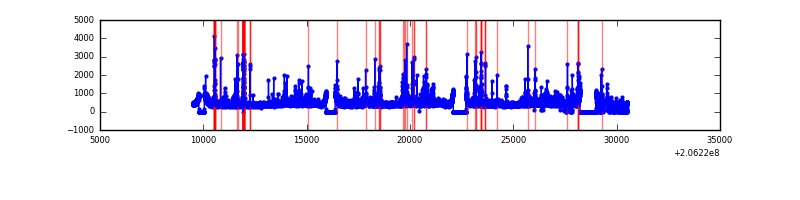 |
Top three noisy pixels from each quadrant. If the there are fewer than three noisy pixels in the level2.evt file, extra rows are filled as -1
| Pixel properties | Quadrant properties | ||||||
|---|---|---|---|---|---|---|---|
| Quadrant | DetID | PixID | Counts | Sigma | Mean | Median | Sigma |
| A | 13 | 251 | 1109935 | 2568.58 | 2105 | 2056 | 431.3 |
| A | 14 | 238 | 1094650 | 2533.14 | 2105 | 2056 | 431.3 |
| A | 15 | 234 | 1017698 | 2354.73 | 2105 | 2056 | 431.3 |
| B | 14 | 167 | 217430 | 513.94 | 2163 | 2113 | 418.9 |
| B | 15 | 204 | 185422 | 437.54 | 2163 | 2113 | 418.9 |
| B | 3 | 0 | 90036 | 209.87 | 2163 | 2113 | 418.9 |
| C | 9 | 54 | 50010 | 99.01 | 2069 | 2080 | 484.1 |
| C | 9 | 247 | 43300 | 85.15 | 2069 | 2080 | 484.1 |
| C | 13 | 61 | 17215 | 31.26 | 2069 | 2080 | 484.1 |
| D | 2 | 136 | 178069 | 352.44 | 2056 | 1993 | 499.6 |
| D | 13 | 223 | 177712 | 351.73 | 2056 | 1993 | 499.6 |
| D | 13 | 53 | 111276 | 218.75 | 2056 | 1993 | 499.6 |
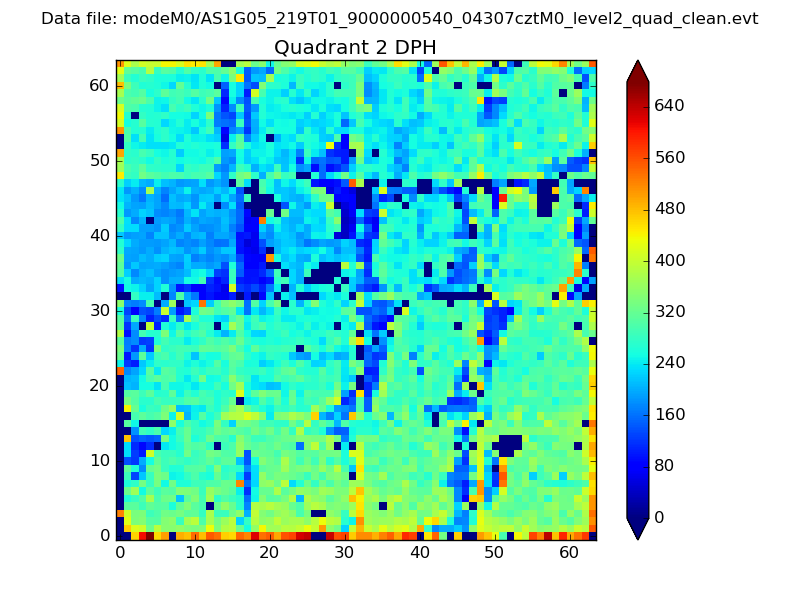
Histogram calculated using DETX and DETY for each event in the final _common_clean file
| Quadrant A | 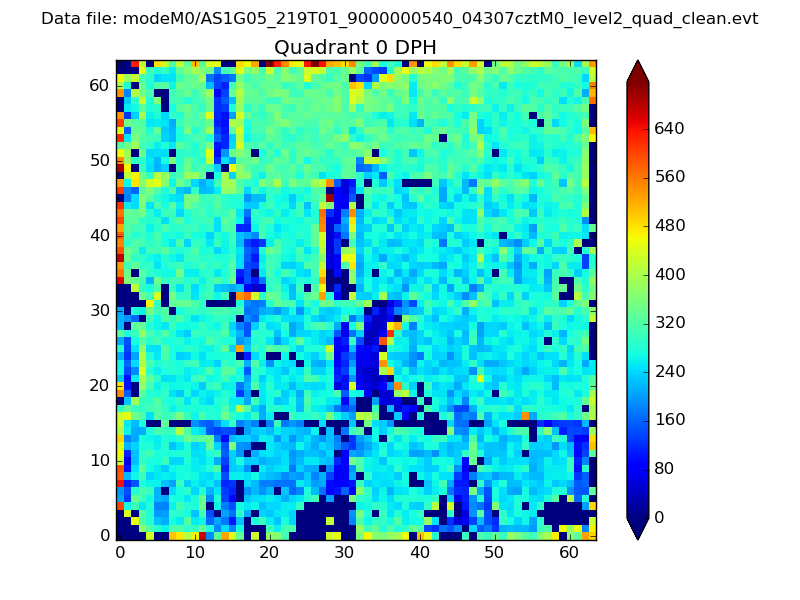 |
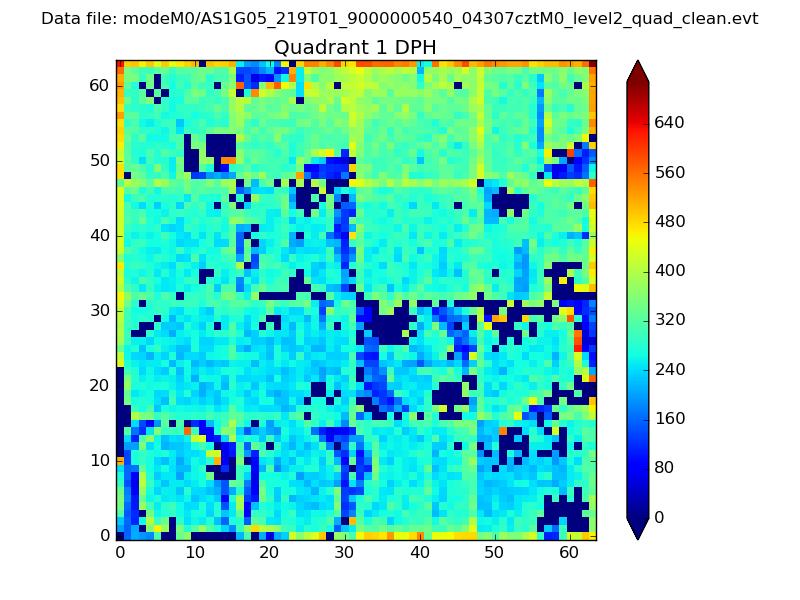 |
Quadrant B |
|---|---|---|---|
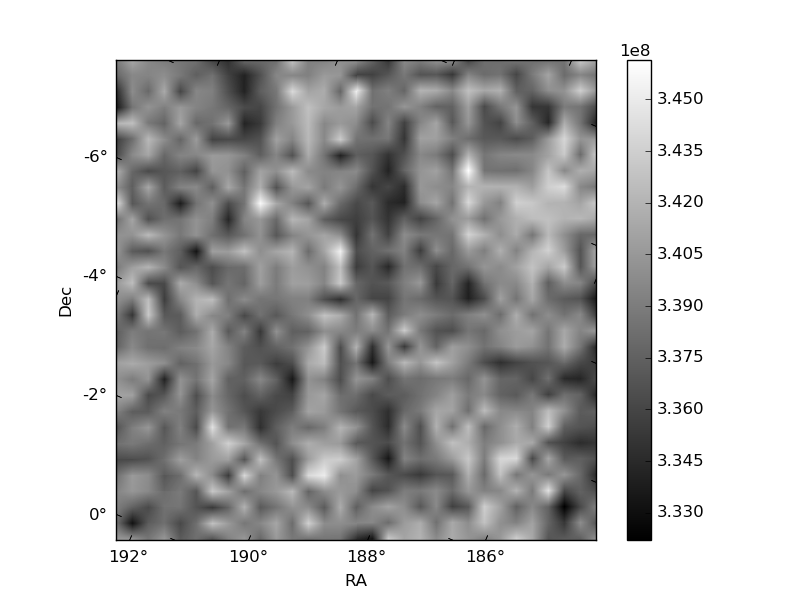
| Quadrant D | 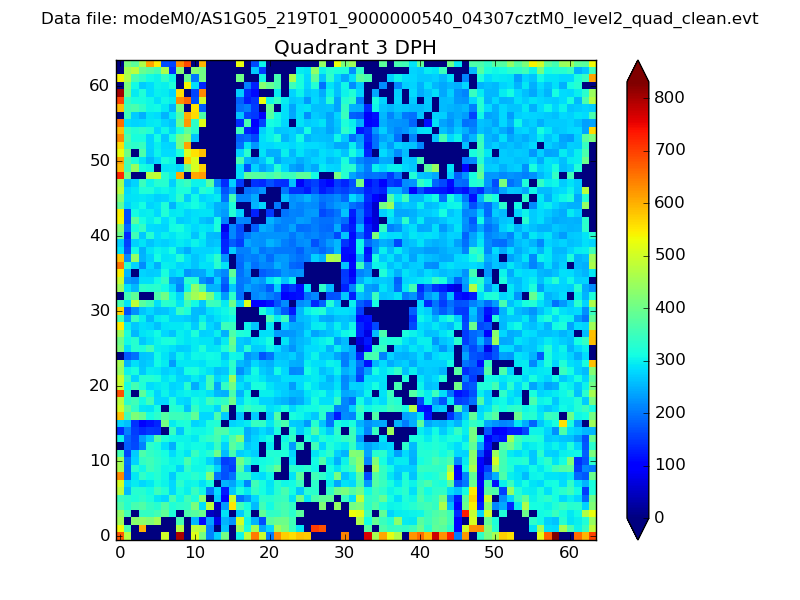 |
 |
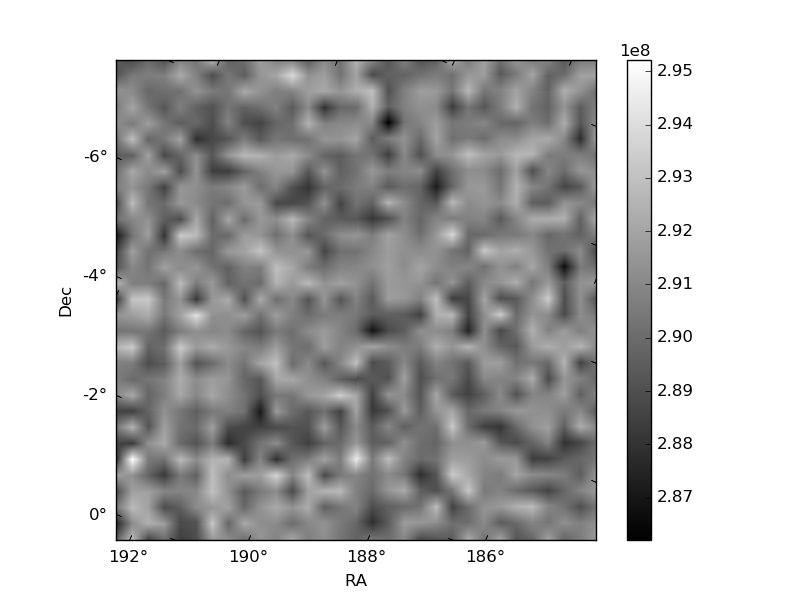
Quadrant C |
| Plot type | Count rate plots | Images |
|---|---|---|
| Comparison with Poisson distribution Blue bars denote a histogram of data divided into 1 sec bins. Red curve is a Poisson curve with rate = median count rate of data. |
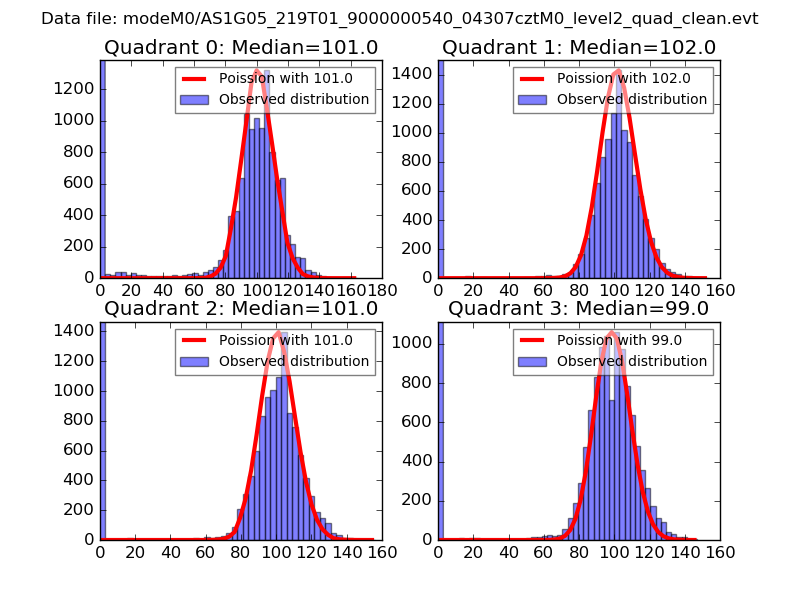 |
 |
| Quadrant-wise count rates Data is divided into 100 sec bins |
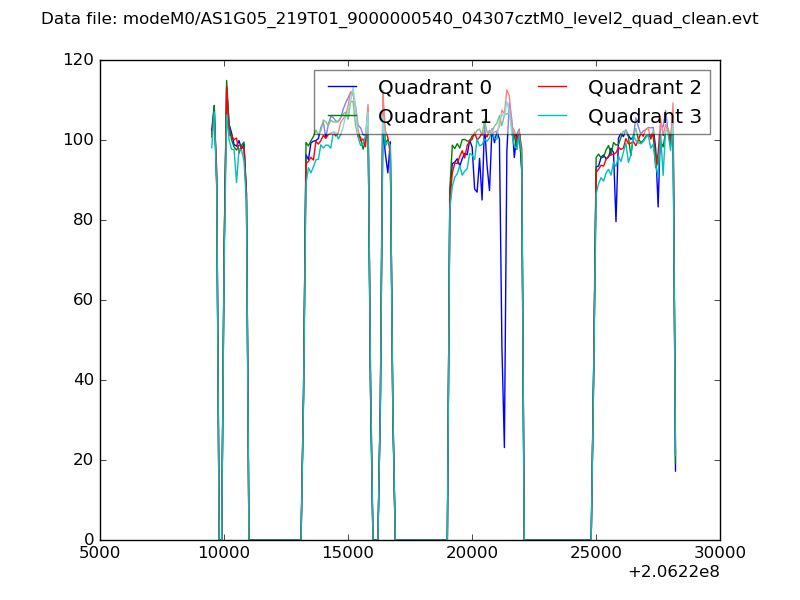 |
|
| Module-wise count rates for Quadrant A Data is divided into 100 sec bins |
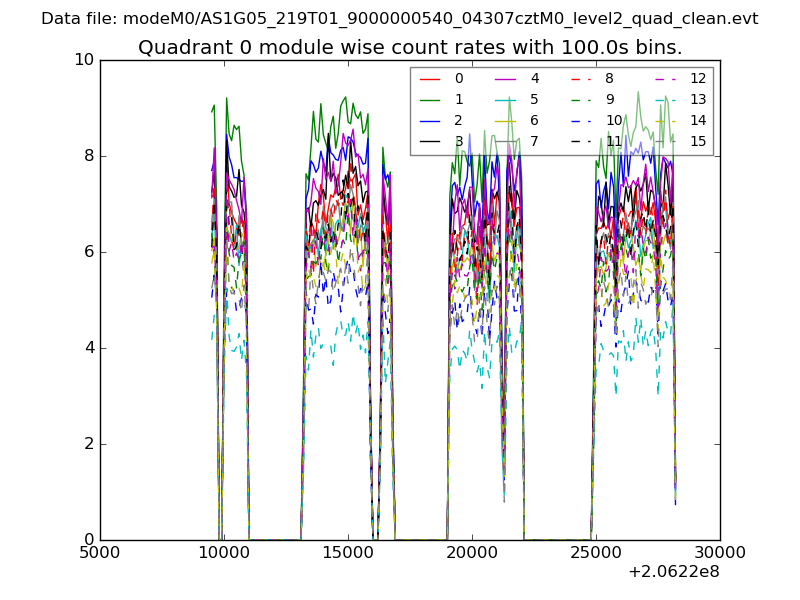 |
 |
| Module-wise count rates for Quadrant B Data is divided into 100 sec bins |
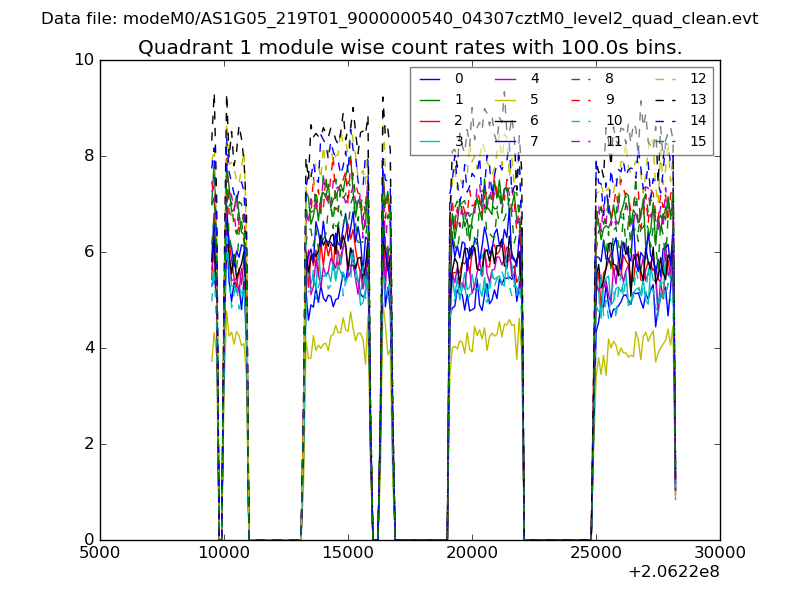 |
 |
| Module-wise count rates for Quadrant C Data is divided into 100 sec bins |
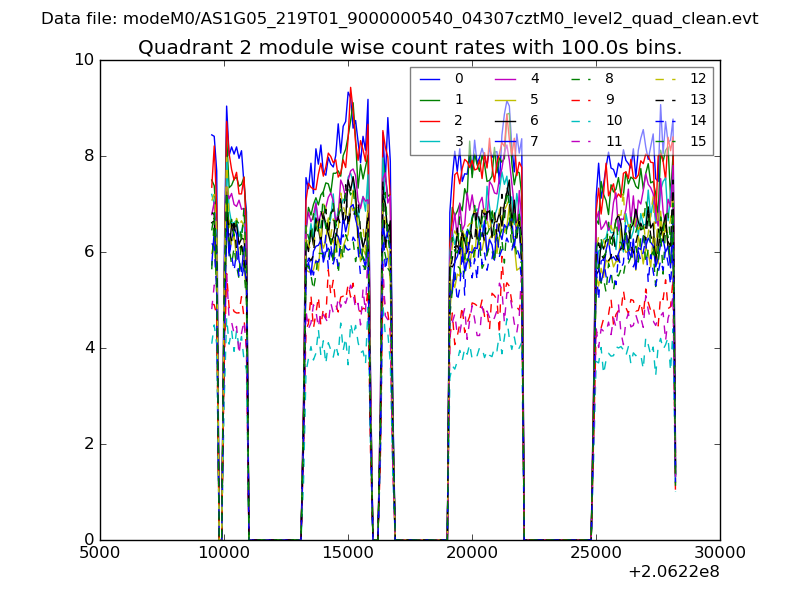 |
 |
| Module-wise count rates for Quadrant D Data is divided into 100 sec bins |
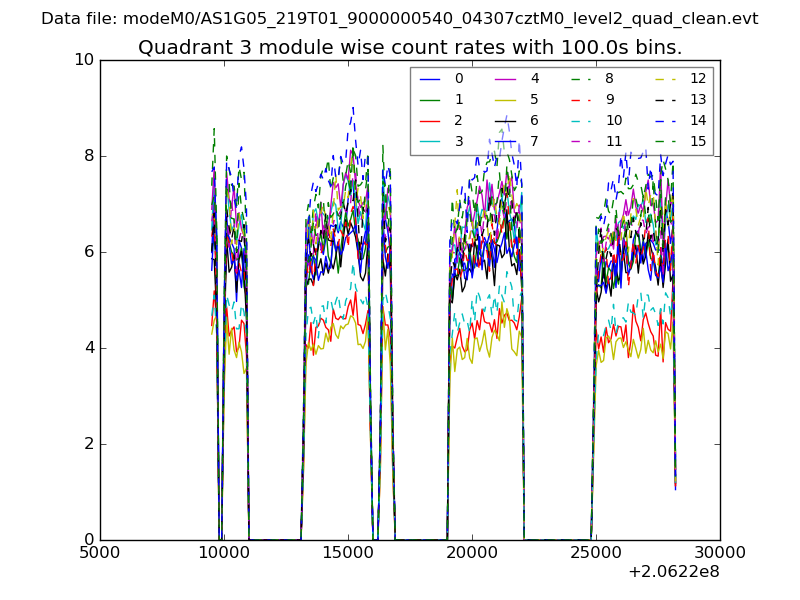 |
 |
| Parameter | Plot |
|---|---|
| CZT HV Monitor | 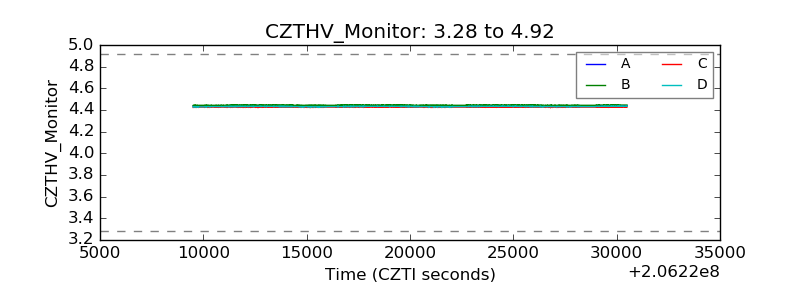 |
| D_VDD | 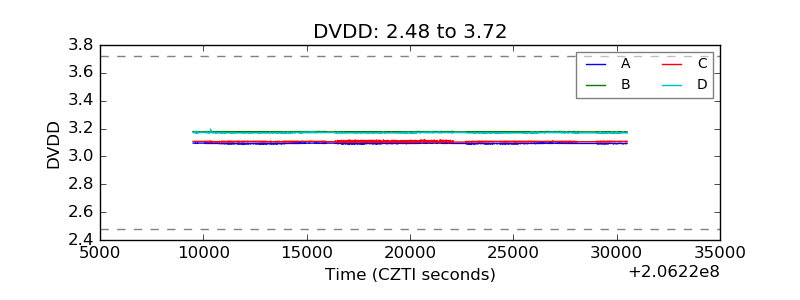 |
| Temperature 1 | 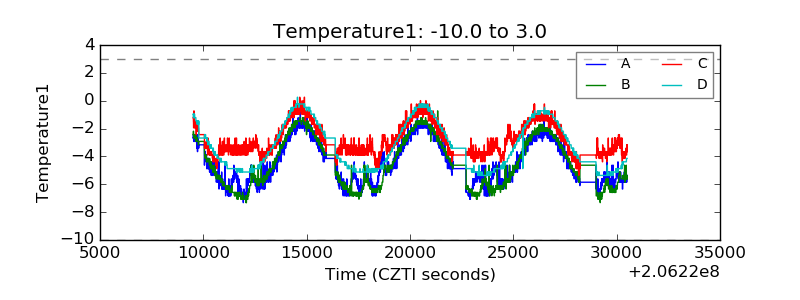 |
| Veto HV Monitor | 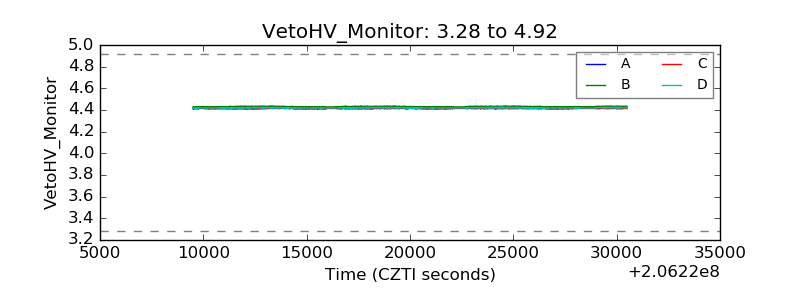 |
| Veto LLD | 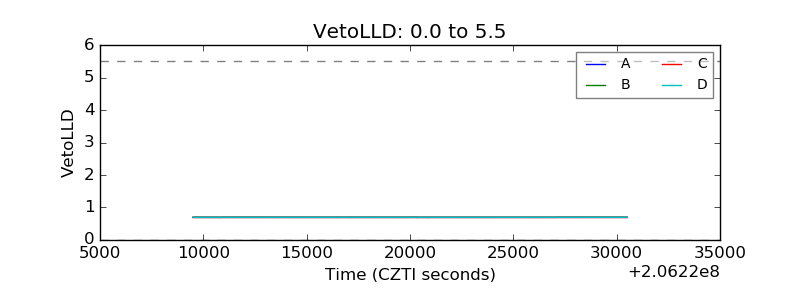 |
| Alpha Counter | 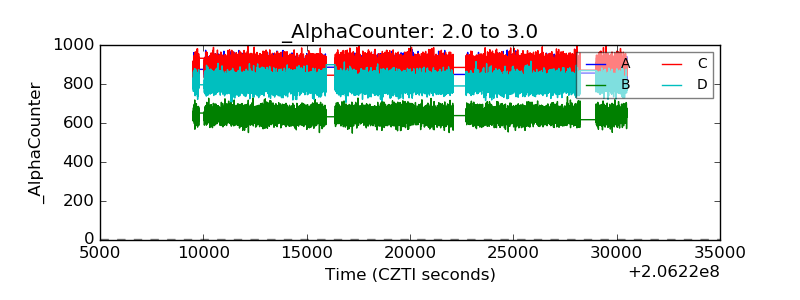 |
| _CPM_Rate | 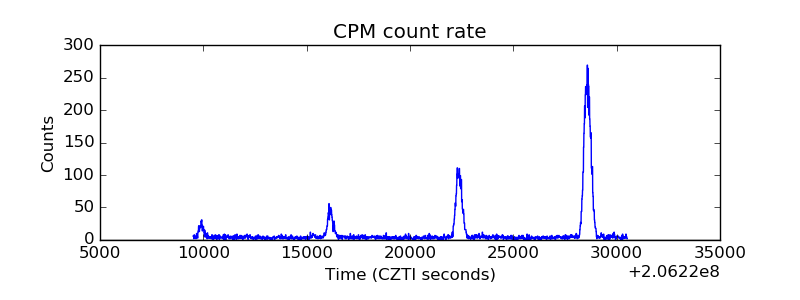 |
| CZT Counter | 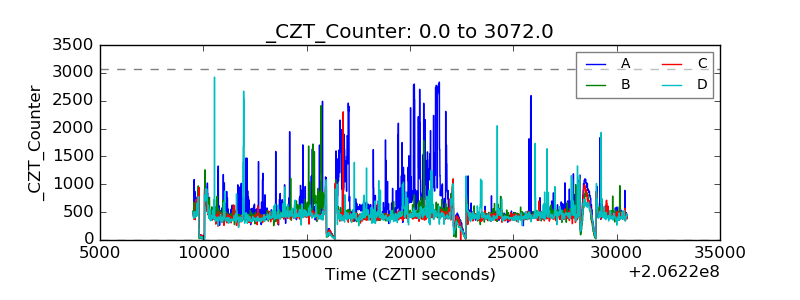 |
| +2.5 Volts monitor |  |
| +5 Volts monitor |  |
| _ROLL_ROT | 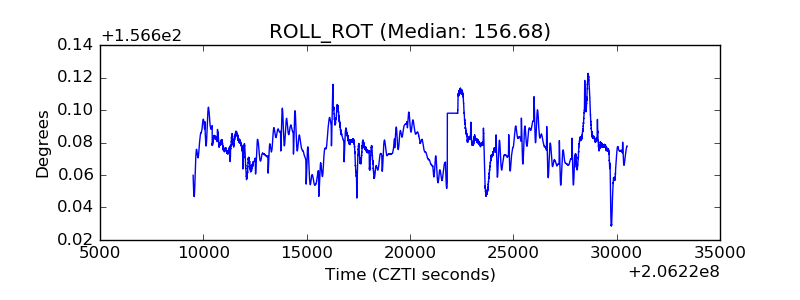 |
| _Roll_DEC | 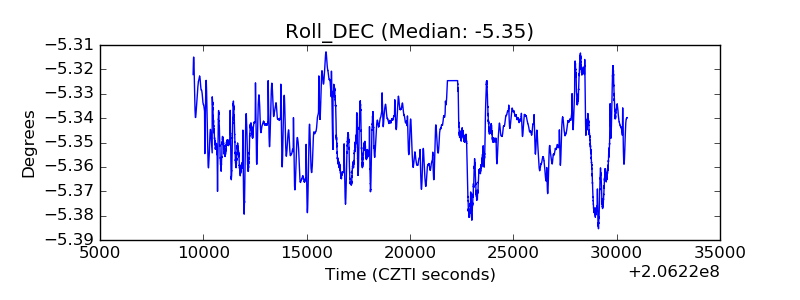 |
| _Roll_RA | 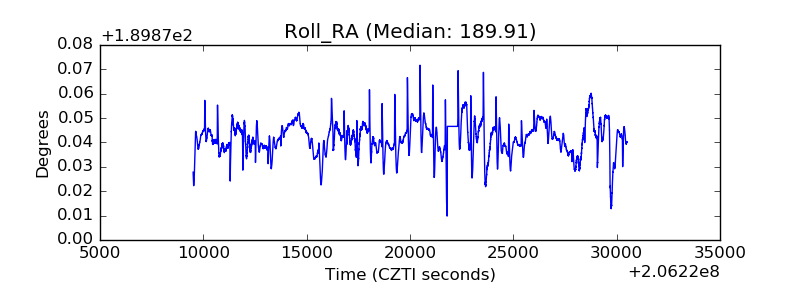 |
| Veto Counter | 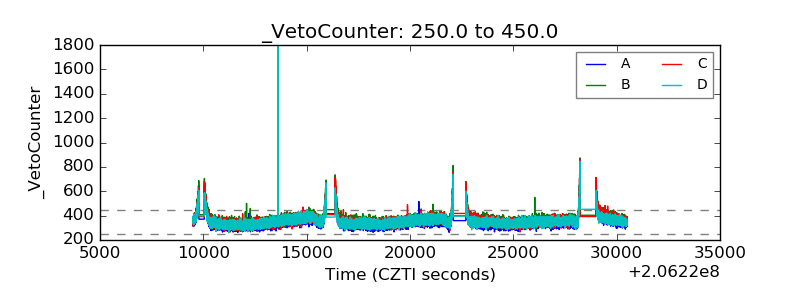 |