| Param | Original file | Final file |
|---|---|---|
| Filename | modeM0/AS1G05_219T01_9000000540_04308cztM0_level2.evt | modeM0/AS1G05_219T01_9000000540_04308cztM0_level2_quad_clean.evt |
| Size (bytes) | 490,360,320 | 69,010,560 |
| Size | 467.6 MB | 65.8 MB |
| Events in quadrant A | 3,637,049 | 403,371 |
| Events in quadrant B | 3,999,454 | 400,577 |
| Events in quadrant C | 3,224,354 | 399,672 |
| Events in quadrant D | 3,505,108 | 389,173 |
| Mode SS | |||
|---|---|---|---|
| Quadrant | BADHDUFLAG | Total packets | Discarded packets |
| A | 0 | 150 | 0 |
| B | 0 | 150 | 0 |
| C | 0 | 150 | 0 |
| D | 0 | 150 | 0 |
| Mode M9 | |||
|---|---|---|---|
| Quadrant | BADHDUFLAG | Total packets | Discarded packets |
| A | 0 | 16 | 0 |
| B | 0 | 16 | 0 |
| C | 0 | 16 | 0 |
| D | 0 | 16 | 0 |
| Mode M0 | |||
|---|---|---|---|
| Quadrant | BADHDUFLAG | Total packets | Discarded packets |
| A | 0 | 15467 | 3 |
| B | 0 | 16427 | 2 |
| C | 0 | 14692 | 2 |
| D | 0 | 15497 | 2 |
| Quadrant | Total seconds | Saturated seconds | Saturation percentage |
|---|---|---|---|
| A | 7120 | 118 | 1.657303% |
| B | 7120 | 234 | 3.286517% |
| C | 7120 | 70 | 0.983146% |
| D | 7120 | 83 | 1.165730% |
Noise dominated data is calculated using 1-second bins in cleaned event files. If a bin has >2000 counts, and if more than 50% of those come from <1% of pixels, then it is considered to be noise-dominated and hence unusable.
| Quadrant | # 1 sec bins | Bins with >0 counts | Bins with >2000 counts | High rate bins dominated by noise | Noise dominated (total time) | Noise dominated (detector-on time) | Marked lightcurve |
|---|---|---|---|---|---|---|---|
| A | 8835 | 7120 | 10 | 10 | 0.11% | 0.14% |  |
| B | 8835 | 7120 | 114 | 114 | 1.29% | 1.60% |  |
| C | 8835 | 7120 | 0 | 0 | 0.00% | 0.00% | 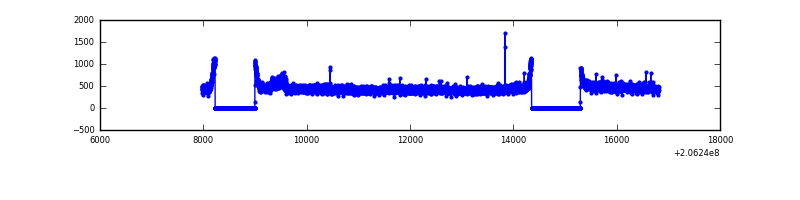 |
| D | 8835 | 7120 | 9 | 9 | 0.10% | 0.13% |  |
Top three noisy pixels from each quadrant. If the there are fewer than three noisy pixels in the level2.evt file, extra rows are filled as -1
| Pixel properties | Quadrant properties | ||||||
|---|---|---|---|---|---|---|---|
| Quadrant | DetID | PixID | Counts | Sigma | Mean | Median | Sigma |
| A | 13 | 251 | 301958 | 1755.28 | 838 | 820 | 171.6 |
| A | 15 | 234 | 33656 | 191.4 | 838 | 820 | 171.6 |
| A | 13 | 14 | 27102 | 153.19 | 838 | 820 | 171.6 |
| B | 5 | 184 | 316144 | 1923.45 | 841 | 821 | 163.9 |
| B | 15 | 204 | 208554 | 1267.16 | 841 | 821 | 163.9 |
| B | 14 | 167 | 122570 | 742.66 | 841 | 821 | 163.9 |
| C | 9 | 54 | 45178 | 232.49 | 811 | 815 | 190.8 |
| C | 10 | 65 | 7479 | 34.92 | 811 | 815 | 190.8 |
| C | 9 | 247 | 7069 | 32.77 | 811 | 815 | 190.8 |
| D | 13 | 53 | 172038 | 875.33 | 807 | 784 | 195.6 |
| D | 2 | 136 | 65348 | 330.0 | 807 | 784 | 195.6 |
| D | 13 | 239 | 55720 | 280.79 | 807 | 784 | 195.6 |
Histogram calculated using DETX and DETY for each event in the final _common_clean file
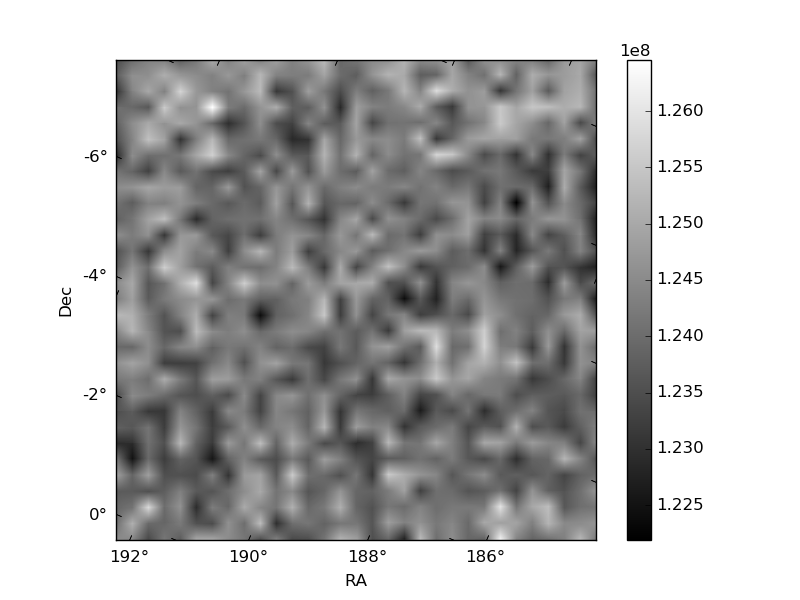
| Quadrant A | 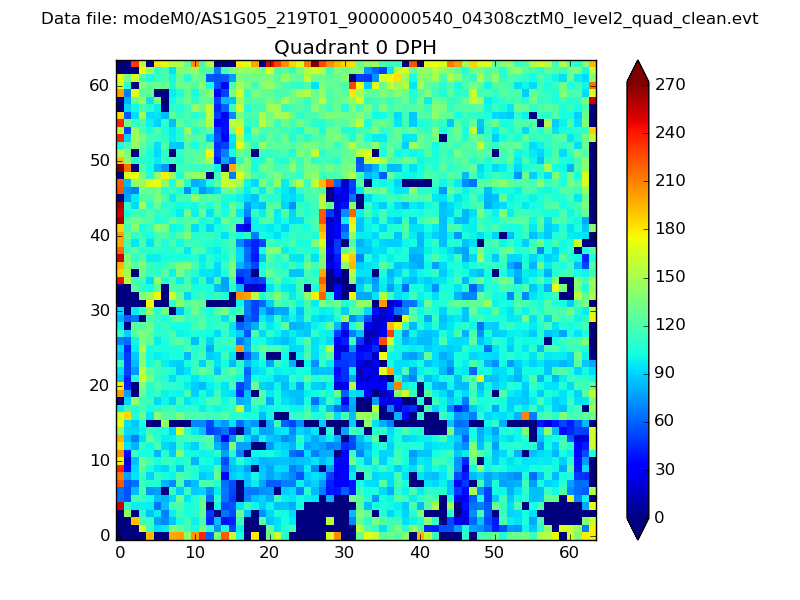 |
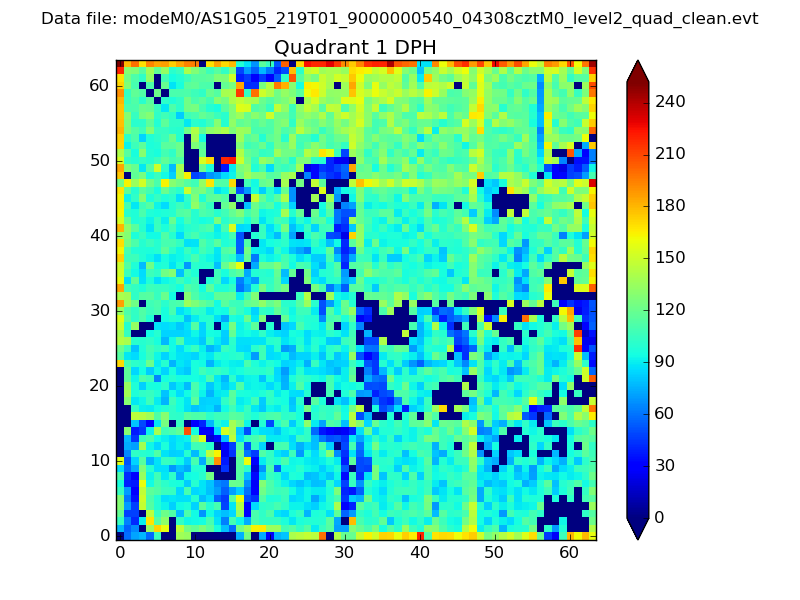 |
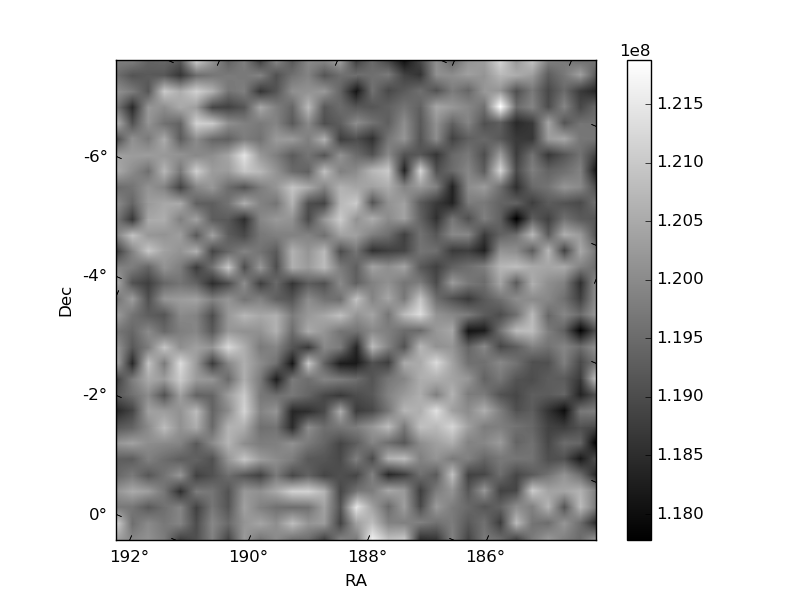
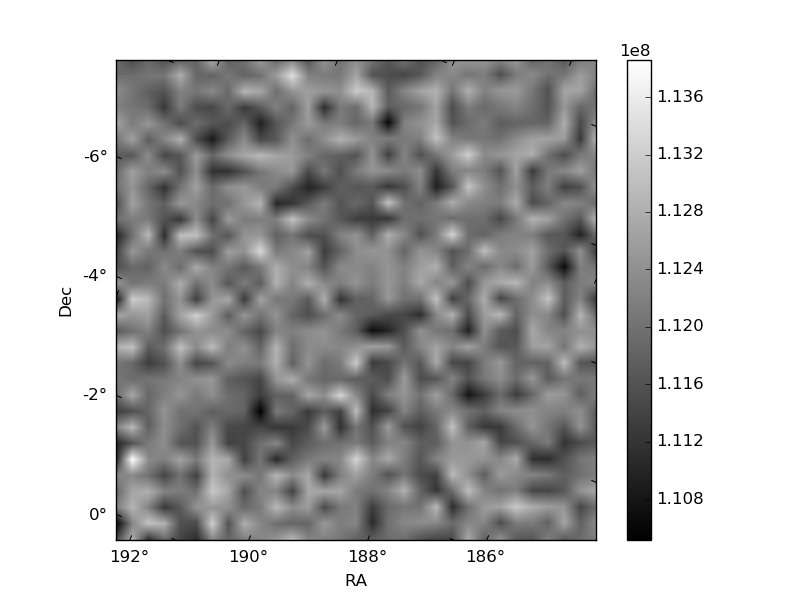
Quadrant B |
|---|---|---|---|
| Quadrant D | 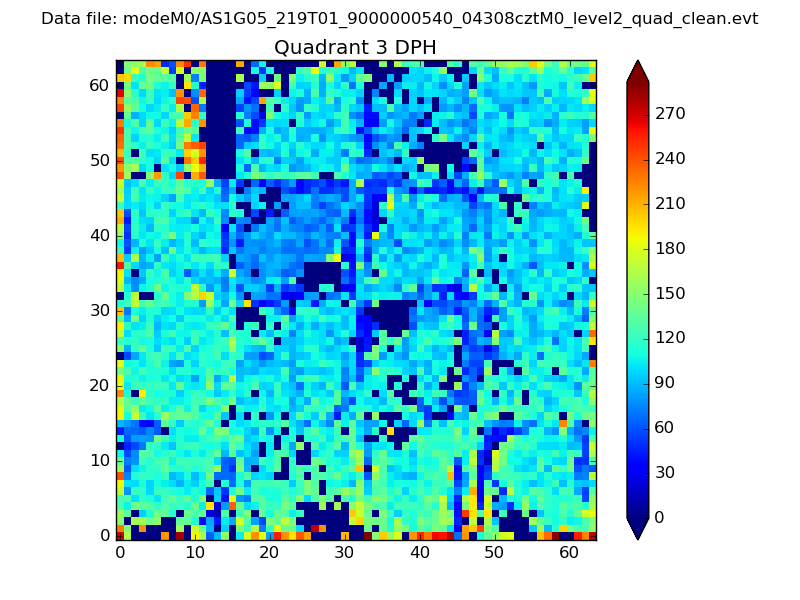 |
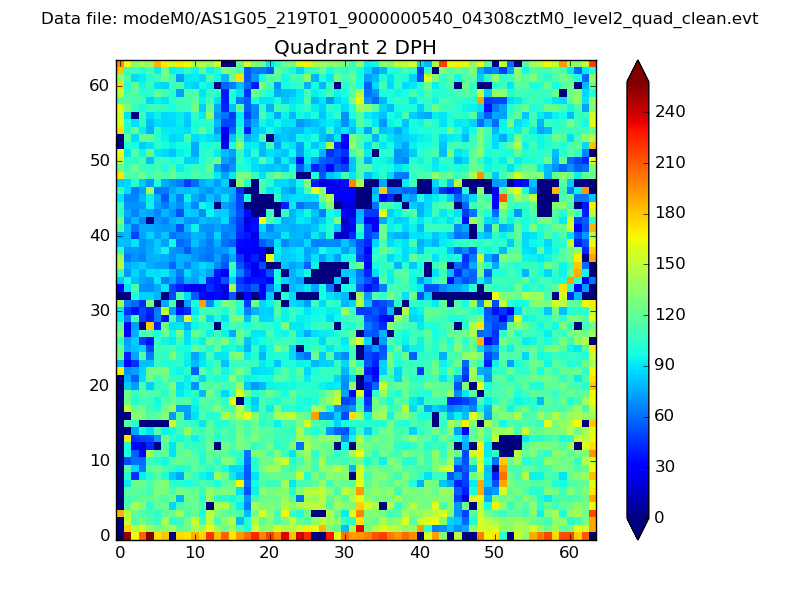 |
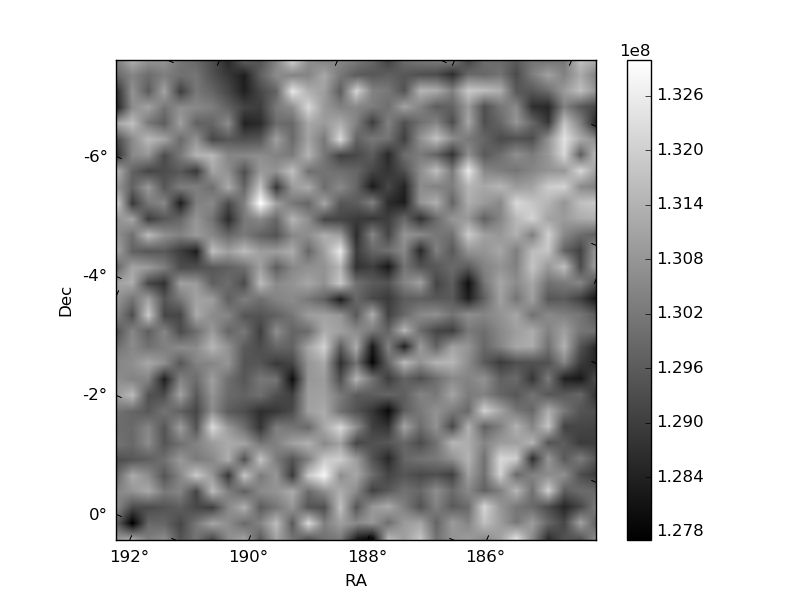
Quadrant C |
| Plot type | Count rate plots | Images |
|---|---|---|
| Comparison with Poisson distribution Blue bars denote a histogram of data divided into 1 sec bins. Red curve is a Poisson curve with rate = median count rate of data. |
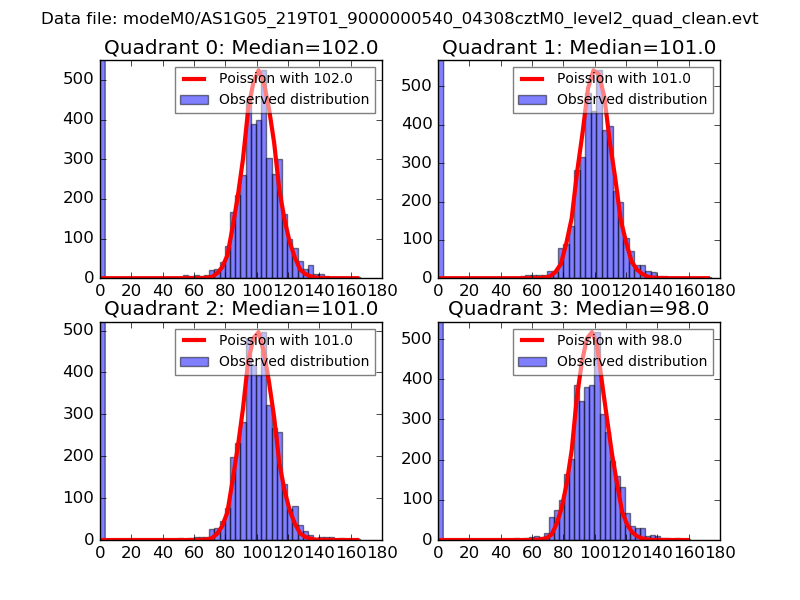 |
 |
| Quadrant-wise count rates Data is divided into 100 sec bins |
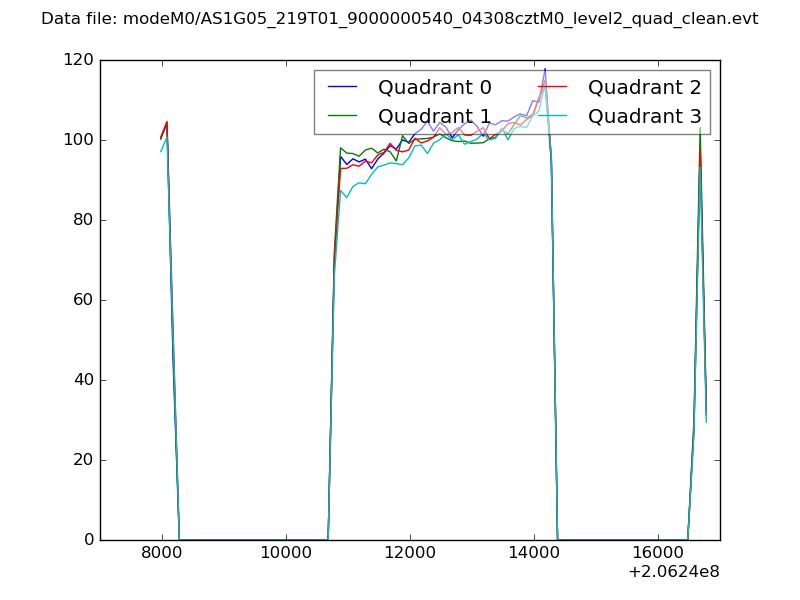 |
|
| Module-wise count rates for Quadrant A Data is divided into 100 sec bins |
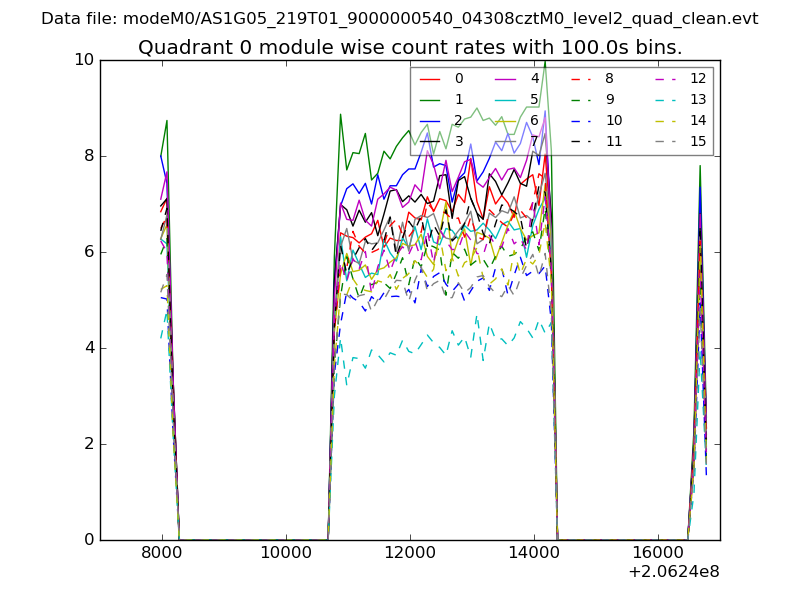 |
 |
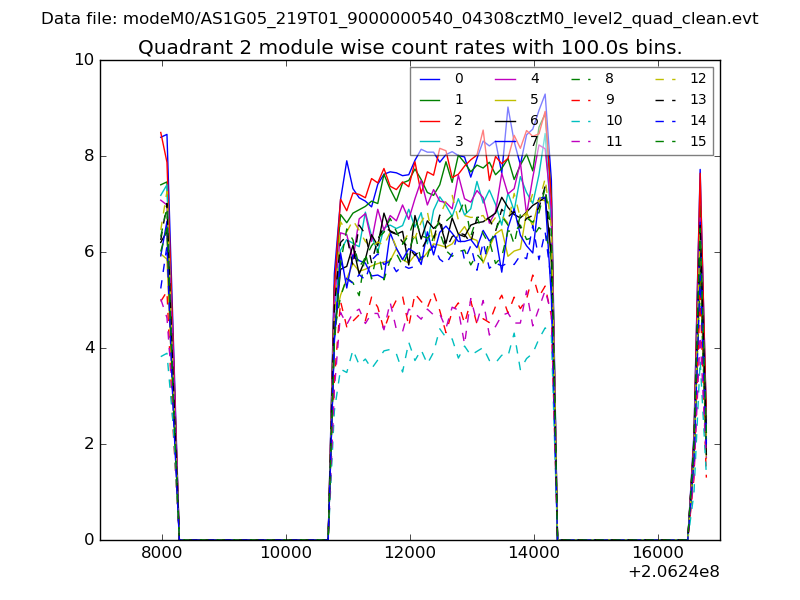
| Module-wise count rates for Quadrant B Data is divided into 100 sec bins |
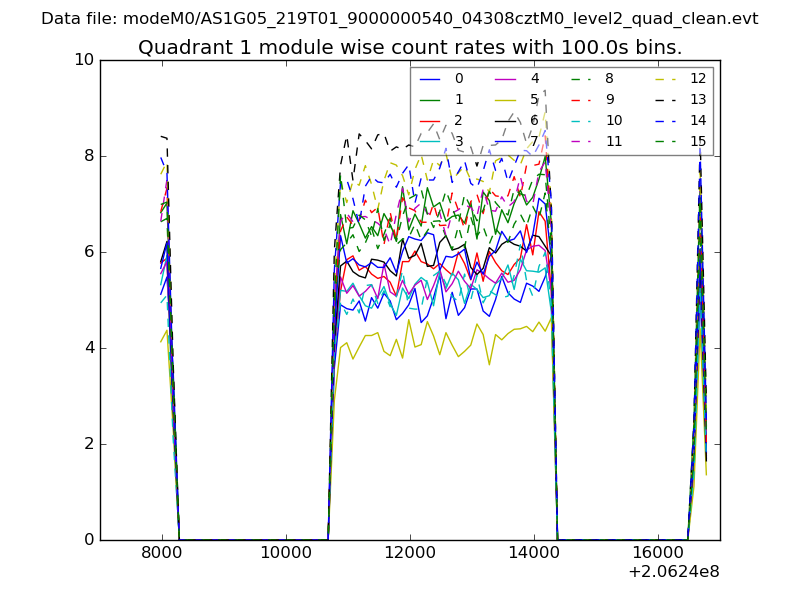 |
 |
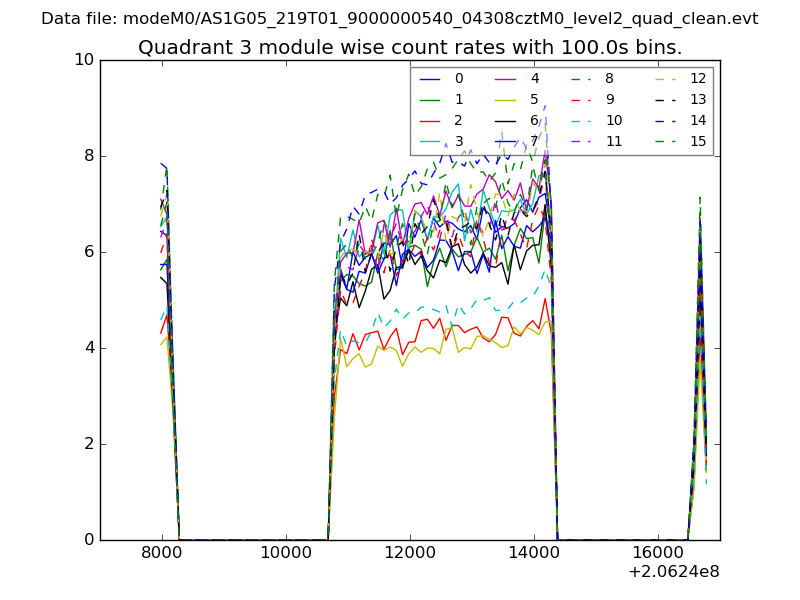
| Module-wise count rates for Quadrant C Data is divided into 100 sec bins |
 |
 |
| Module-wise count rates for Quadrant D Data is divided into 100 sec bins |
 |
 |
| Parameter | Plot |
|---|---|
| CZT HV Monitor | 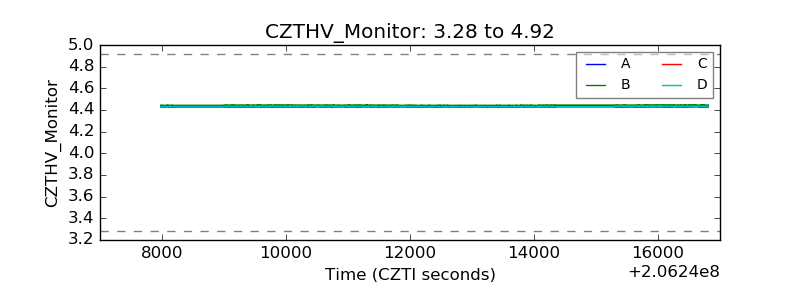 |
| D_VDD | 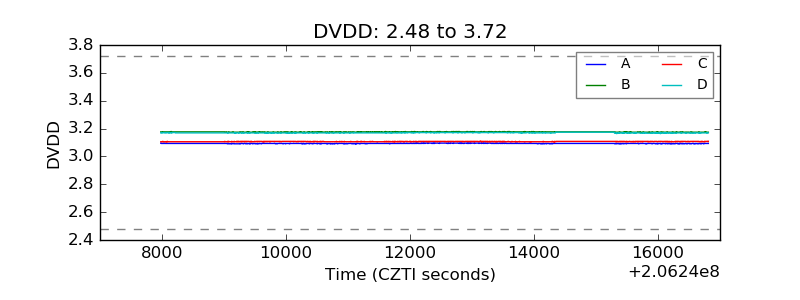 |
| Temperature 1 | 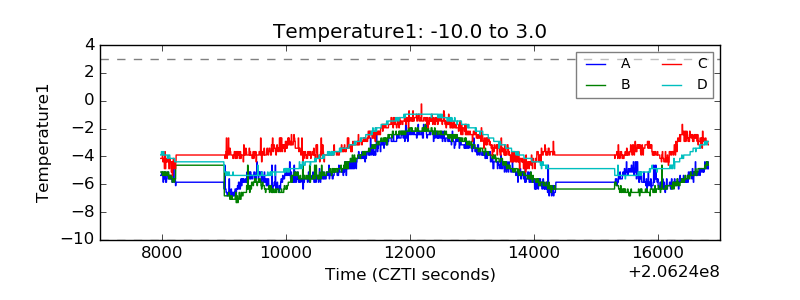 |
| Veto HV Monitor | 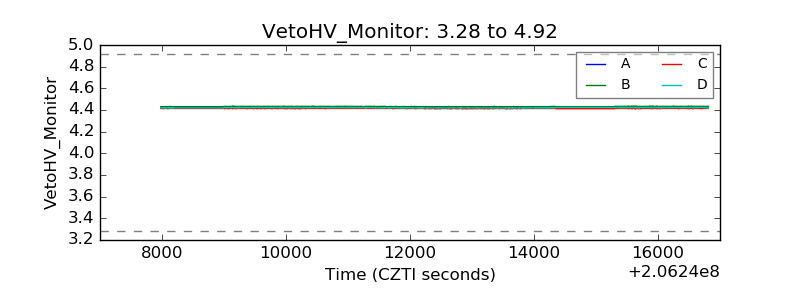 |
| Veto LLD | 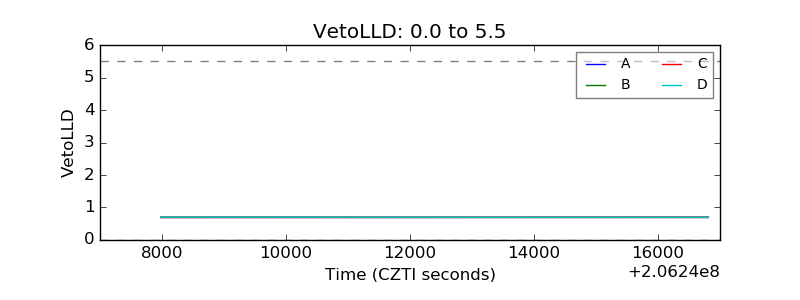 |
| Alpha Counter | 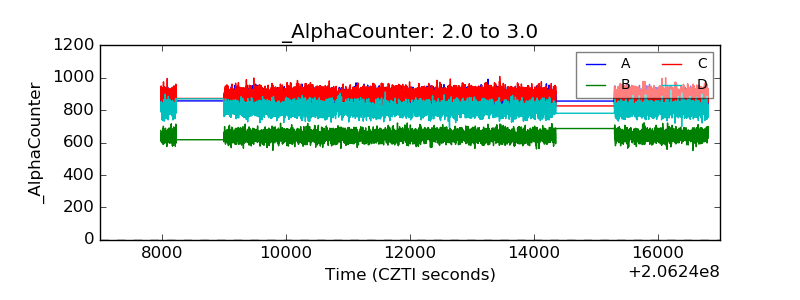 |
| _CPM_Rate | 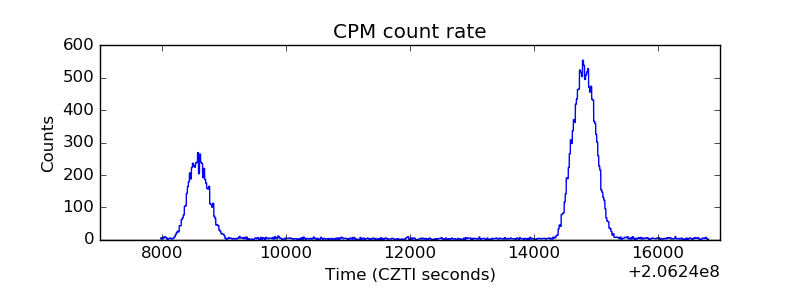 |
| CZT Counter | 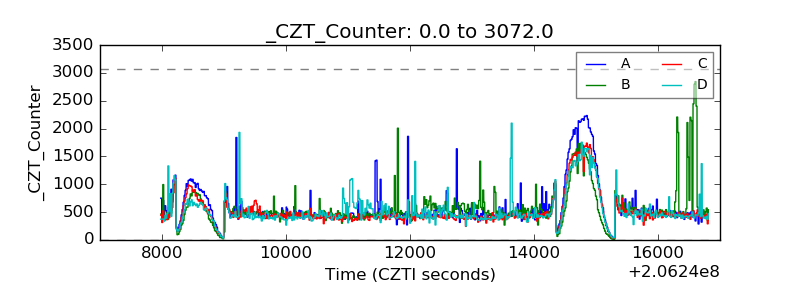 |
| +2.5 Volts monitor | 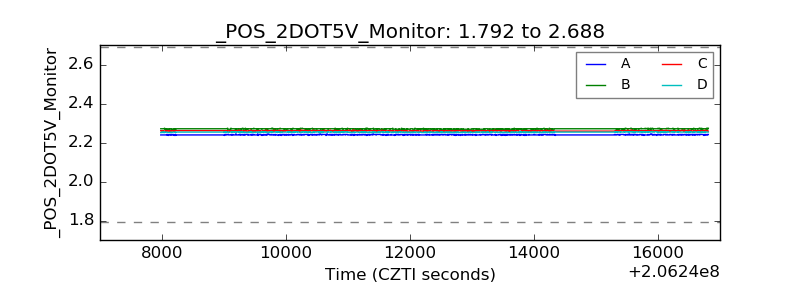 |
| +5 Volts monitor |  |
| _ROLL_ROT | 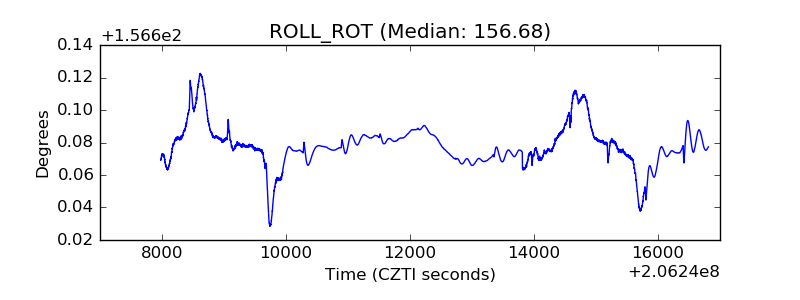 |
| _Roll_DEC | 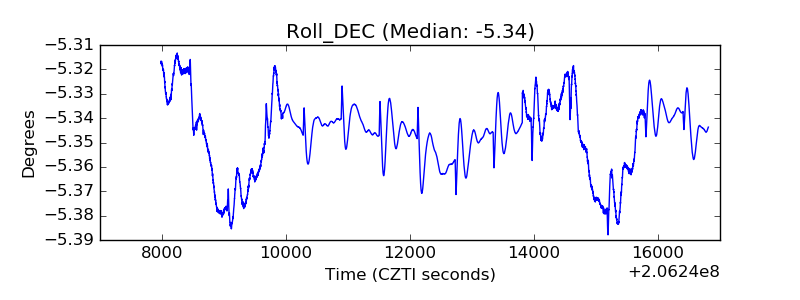 |
| _Roll_RA | 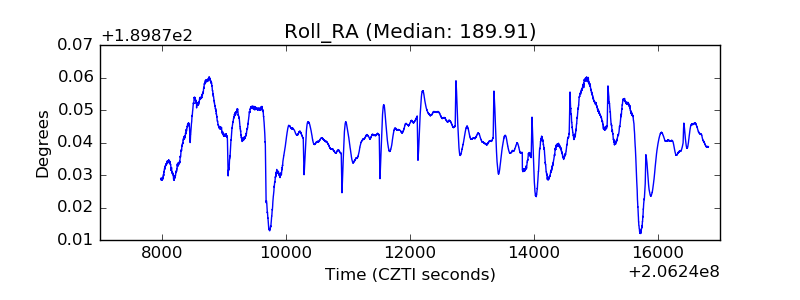 |
| Veto Counter | 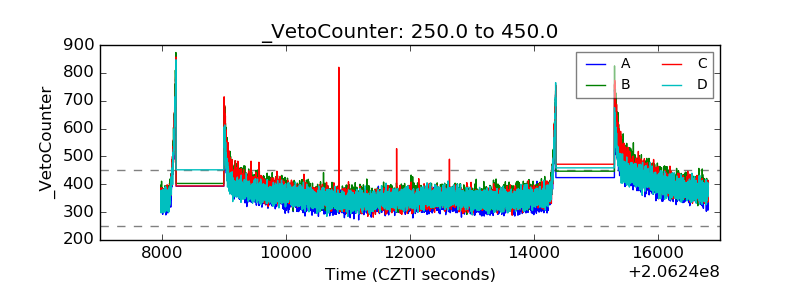 |