| Param | Original file | Final file |
|---|---|---|
| Filename | modeM0/AS1G05_219T01_9000000540_04310cztM0_level2.evt | modeM0/AS1G05_219T01_9000000540_04310cztM0_level2_quad_clean.evt |
| Size (bytes) | 460,687,680 | 69,756,480 |
| Size | 439.3 MB | 66.5 MB |
| Events in quadrant A | 3,347,612 | 418,899 |
| Events in quadrant B | 3,842,742 | 418,732 |
| Events in quadrant C | 3,023,478 | 411,996 |
| Events in quadrant D | 3,287,234 | 400,232 |
| Mode SS | |||
|---|---|---|---|
| Quadrant | BADHDUFLAG | Total packets | Discarded packets |
| A | 0 | 136 | 0 |
| B | 0 | 136 | 0 |
| C | 0 | 136 | 0 |
| D | 0 | 136 | 0 |
| Mode M9 | |||
|---|---|---|---|
| Quadrant | BADHDUFLAG | Total packets | Discarded packets |
| A | 0 | 17 | 0 |
| B | 0 | 17 | 0 |
| C | 0 | 17 | 0 |
| D | 0 | 18 | 0 |
| Mode M0 | |||
|---|---|---|---|
| Quadrant | BADHDUFLAG | Total packets | Discarded packets |
| A | 0 | 14332 | 3 |
| B | 0 | 15485 | 2 |
| C | 0 | 13593 | 2 |
| D | 0 | 14349 | 2 |
| Quadrant | Total seconds | Saturated seconds | Saturation percentage |
|---|---|---|---|
| A | 6626 | 139 | 2.097797% |
| B | 6626 | 230 | 3.471174% |
| C | 6626 | 63 | 0.950800% |
| D | 6626 | 80 | 1.207365% |
Noise dominated data is calculated using 1-second bins in cleaned event files. If a bin has >2000 counts, and if more than 50% of those come from <1% of pixels, then it is considered to be noise-dominated and hence unusable.
| Quadrant | # 1 sec bins | Bins with >0 counts | Bins with >2000 counts | High rate bins dominated by noise | Noise dominated (total time) | Noise dominated (detector-on time) | Marked lightcurve |
|---|---|---|---|---|---|---|---|
| A | 7696 | 6626 | 38 | 38 | 0.49% | 0.57% | 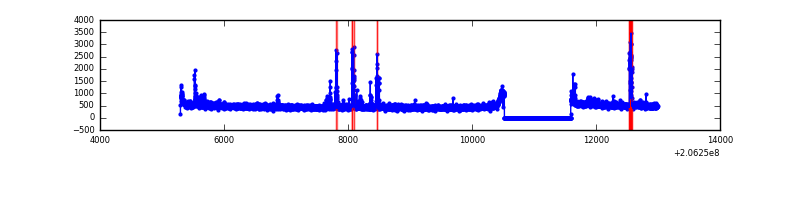 |
| B | 7696 | 6626 | 114 | 114 | 1.48% | 1.72% | 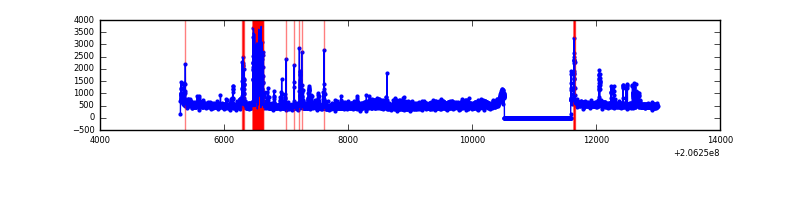 |
| C | 7696 | 6626 | 0 | 0 | 0.00% | 0.00% | 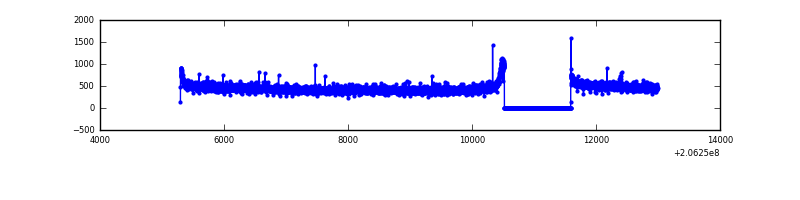 |
| D | 7696 | 6626 | 8 | 8 | 0.10% | 0.12% | 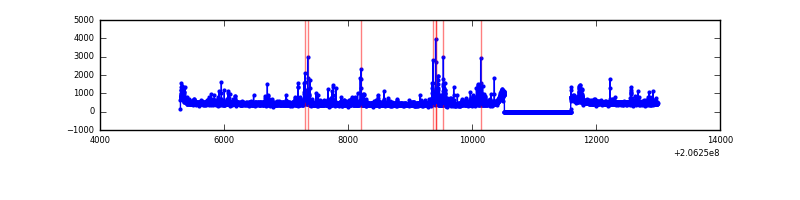 |
Top three noisy pixels from each quadrant. If the there are fewer than three noisy pixels in the level2.evt file, extra rows are filled as -1
| Pixel properties | Quadrant properties | ||||||
|---|---|---|---|---|---|---|---|
| Quadrant | DetID | PixID | Counts | Sigma | Mean | Median | Sigma |
| A | 15 | 234 | 224621 | 1364.11 | 800 | 784 | 164.1 |
| A | 13 | 251 | 23469 | 138.25 | 800 | 784 | 164.1 |
| A | 8 | 15 | 10757 | 60.78 | 800 | 784 | 164.1 |
| B | 5 | 184 | 417151 | 2730.29 | 796 | 777 | 152.5 |
| B | 3 | 0 | 149372 | 974.38 | 796 | 777 | 152.5 |
| B | 15 | 204 | 64250 | 416.21 | 796 | 777 | 152.5 |
| C | 10 | 65 | 8259 | 41.37 | 770 | 774 | 180.9 |
| C | 13 | 61 | 6489 | 31.58 | 770 | 774 | 180.9 |
| C | 9 | 247 | 5572 | 26.52 | 770 | 774 | 180.9 |
| D | 13 | 239 | 120944 | 649.64 | 772 | 753 | 185.0 |
| D | 2 | 136 | 57208 | 305.14 | 772 | 753 | 185.0 |
| D | 12 | 233 | 43848 | 232.93 | 772 | 753 | 185.0 |
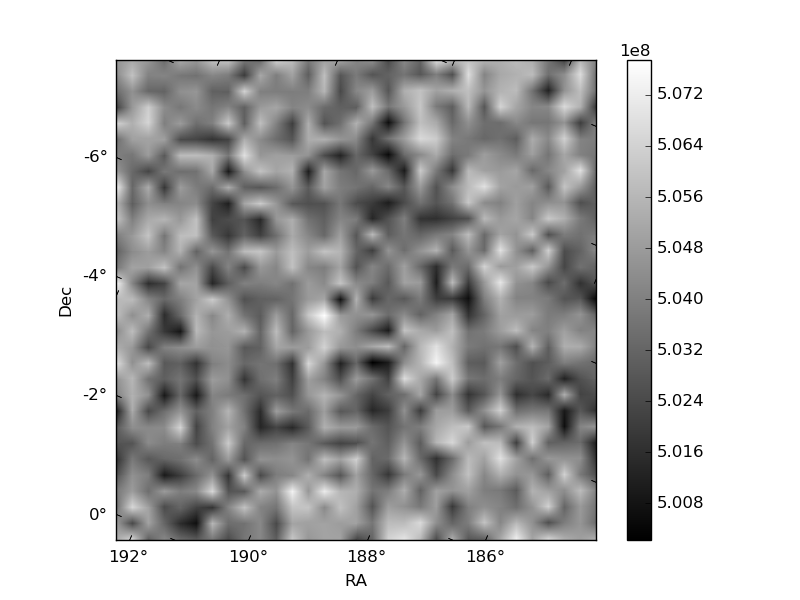
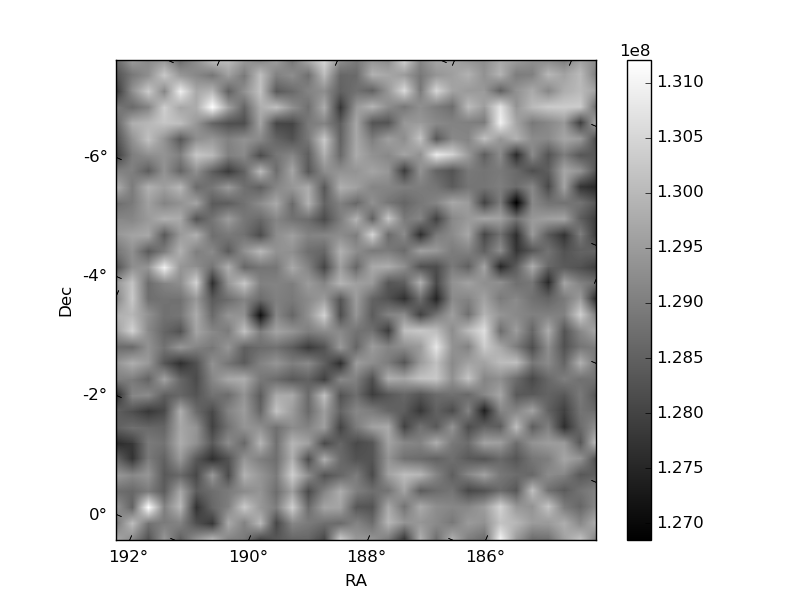
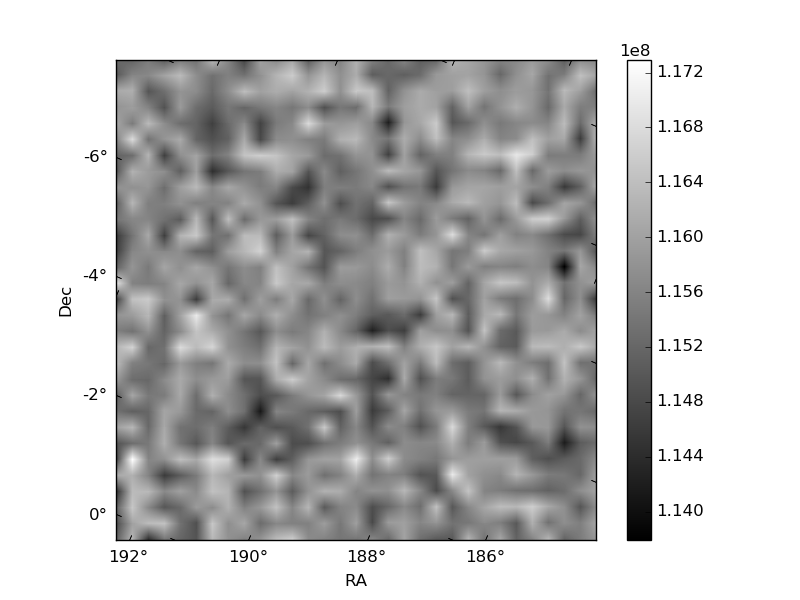
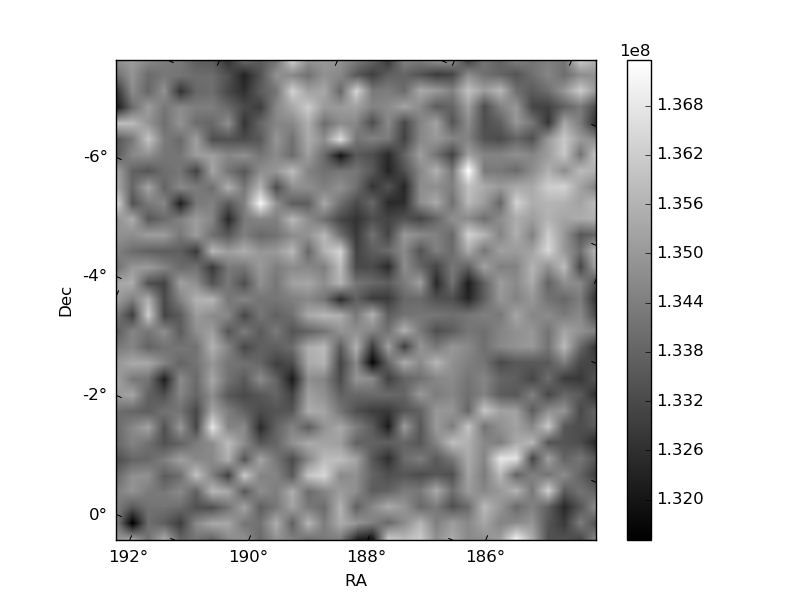
Histogram calculated using DETX and DETY for each event in the final _common_clean file
| Quadrant A | 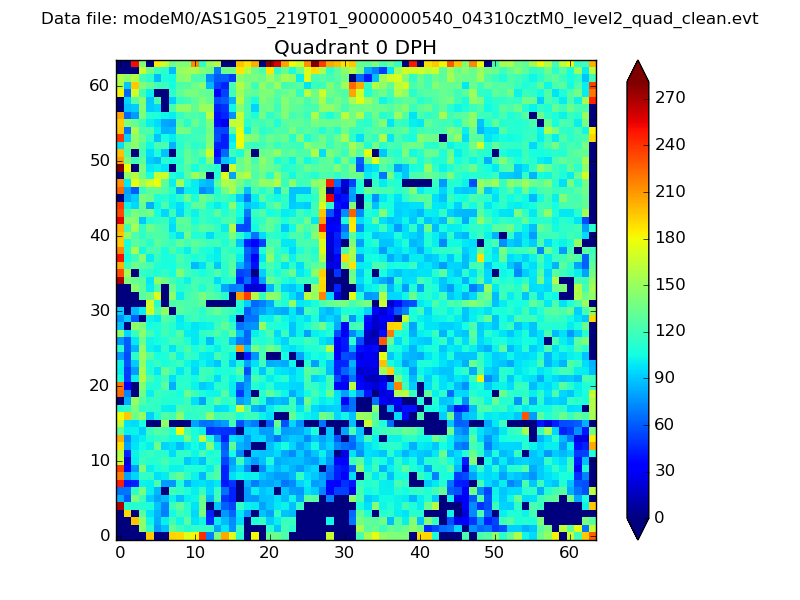 |
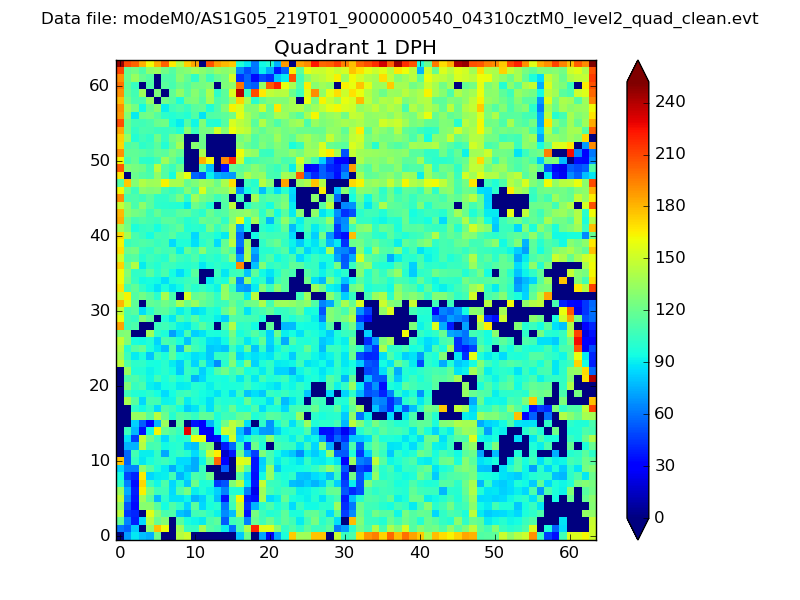 |
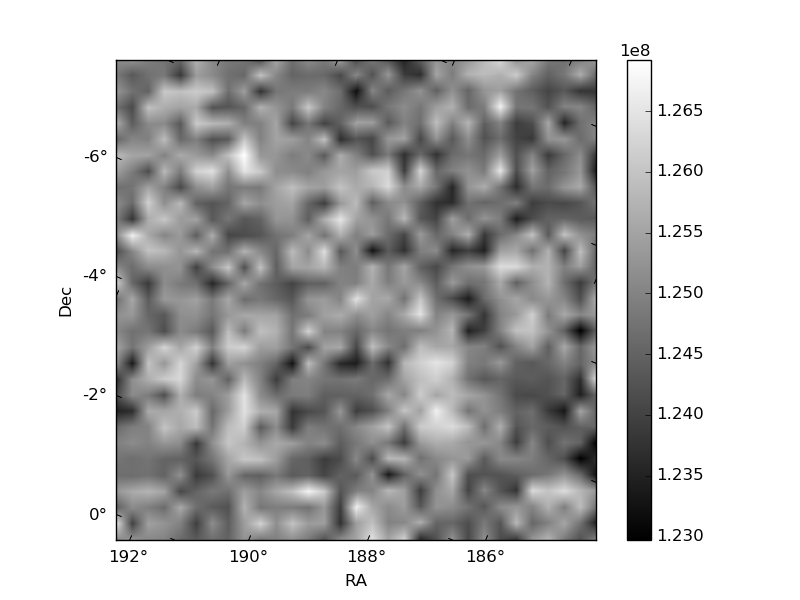
Quadrant B |
|---|---|---|---|
| Quadrant D | 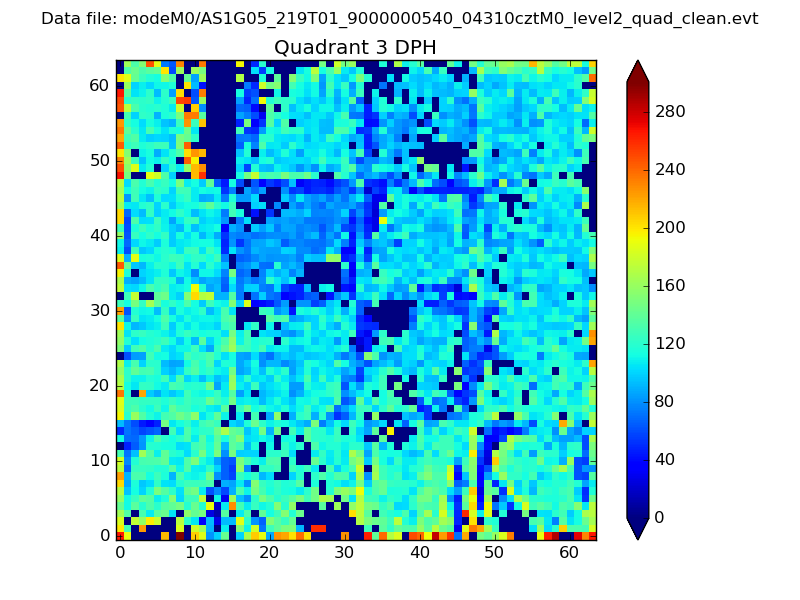 |
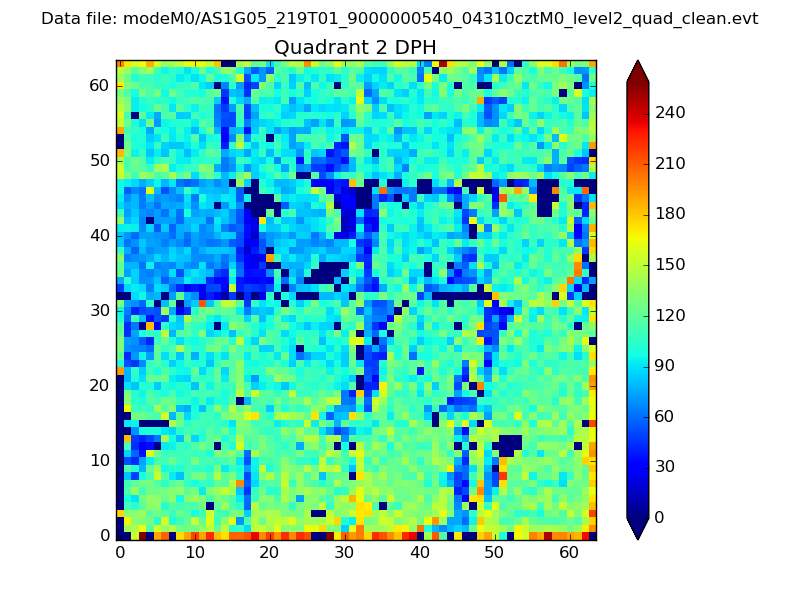 |
Quadrant C |
| Plot type | Count rate plots | Images |
|---|---|---|
| Comparison with Poisson distribution Blue bars denote a histogram of data divided into 1 sec bins. Red curve is a Poisson curve with rate = median count rate of data. |
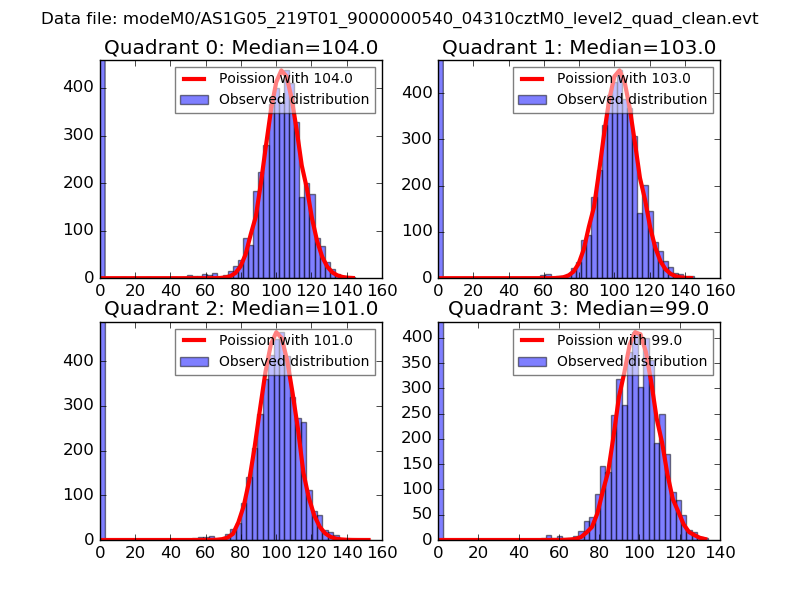 |
 |
| Quadrant-wise count rates Data is divided into 100 sec bins |
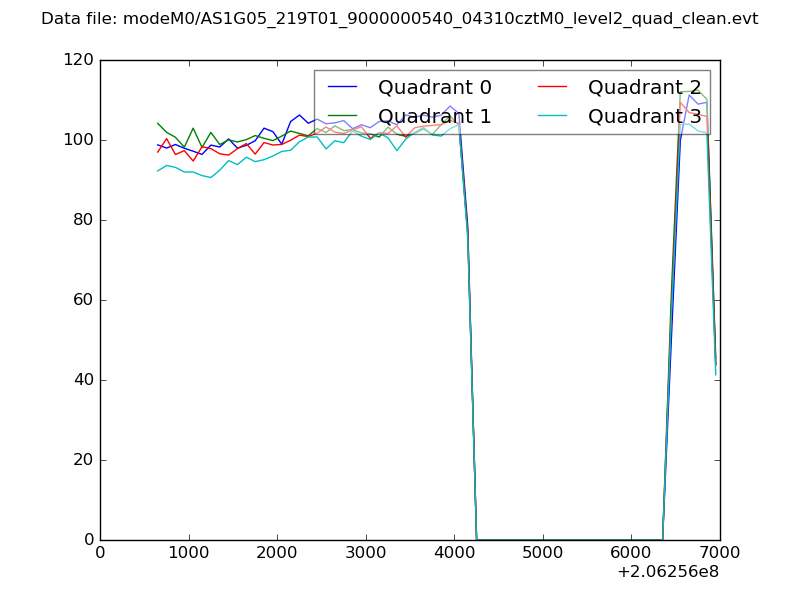 |
|
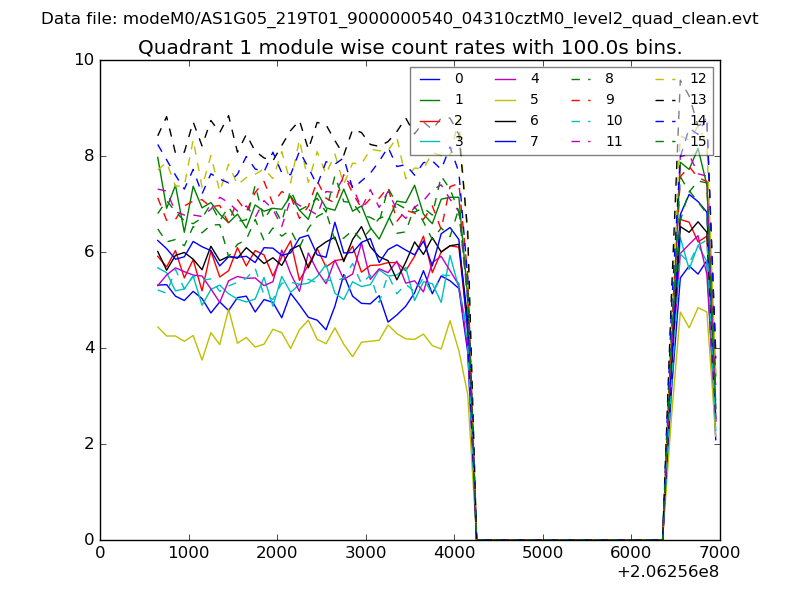
| Module-wise count rates for Quadrant A Data is divided into 100 sec bins |
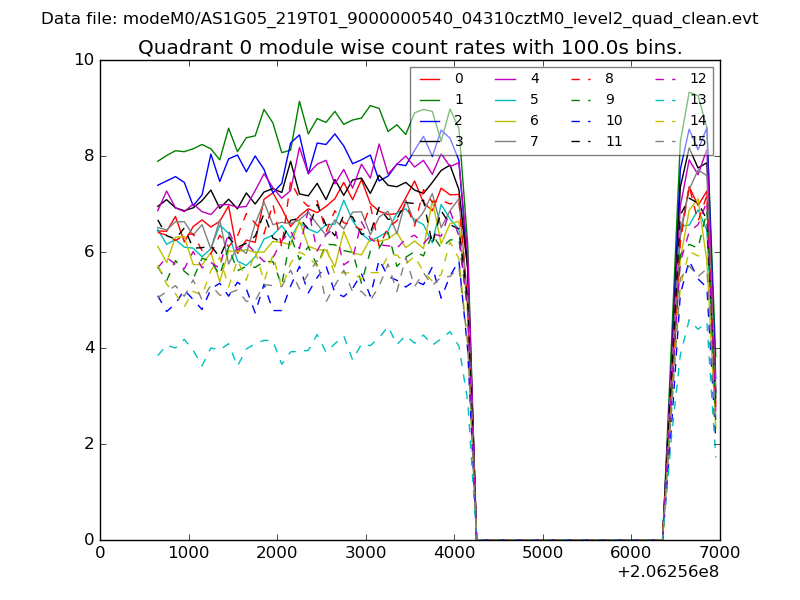 |
 |
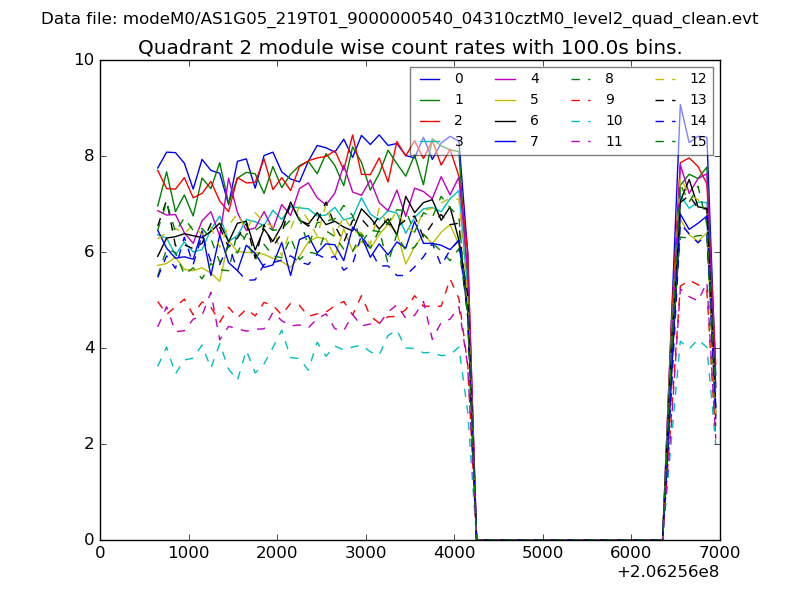
| Module-wise count rates for Quadrant B Data is divided into 100 sec bins |
 |
 |
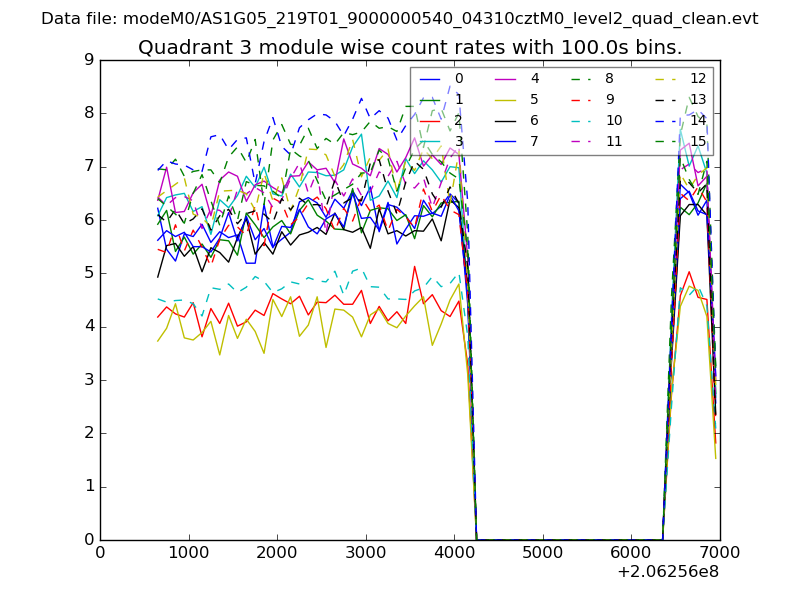
| Module-wise count rates for Quadrant C Data is divided into 100 sec bins |
 |
 |
| Module-wise count rates for Quadrant D Data is divided into 100 sec bins |
 |
 |
| Parameter | Plot |
|---|---|
| CZT HV Monitor | 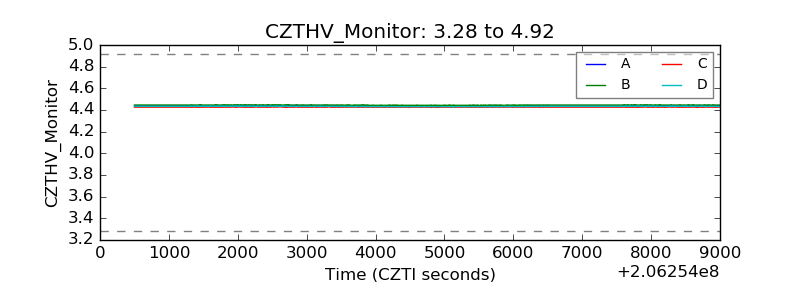 |
| D_VDD | 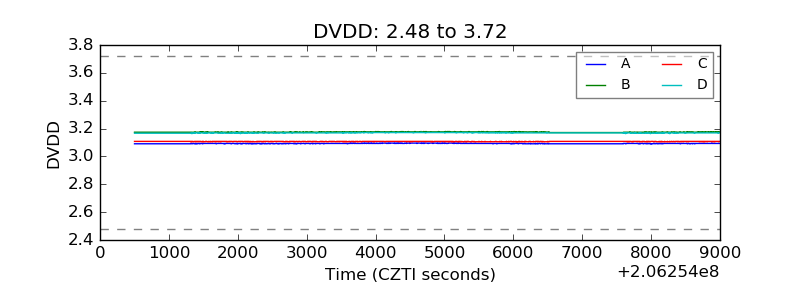 |
| Temperature 1 | 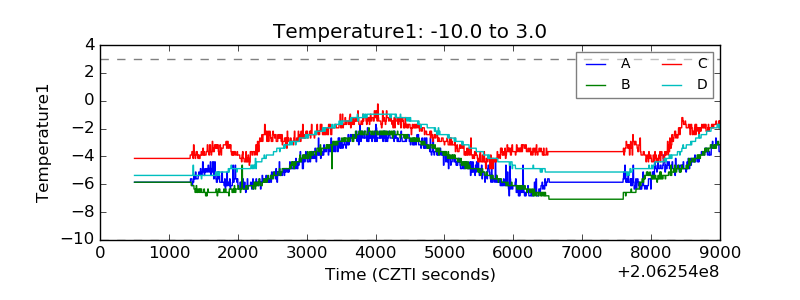 |
| Veto HV Monitor | 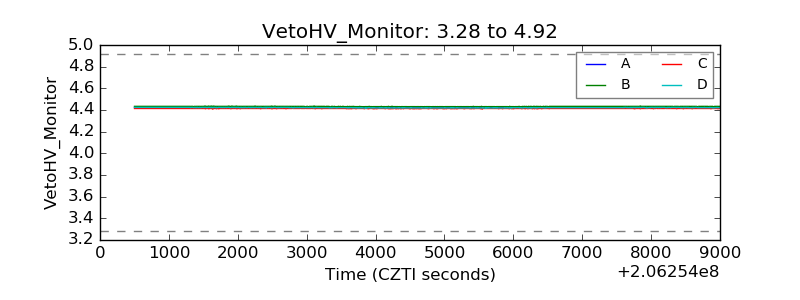 |
| Veto LLD | 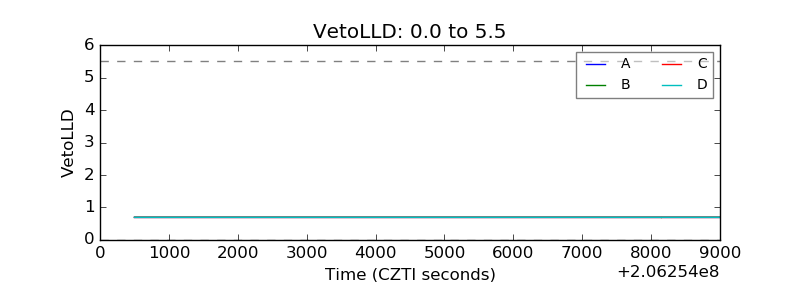 |
| Alpha Counter | 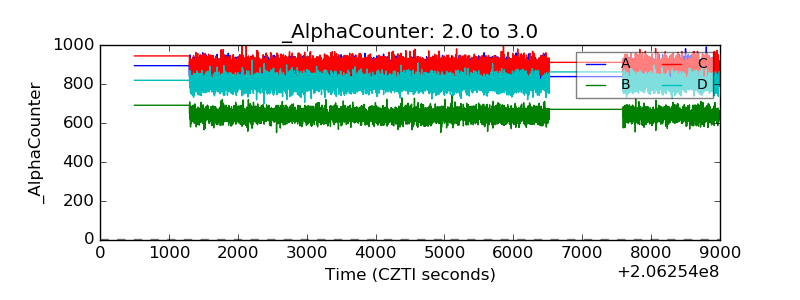 |
| _CPM_Rate | 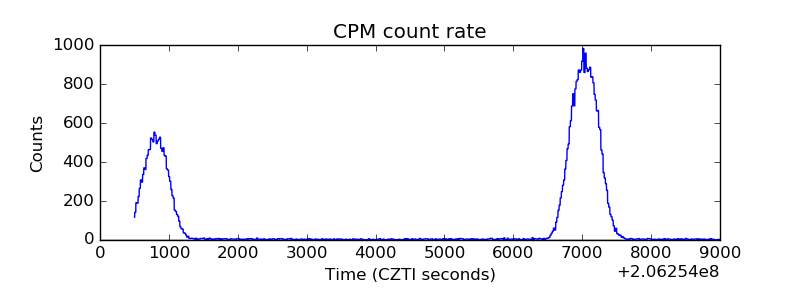 |
| CZT Counter | 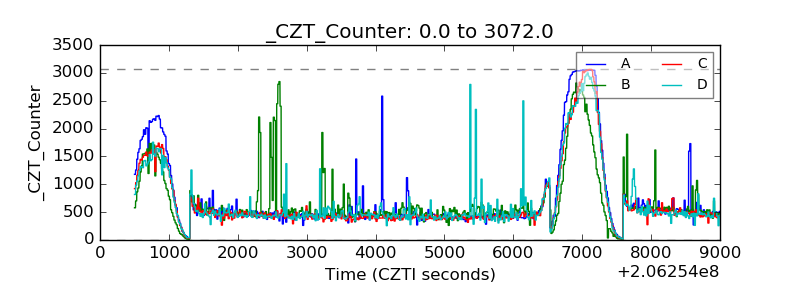 |
| +2.5 Volts monitor | 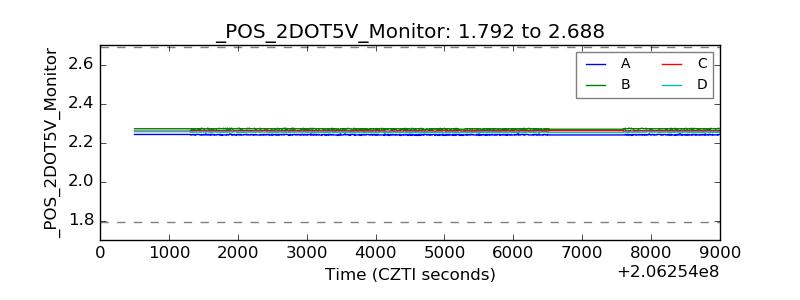 |
| +5 Volts monitor |  |
| _ROLL_ROT | 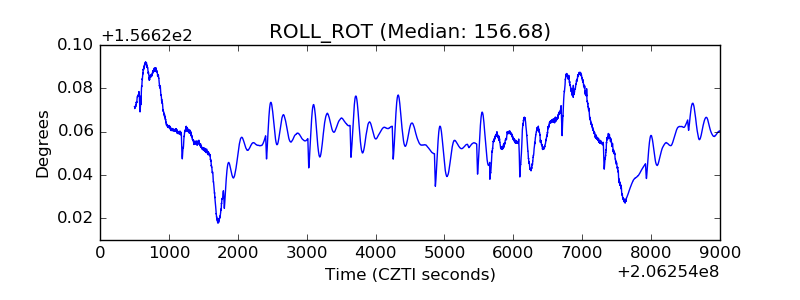 |
| _Roll_DEC | 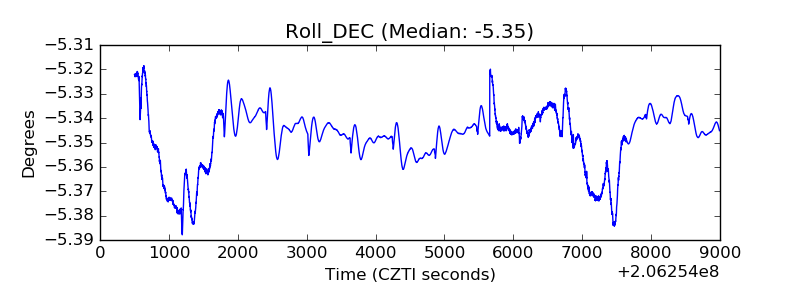 |
| _Roll_RA | 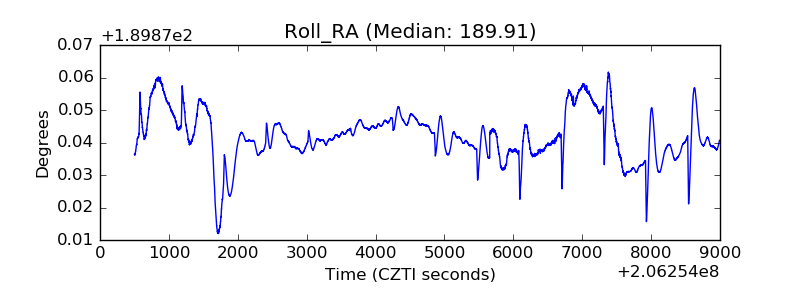 |
| Veto Counter | 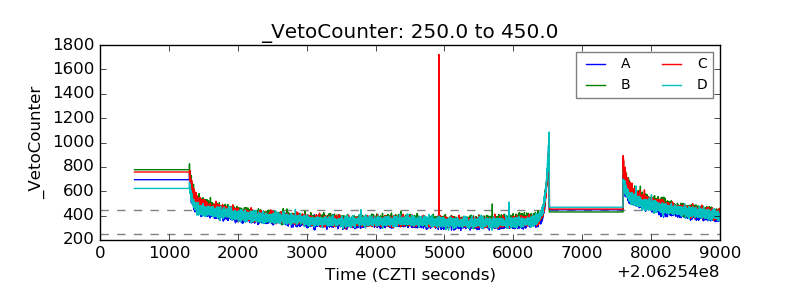 |