| Param | Original file | Final file |
|---|---|---|
| Filename | modeM0/AS1G05_219T01_9000000540_04313cztM0_level2.evt | modeM0/AS1G05_219T01_9000000540_04313cztM0_level2_quad_clean.evt |
| Size (bytes) | 477,645,120 | 80,023,680 |
| Size | 455.5 MB | 76.3 MB |
| Events in quadrant A | 5,189,783 | 509,381 |
| Events in quadrant B | 3,146,527 | 513,567 |
| Events in quadrant C | 2,689,480 | 506,115 |
| Events in quadrant D | 3,048,134 | 490,506 |
| Mode SS | |||
|---|---|---|---|
| Quadrant | BADHDUFLAG | Total packets | Discarded packets |
| A | 0 | 118 | 0 |
| B | 0 | 118 | 0 |
| C | 0 | 118 | 0 |
| D | 0 | 118 | 0 |
| Mode M9 | |||
|---|---|---|---|
| Quadrant | BADHDUFLAG | Total packets | Discarded packets |
| A | 0 | 13 | 0 |
| B | 0 | 13 | 0 |
| C | 0 | 13 | 0 |
| D | 0 | 13 | 0 |
| Mode M0 | |||
|---|---|---|---|
| Quadrant | BADHDUFLAG | Total packets | Discarded packets |
| A | 0 | 19589 | 2 |
| B | 0 | 13008 | 1 |
| C | 0 | 11928 | 1 |
| D | 0 | 12954 | 1 |
| Quadrant | Total seconds | Saturated seconds | Saturation percentage |
|---|---|---|---|
| A | 5773 | 189 | 3.273861% |
| B | 5773 | 114 | 1.974710% |
| C | 5773 | 80 | 1.385761% |
| D | 5773 | 132 | 2.286506% |
Noise dominated data is calculated using 1-second bins in cleaned event files. If a bin has >2000 counts, and if more than 50% of those come from <1% of pixels, then it is considered to be noise-dominated and hence unusable.
| Quadrant | # 1 sec bins | Bins with >0 counts | Bins with >2000 counts | High rate bins dominated by noise | Noise dominated (total time) | Noise dominated (detector-on time) | Marked lightcurve |
|---|---|---|---|---|---|---|---|
| A | 7028 | 5773 | 36 | 36 | 0.51% | 0.62% | 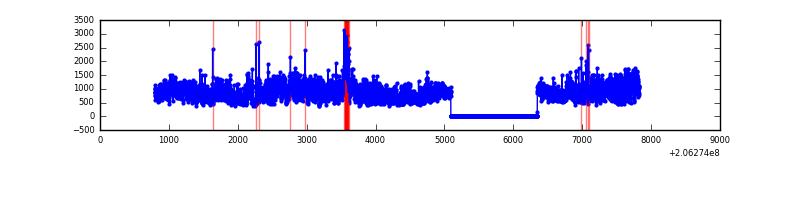 |
| B | 7028 | 5773 | 15 | 15 | 0.21% | 0.26% | 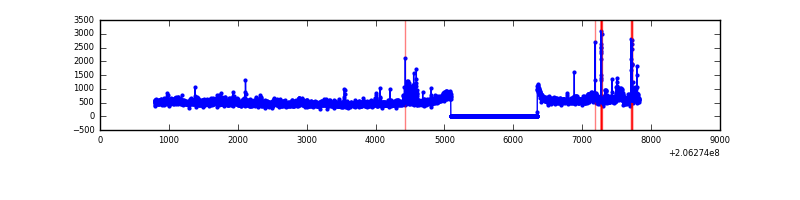 |
| C | 7028 | 5773 | 0 | 0 | 0.00% | 0.00% | 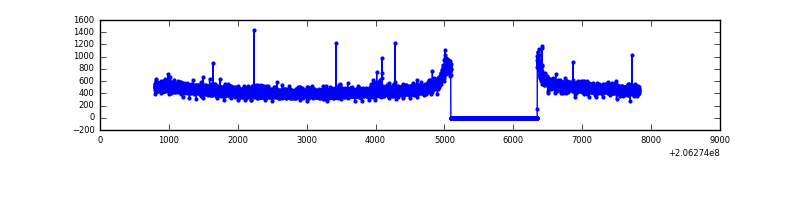 |
| D | 7028 | 5773 | 40 | 40 | 0.57% | 0.69% | 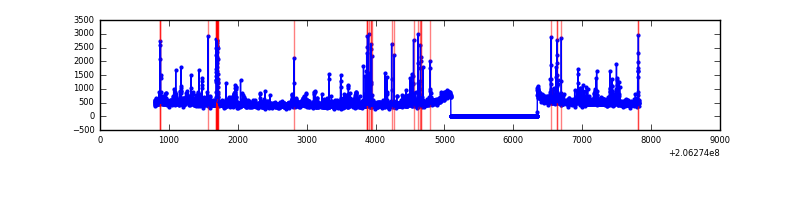 |
Top three noisy pixels from each quadrant. If the there are fewer than three noisy pixels in the level2.evt file, extra rows are filled as -1
| Pixel properties | Quadrant properties | ||||||
|---|---|---|---|---|---|---|---|
| Quadrant | DetID | PixID | Counts | Sigma | Mean | Median | Sigma |
| A | 13 | 251 | 2322431 | 16040.06 | 711 | 696 | 144.7 |
| A | 0 | 50 | 87185 | 597.52 | 711 | 696 | 144.7 |
| A | 8 | 15 | 24350 | 163.42 | 711 | 696 | 144.7 |
| B | 3 | 0 | 103375 | 756.95 | 711 | 698 | 135.6 |
| B | 15 | 204 | 85654 | 626.31 | 711 | 698 | 135.6 |
| B | 4 | 48 | 62385 | 454.77 | 711 | 698 | 135.6 |
| C | 10 | 65 | 10038 | 58.75 | 684 | 688 | 159.1 |
| C | 13 | 61 | 5762 | 31.88 | 684 | 688 | 159.1 |
| C | 9 | 247 | 4597 | 24.56 | 684 | 688 | 159.1 |
| D | 2 | 136 | 122091 | 733.74 | 690 | 670 | 165.5 |
| D | 10 | 172 | 68653 | 410.82 | 690 | 670 | 165.5 |
| D | 5 | 97 | 52250 | 311.7 | 690 | 670 | 165.5 |
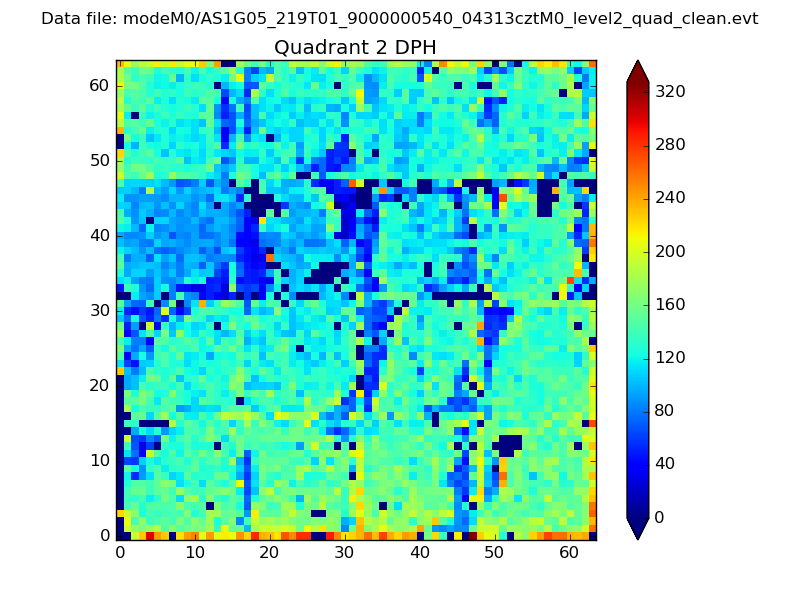
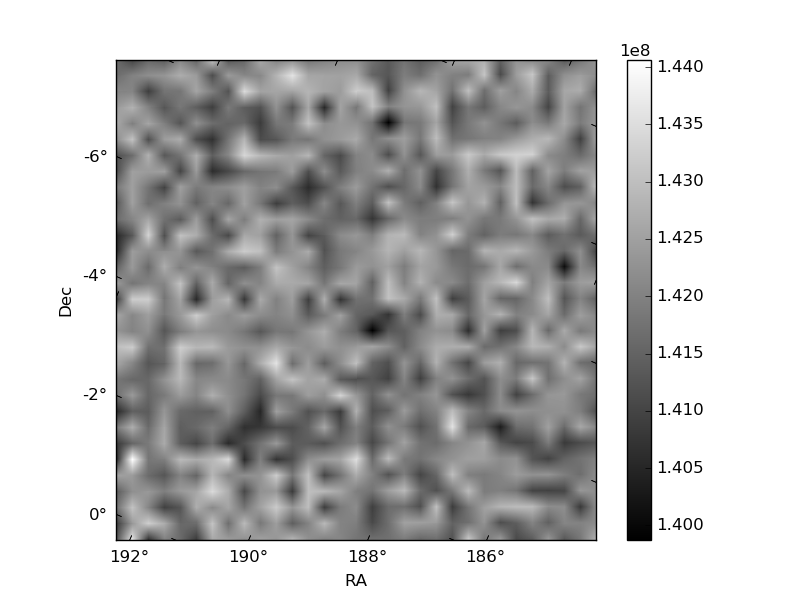
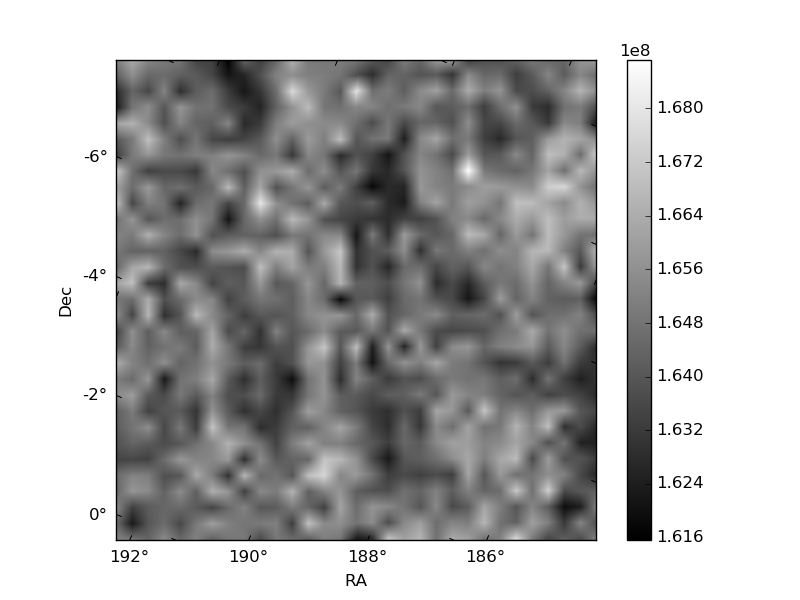
Histogram calculated using DETX and DETY for each event in the final _common_clean file
| Quadrant A | 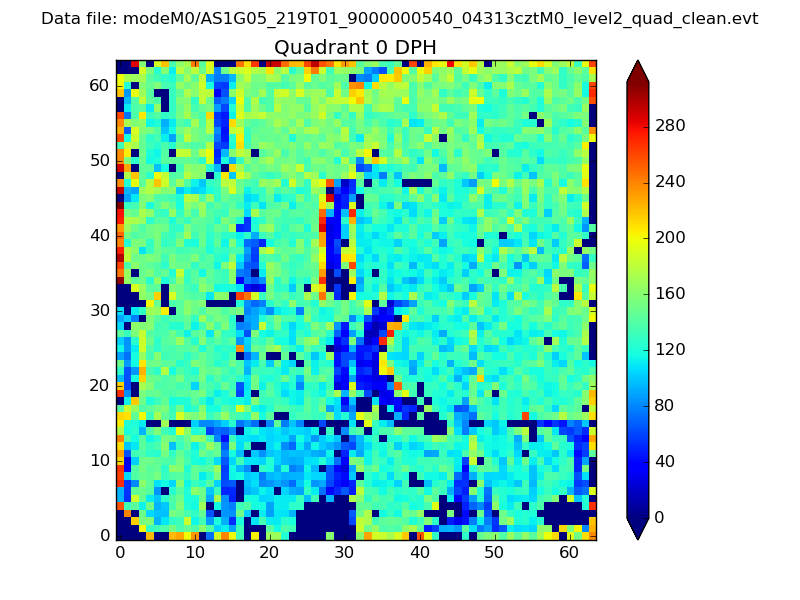 |
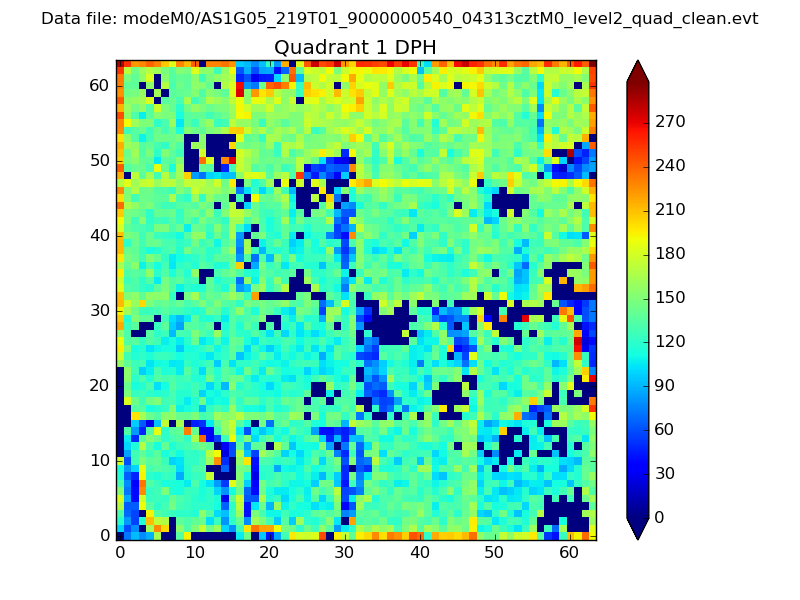 |
Quadrant B |
|---|---|---|---|
| Quadrant D | 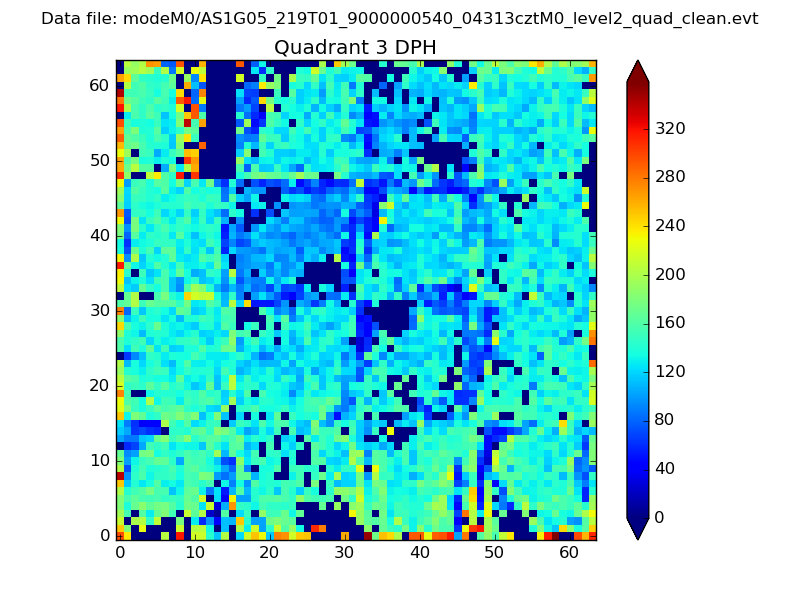 |
 |
Quadrant C |
| Plot type | Count rate plots | Images |
|---|---|---|
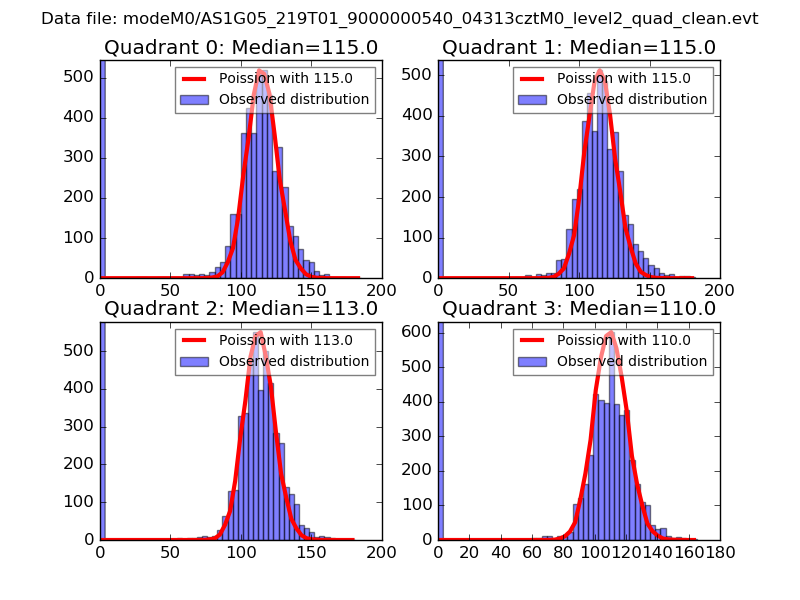
| Comparison with Poisson distribution Blue bars denote a histogram of data divided into 1 sec bins. Red curve is a Poisson curve with rate = median count rate of data. |
 |
 |
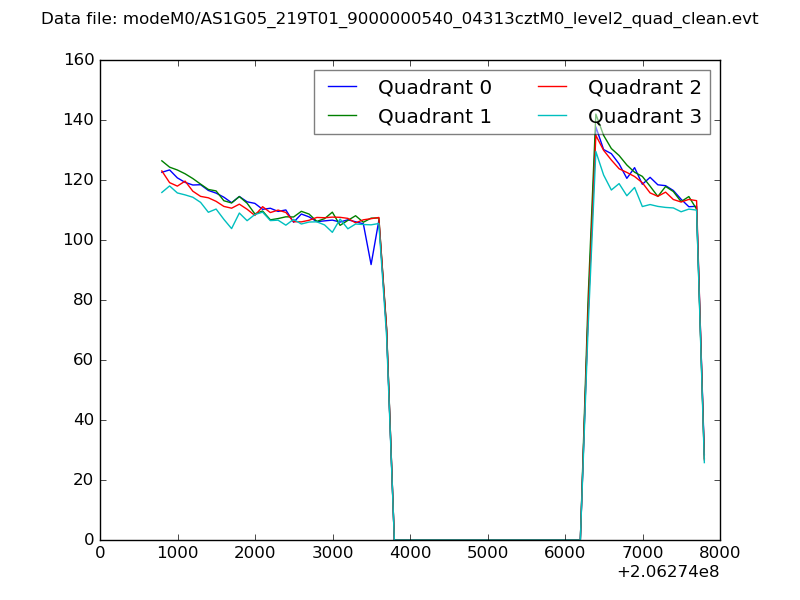
| Quadrant-wise count rates Data is divided into 100 sec bins |
 |
|
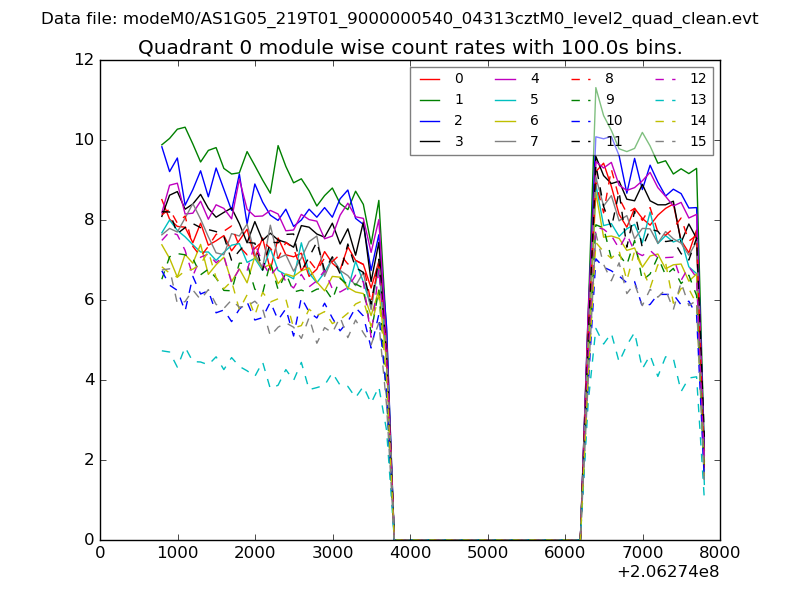
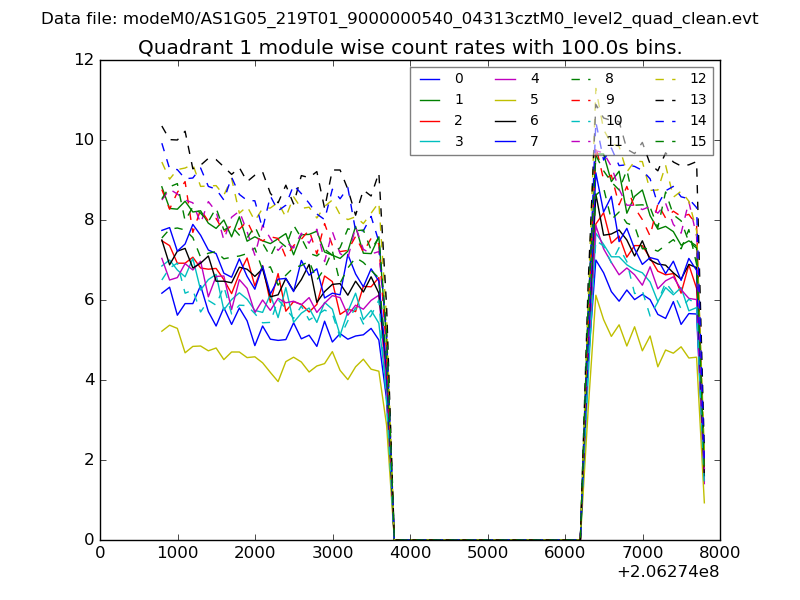
| Module-wise count rates for Quadrant A Data is divided into 100 sec bins |
 |
 |
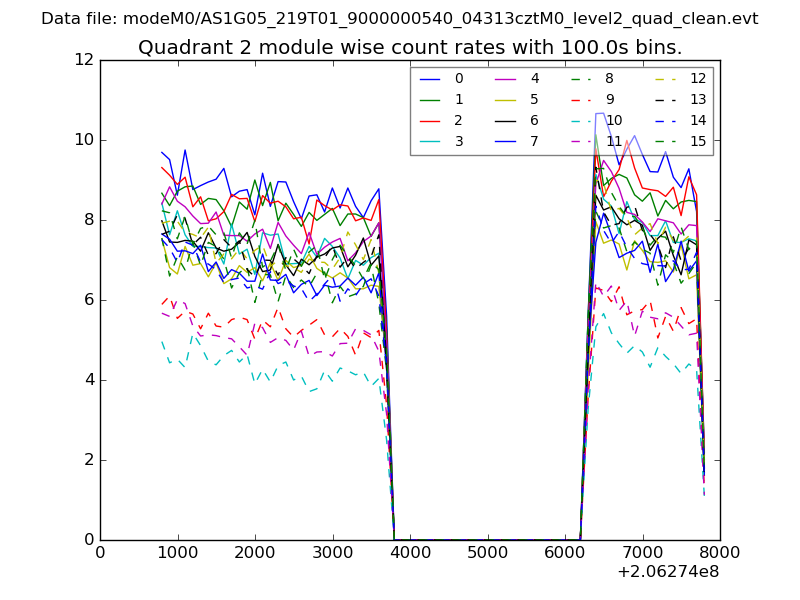
| Module-wise count rates for Quadrant B Data is divided into 100 sec bins |
 |
 |
| Module-wise count rates for Quadrant C Data is divided into 100 sec bins |
 |
 |
| Module-wise count rates for Quadrant D Data is divided into 100 sec bins |
 |
 |
| Parameter | Plot |
|---|---|
| CZT HV Monitor | 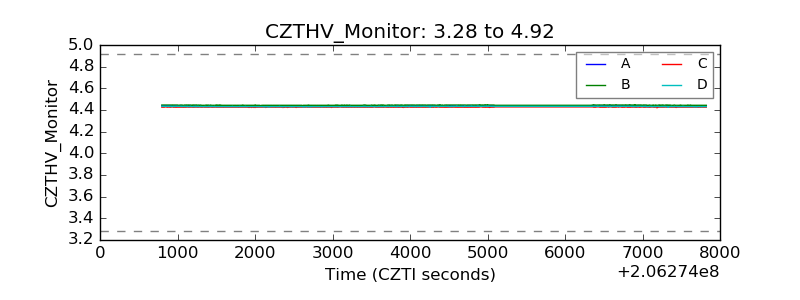 |
| D_VDD | 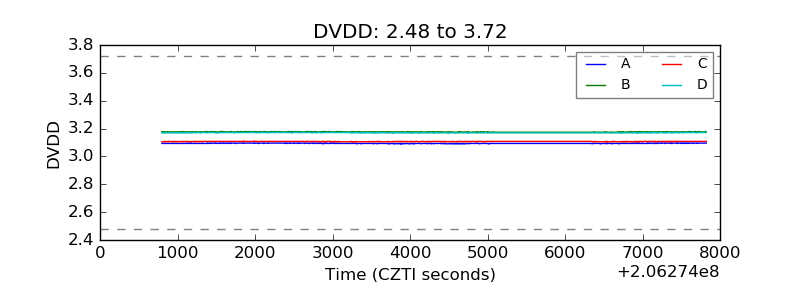 |
| Temperature 1 | 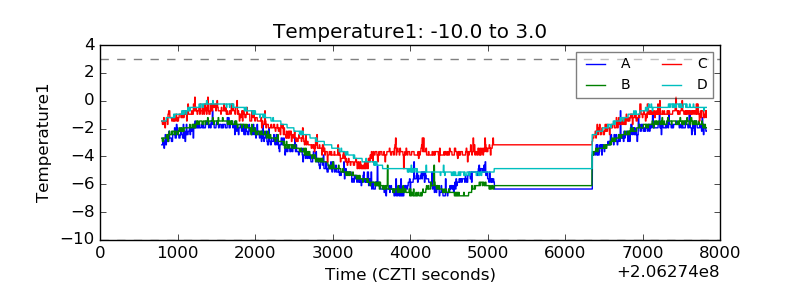 |
| Veto HV Monitor | 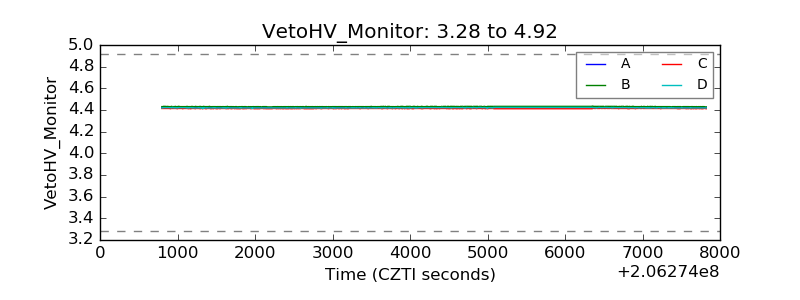 |
| Veto LLD | 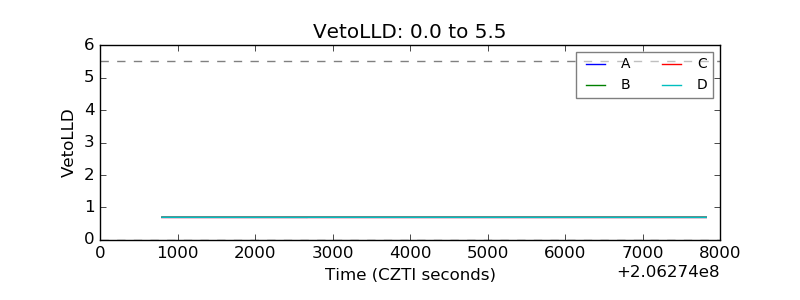 |
| Alpha Counter | 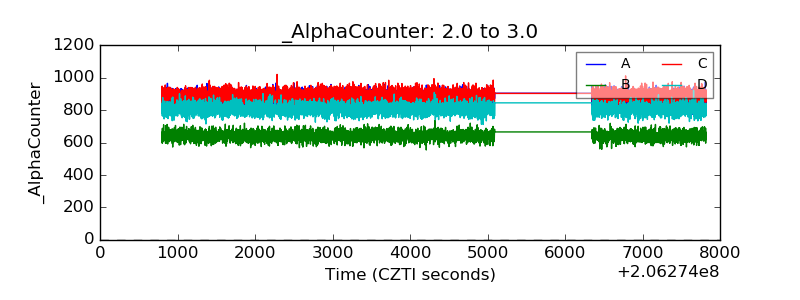 |
| _CPM_Rate | 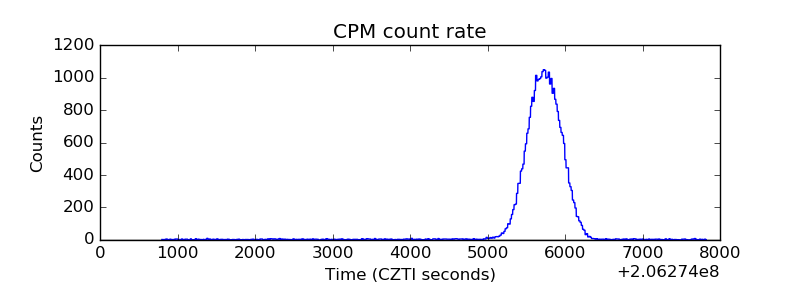 |
| CZT Counter | 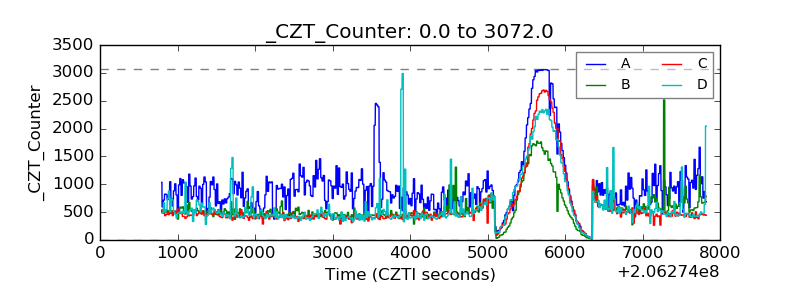 |
| +2.5 Volts monitor |  |
| +5 Volts monitor | 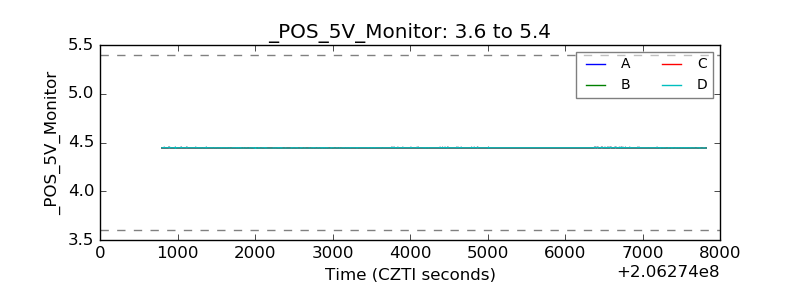 |
| _ROLL_ROT | 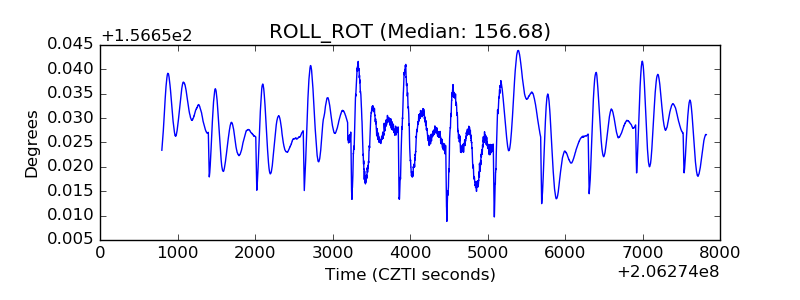 |
| _Roll_DEC | 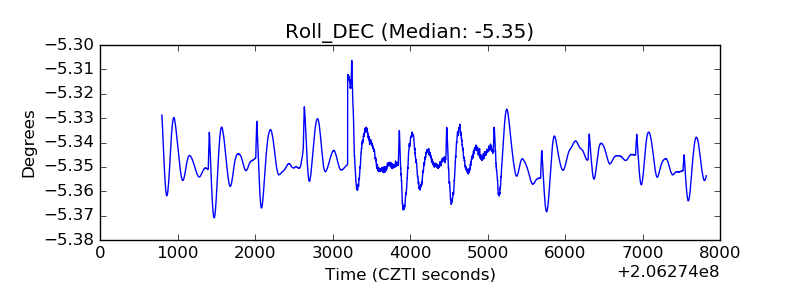 |
| _Roll_RA | 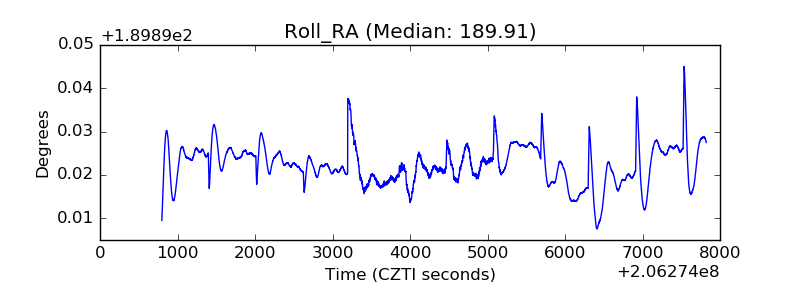 |
| Veto Counter | 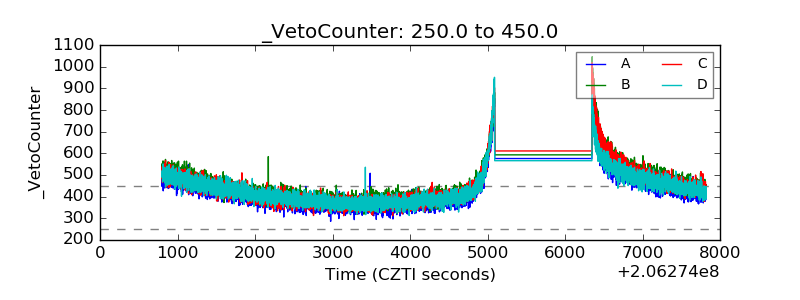 |