| Param | Original file | Final file |
|---|---|---|
| Filename | modeM0/AS1G05_219T01_9000000540_04314cztM0_level2.evt | modeM0/AS1G05_219T01_9000000540_04314cztM0_level2_quad_clean.evt |
| Size (bytes) | 468,509,760 | 78,287,040 |
| Size | 446.8 MB | 74.7 MB |
| Events in quadrant A | 4,187,473 | 492,834 |
| Events in quadrant B | 3,642,102 | 487,614 |
| Events in quadrant C | 2,840,502 | 485,514 |
| Events in quadrant D | 3,100,334 | 474,281 |
| Mode SS | |||
|---|---|---|---|
| Quadrant | BADHDUFLAG | Total packets | Discarded packets |
| A | 0 | 124 | 0 |
| B | 0 | 124 | 0 |
| C | 0 | 124 | 0 |
| D | 0 | 124 | 0 |
| Mode M9 | |||
|---|---|---|---|
| Quadrant | BADHDUFLAG | Total packets | Discarded packets |
| A | 0 | 13 | 0 |
| B | 0 | 13 | 0 |
| C | 0 | 13 | 0 |
| D | 0 | 13 | 0 |
| Mode M0 | |||
|---|---|---|---|
| Quadrant | BADHDUFLAG | Total packets | Discarded packets |
| A | 0 | 16532 | 2 |
| B | 0 | 15058 | 1 |
| C | 0 | 12771 | 1 |
| D | 0 | 13508 | 1 |
| Quadrant | Total seconds | Saturated seconds | Saturation percentage |
|---|---|---|---|
| A | 6168 | 147 | 2.383268% |
| B | 6168 | 134 | 2.172503% |
| C | 6168 | 70 | 1.134890% |
| D | 6168 | 96 | 1.556420% |
Noise dominated data is calculated using 1-second bins in cleaned event files. If a bin has >2000 counts, and if more than 50% of those come from <1% of pixels, then it is considered to be noise-dominated and hence unusable.
| Quadrant | # 1 sec bins | Bins with >0 counts | Bins with >2000 counts | High rate bins dominated by noise | Noise dominated (total time) | Noise dominated (detector-on time) | Marked lightcurve |
|---|---|---|---|---|---|---|---|
| A | 7393 | 6168 | 15 | 15 | 0.20% | 0.24% | 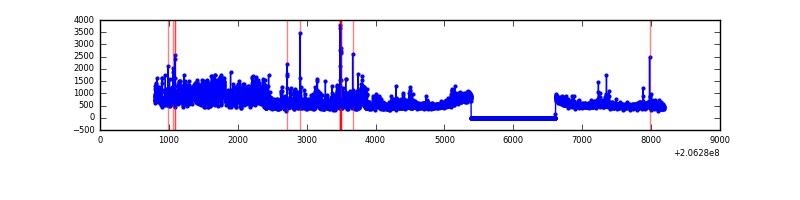 |
| B | 7393 | 6168 | 17 | 17 | 0.23% | 0.28% | 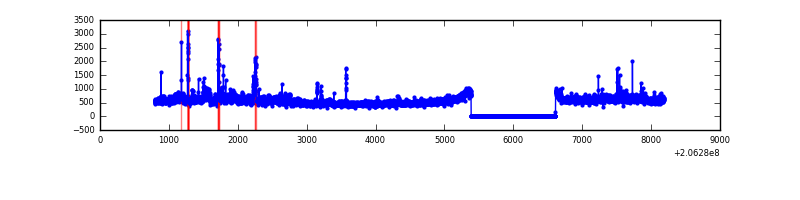 |
| C | 7393 | 6168 | 1 | 1 | 0.01% | 0.02% | 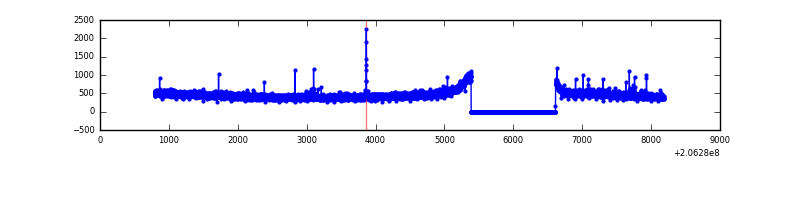 |
| D | 7393 | 6168 | 11 | 11 | 0.15% | 0.18% | 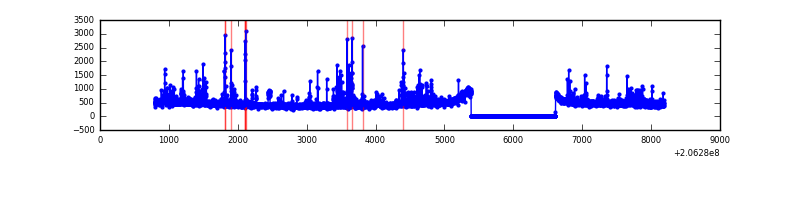 |
Top three noisy pixels from each quadrant. If the there are fewer than three noisy pixels in the level2.evt file, extra rows are filled as -1
| Pixel properties | Quadrant properties | ||||||
|---|---|---|---|---|---|---|---|
| Quadrant | DetID | PixID | Counts | Sigma | Mean | Median | Sigma |
| A | 13 | 251 | 1187872 | 7766.61 | 747 | 732 | 152.9 |
| A | 15 | 234 | 55656 | 359.33 | 747 | 732 | 152.9 |
| A | 0 | 50 | 25656 | 163.06 | 747 | 732 | 152.9 |
| B | 3 | 0 | 375578 | 2649.87 | 745 | 729 | 141.5 |
| B | 15 | 204 | 122373 | 859.92 | 745 | 729 | 141.5 |
| B | 14 | 167 | 65131 | 455.27 | 745 | 729 | 141.5 |
| C | 12 | 4 | 13965 | 78.58 | 719 | 719 | 168.6 |
| C | 10 | 65 | 11503 | 63.98 | 719 | 719 | 168.6 |
| C | 9 | 247 | 6879 | 36.54 | 719 | 719 | 168.6 |
| D | 4 | 95 | 72613 | 409.69 | 726 | 705 | 175.5 |
| D | 2 | 136 | 59553 | 335.28 | 726 | 705 | 175.5 |
| D | 13 | 53 | 48449 | 272.02 | 726 | 705 | 175.5 |
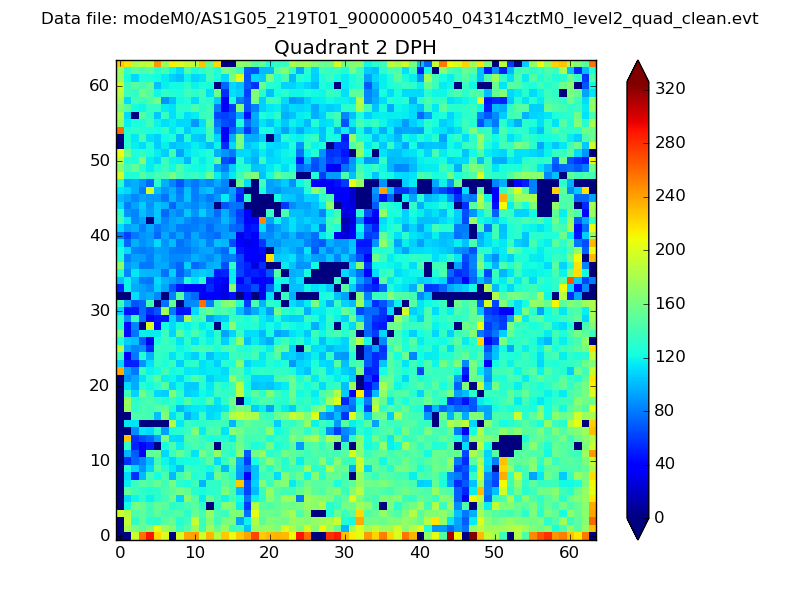
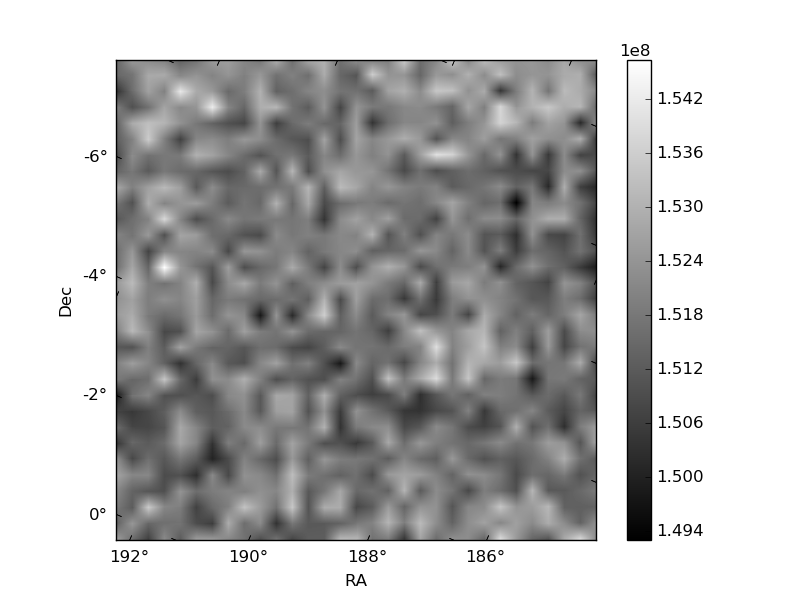
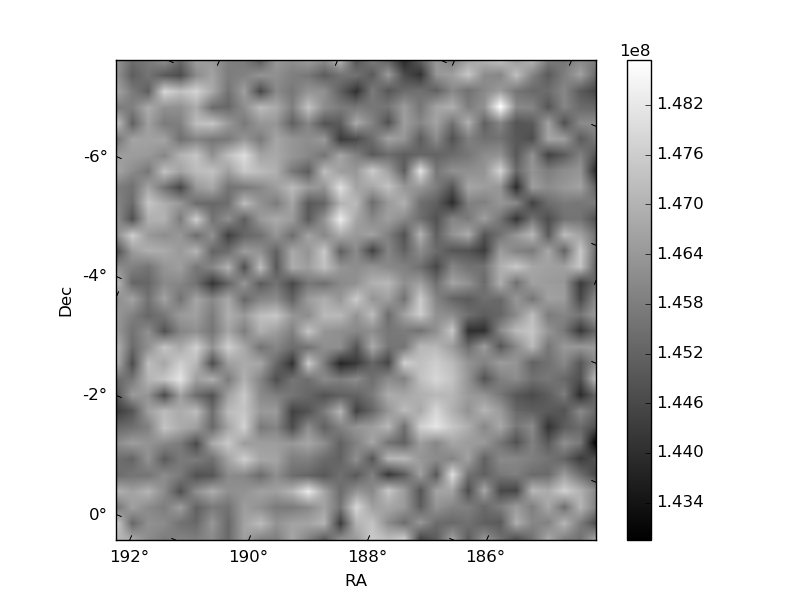
Histogram calculated using DETX and DETY for each event in the final _common_clean file
| Quadrant A | 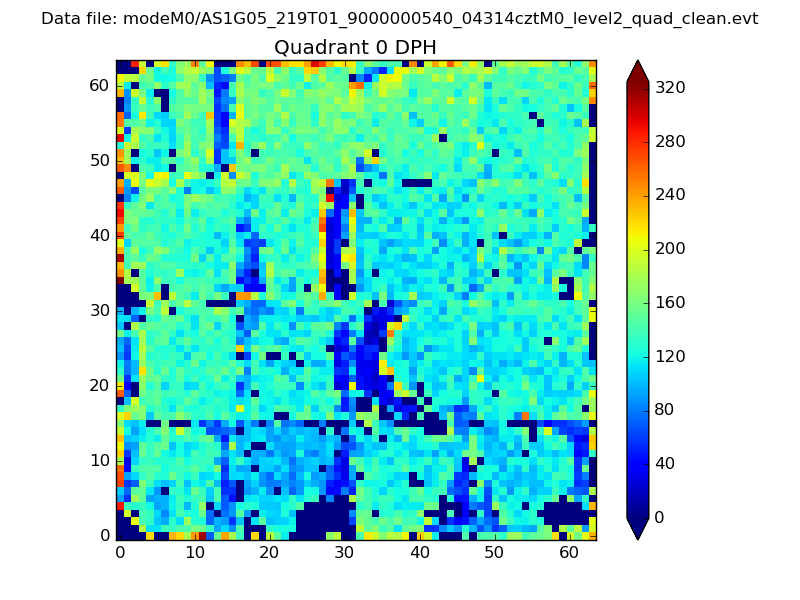 |
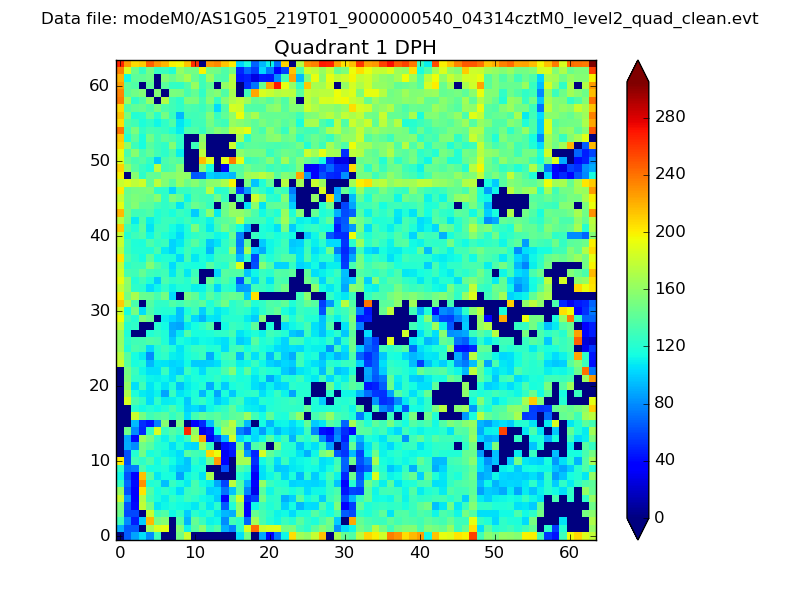 |
Quadrant B |
|---|---|---|---|
| Quadrant D | 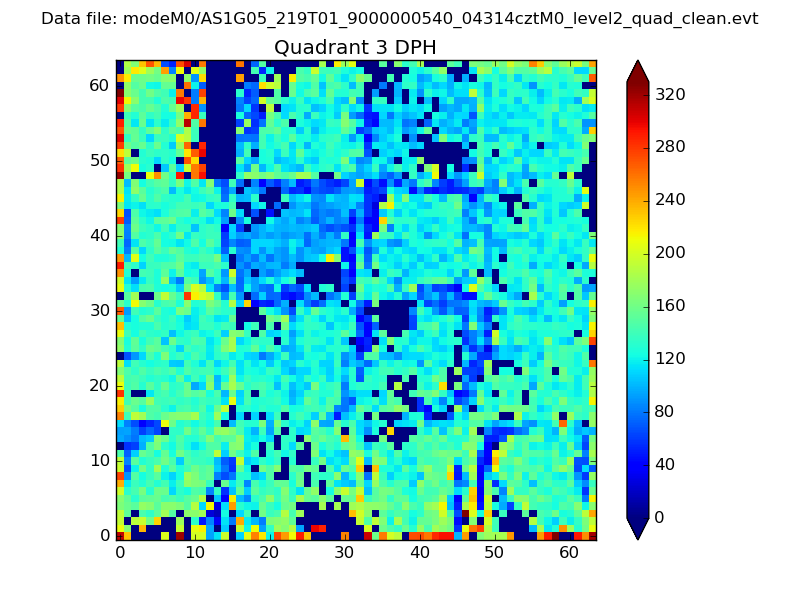 |
 |
Quadrant C |
| Plot type | Count rate plots | Images |
|---|---|---|
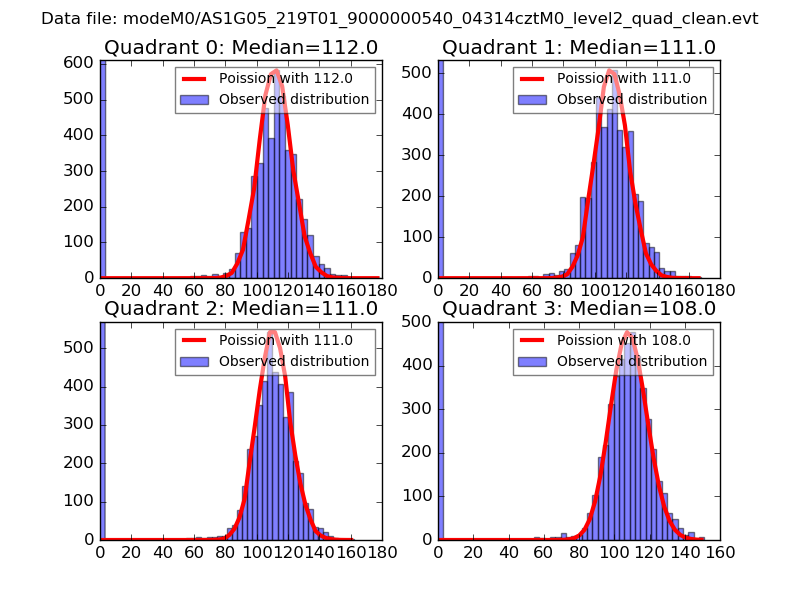
| Comparison with Poisson distribution Blue bars denote a histogram of data divided into 1 sec bins. Red curve is a Poisson curve with rate = median count rate of data. |
 |
 |
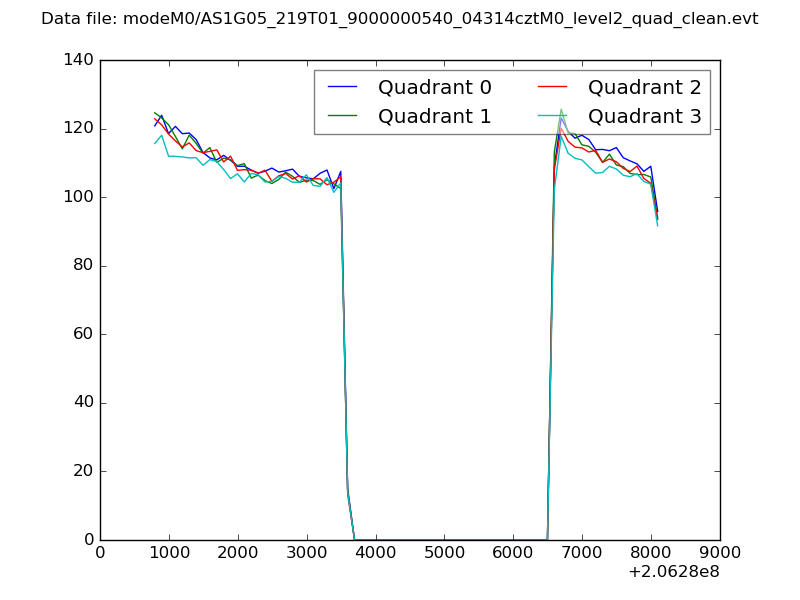
| Quadrant-wise count rates Data is divided into 100 sec bins |
 |
|
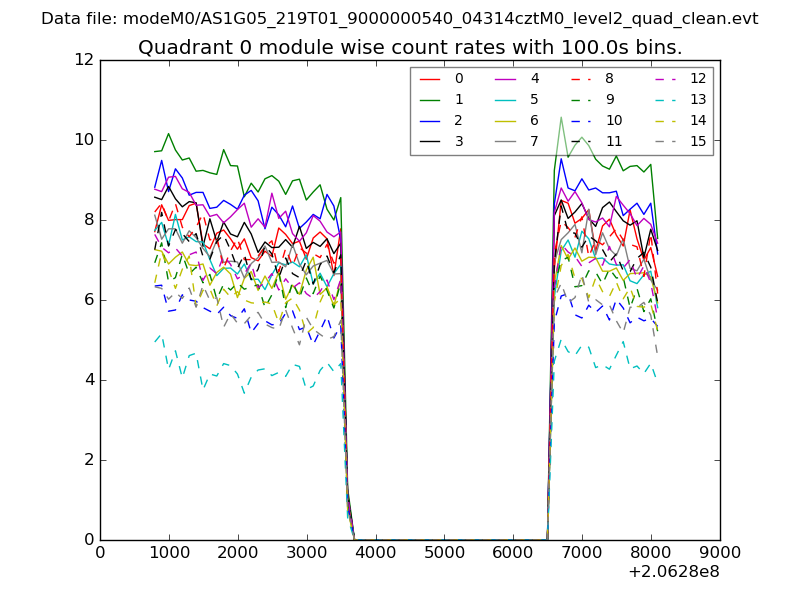
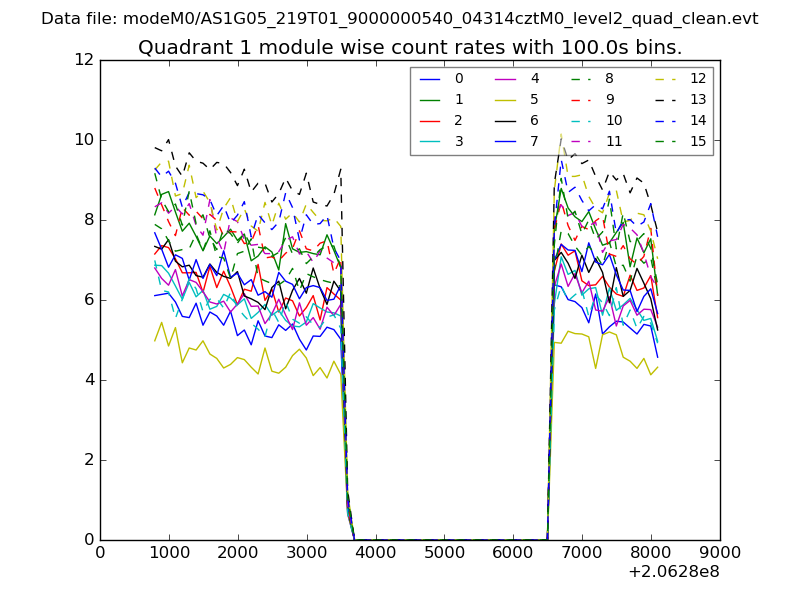
| Module-wise count rates for Quadrant A Data is divided into 100 sec bins |
 |
 |
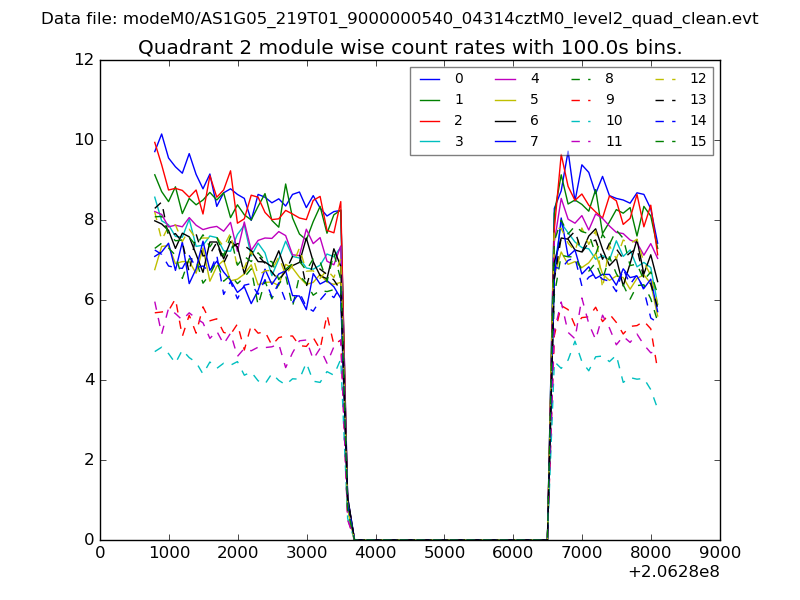
| Module-wise count rates for Quadrant B Data is divided into 100 sec bins |
 |
 |
| Module-wise count rates for Quadrant C Data is divided into 100 sec bins |
 |
 |
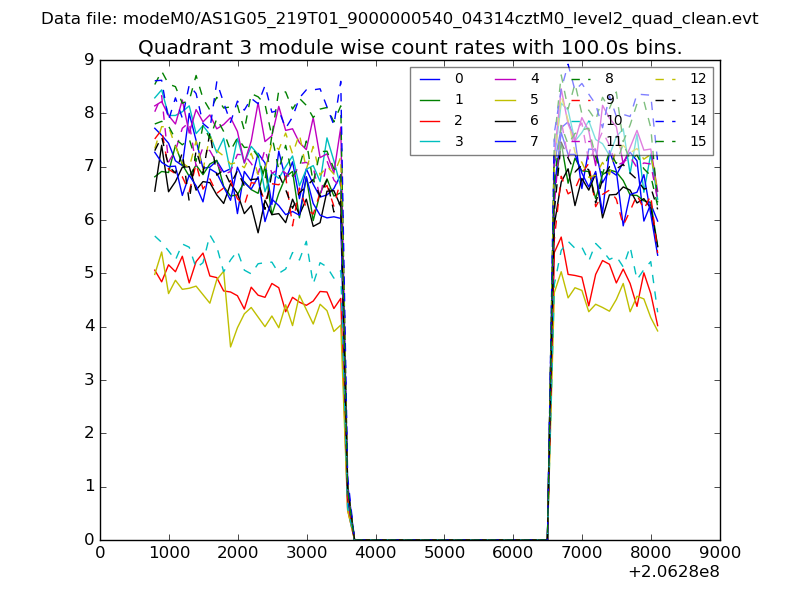
| Module-wise count rates for Quadrant D Data is divided into 100 sec bins |
 |
 |
| Parameter | Plot |
|---|---|
| CZT HV Monitor | 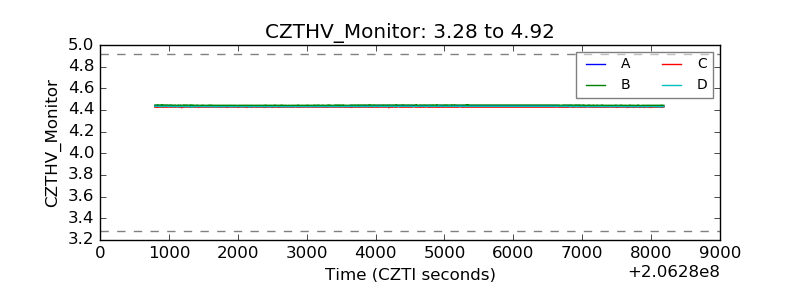 |
| D_VDD |  |
| Temperature 1 | 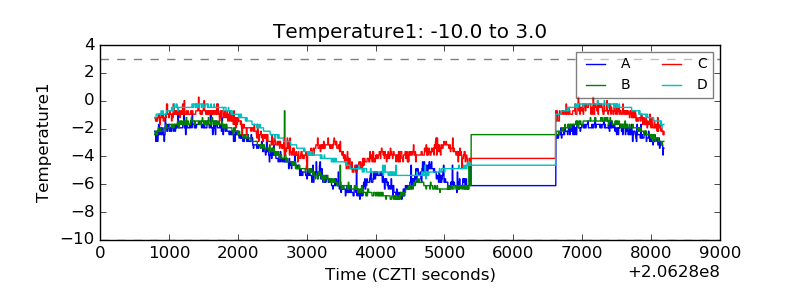 |
| Veto HV Monitor | 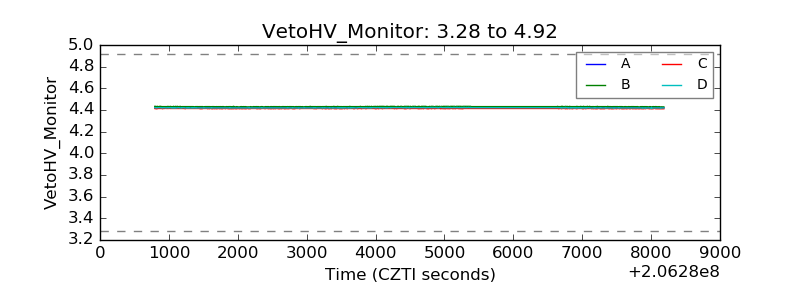 |
| Veto LLD | 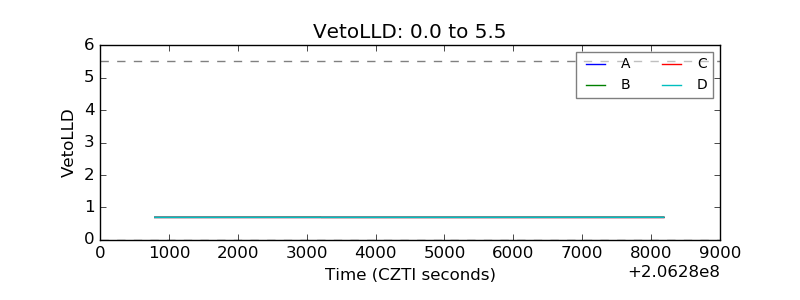 |
| Alpha Counter | 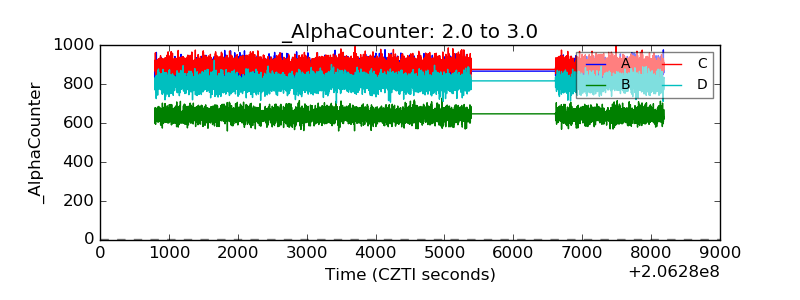 |
| _CPM_Rate | 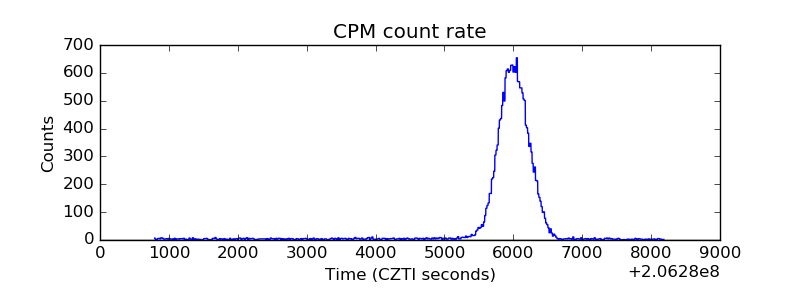 |
| CZT Counter | 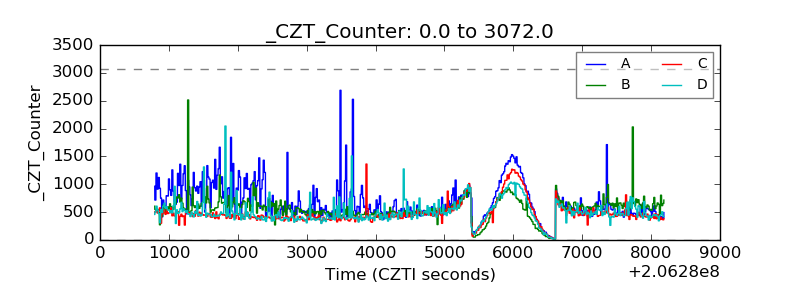 |
| +2.5 Volts monitor |  |
| +5 Volts monitor |  |
| _ROLL_ROT | 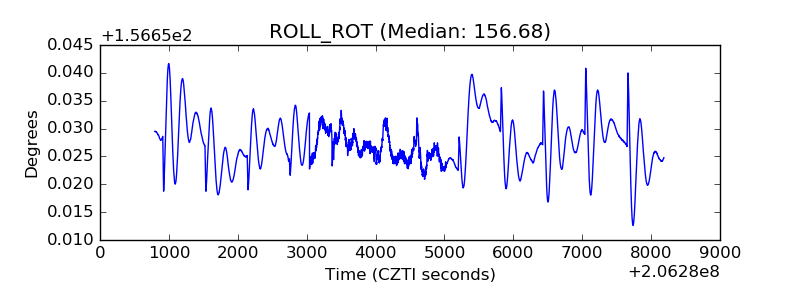 |
| _Roll_DEC | 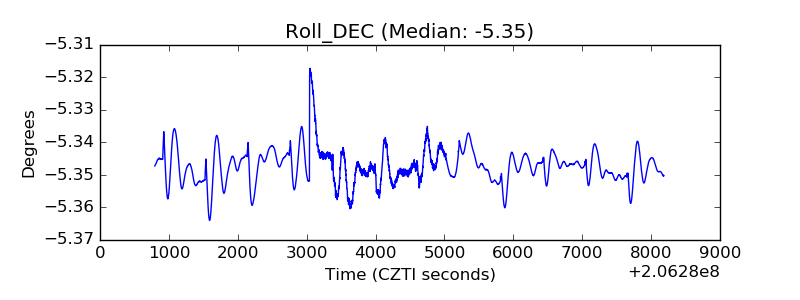 |
| _Roll_RA | 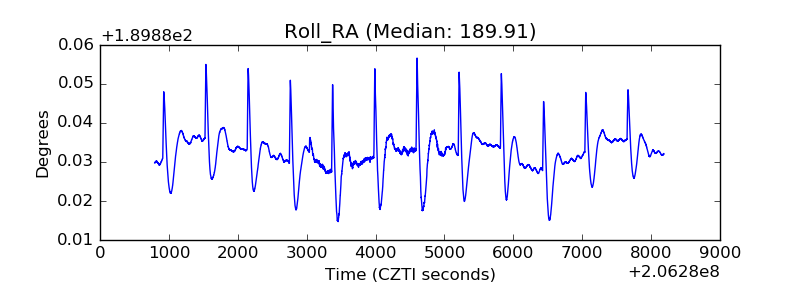 |
| Veto Counter | 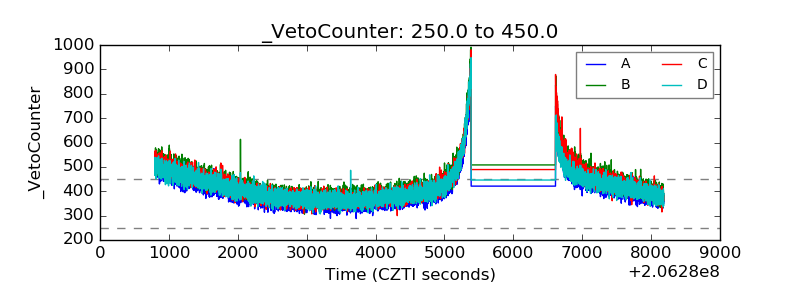 |