| Param | Original file | Final file |
|---|---|---|
| Filename | modeM0/AS1G05_219T01_9000000540_04316cztM0_level2.evt | modeM0/AS1G05_219T01_9000000540_04316cztM0_level2_quad_clean.evt |
| Size (bytes) | 458,640,000 | 78,793,920 |
| Size | 437.4 MB | 75.1 MB |
| Events in quadrant A | 3,331,023 | 487,403 |
| Events in quadrant B | 3,715,588 | 479,438 |
| Events in quadrant C | 3,069,377 | 476,981 |
| Events in quadrant D | 3,309,611 | 465,924 |
| Mode SS | |||
|---|---|---|---|
| Quadrant | BADHDUFLAG | Total packets | Discarded packets |
| A | 0 | 140 | 0 |
| B | 0 | 140 | 0 |
| C | 0 | 140 | 0 |
| D | 0 | 140 | 0 |
| Mode M9 | |||
|---|---|---|---|
| Quadrant | BADHDUFLAG | Total packets | Discarded packets |
| A | 0 | 7 | 0 |
| B | 0 | 7 | 0 |
| C | 0 | 7 | 0 |
| D | 0 | 7 | 0 |
| Mode M0 | |||
|---|---|---|---|
| Quadrant | BADHDUFLAG | Total packets | Discarded packets |
| A | 0 | 14697 | 18 |
| B | 0 | 15550 | 27 |
| C | 0 | 14119 | 17 |
| D | 0 | 14920 | 22 |
| Quadrant | Total seconds | Saturated seconds | Saturation percentage |
|---|---|---|---|
| A | 6831 | 45 | 0.658762% |
| B | 6827 | 77 | 1.127875% |
| C | 6830 | 19 | 0.278184% |
| D | 6830 | 47 | 0.688141% |
Noise dominated data is calculated using 1-second bins in cleaned event files. If a bin has >2000 counts, and if more than 50% of those come from <1% of pixels, then it is considered to be noise-dominated and hence unusable.
| Quadrant | # 1 sec bins | Bins with >0 counts | Bins with >2000 counts | High rate bins dominated by noise | Noise dominated (total time) | Noise dominated (detector-on time) | Marked lightcurve |
|---|---|---|---|---|---|---|---|
| A | 7563 | 6839 | 6 | 6 | 0.08% | 0.09% | 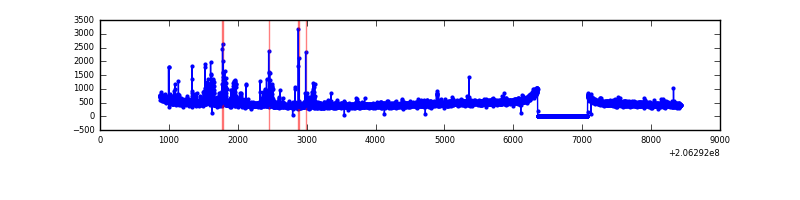 |
| B | 7563 | 6839 | 34 | 34 | 0.45% | 0.50% | 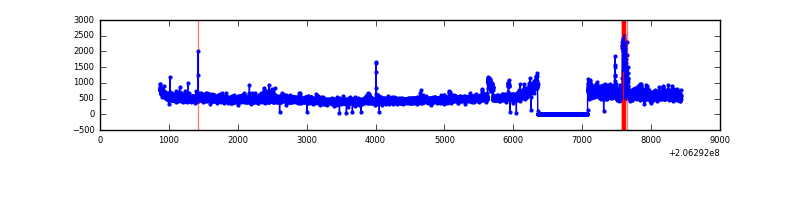 |
| C | 7563 | 6838 | 0 | 0 | 0.00% | 0.00% | 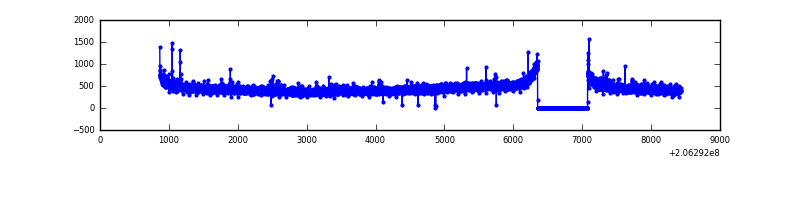 |
| D | 7564 | 6840 | 26 | 26 | 0.34% | 0.38% |  |
Top three noisy pixels from each quadrant. If the there are fewer than three noisy pixels in the level2.evt file, extra rows are filled as -1
| Pixel properties | Quadrant properties | ||||||
|---|---|---|---|---|---|---|---|
| Quadrant | DetID | PixID | Counts | Sigma | Mean | Median | Sigma |
| A | 13 | 251 | 231332 | 1398.89 | 798 | 781 | 164.8 |
| A | 13 | 248 | 12341 | 70.14 | 798 | 781 | 164.8 |
| A | 8 | 15 | 9134 | 50.68 | 798 | 781 | 164.8 |
| B | 3 | 0 | 240972 | 1545.18 | 800 | 782 | 155.4 |
| B | 15 | 204 | 218092 | 1397.99 | 800 | 782 | 155.4 |
| B | 14 | 167 | 44742 | 282.8 | 800 | 782 | 155.4 |
| C | 9 | 247 | 38687 | 209.79 | 767 | 770 | 180.7 |
| C | 10 | 65 | 18125 | 96.02 | 767 | 770 | 180.7 |
| C | 12 | 4 | 6549 | 31.97 | 767 | 770 | 180.7 |
| D | 4 | 95 | 119966 | 637.33 | 764 | 741 | 187.1 |
| D | 13 | 223 | 60092 | 317.27 | 764 | 741 | 187.1 |
| D | 12 | 22 | 48715 | 256.45 | 764 | 741 | 187.1 |
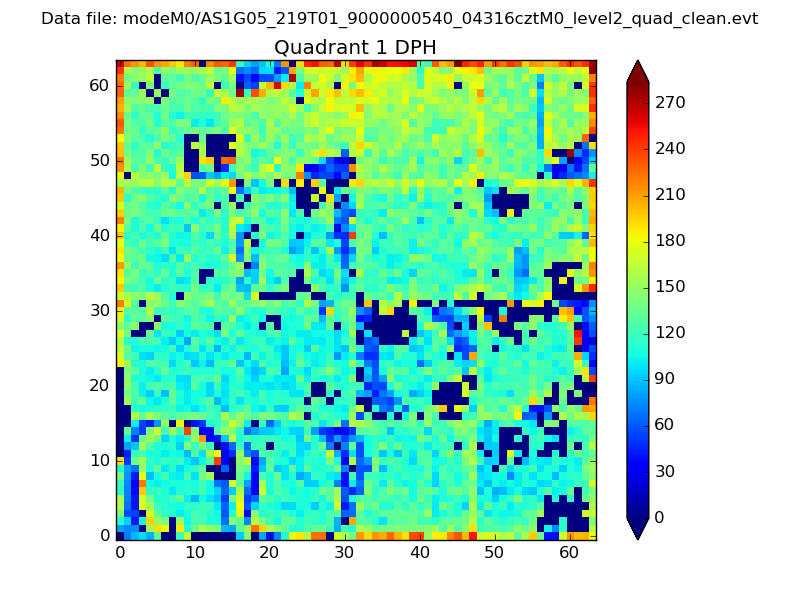
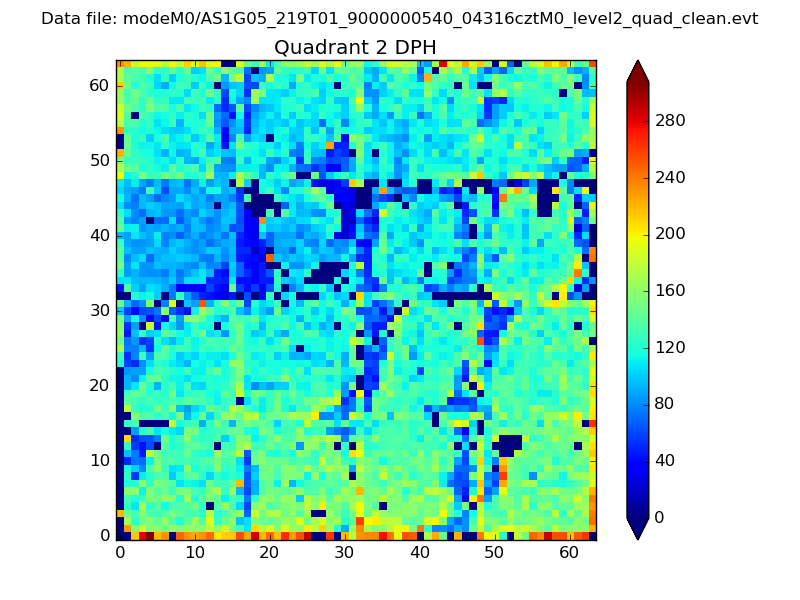
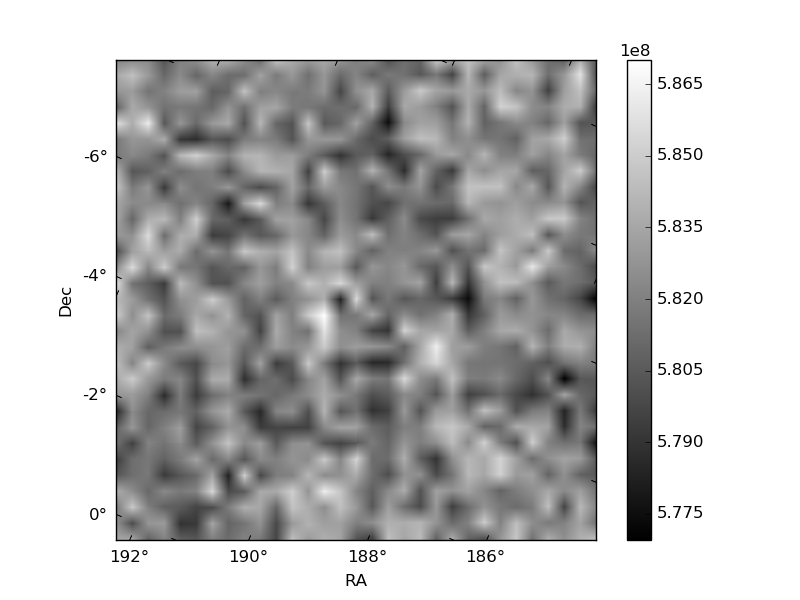
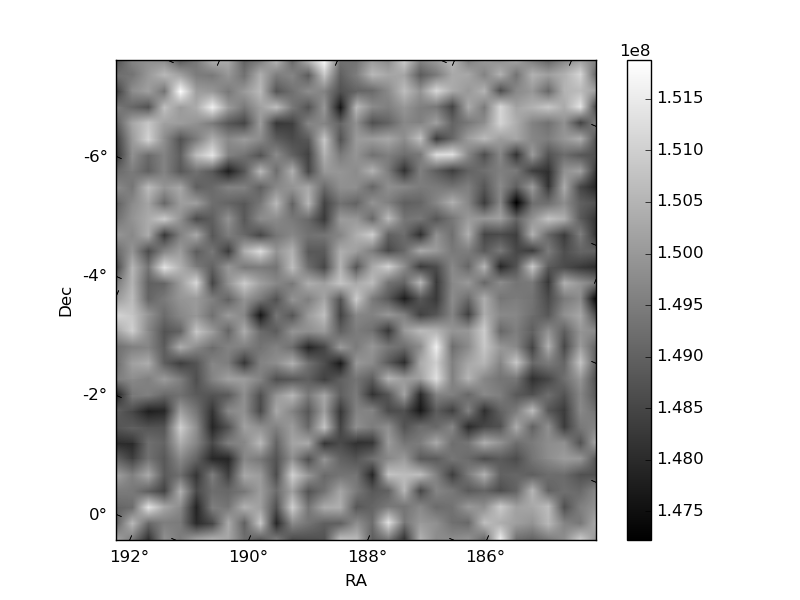
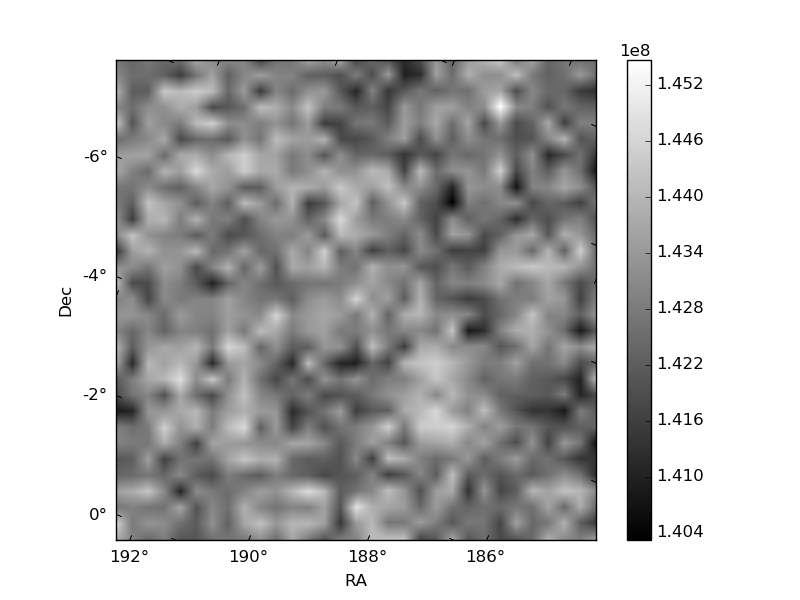
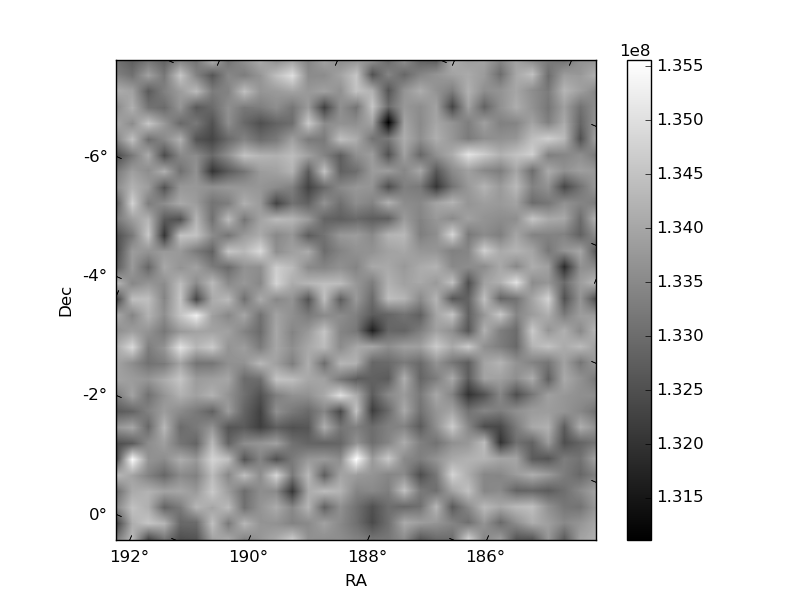
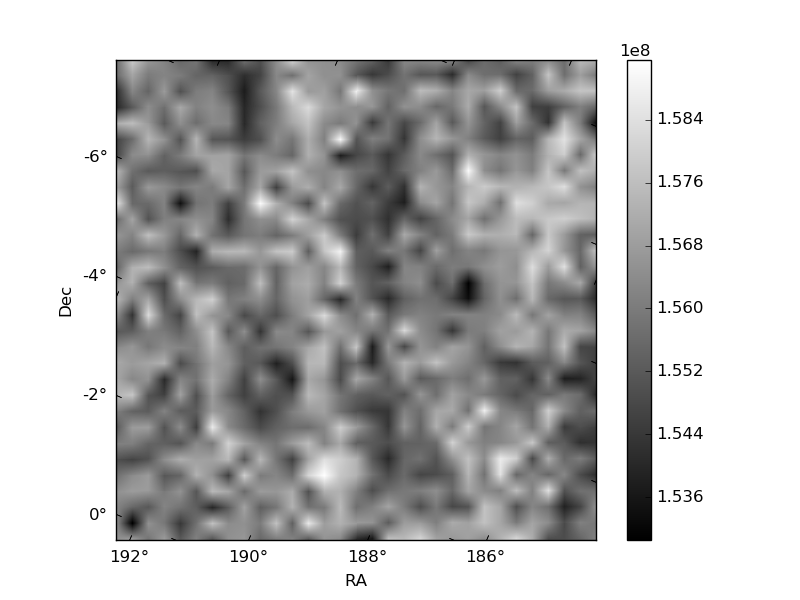
Histogram calculated using DETX and DETY for each event in the final _common_clean file
| Quadrant A | 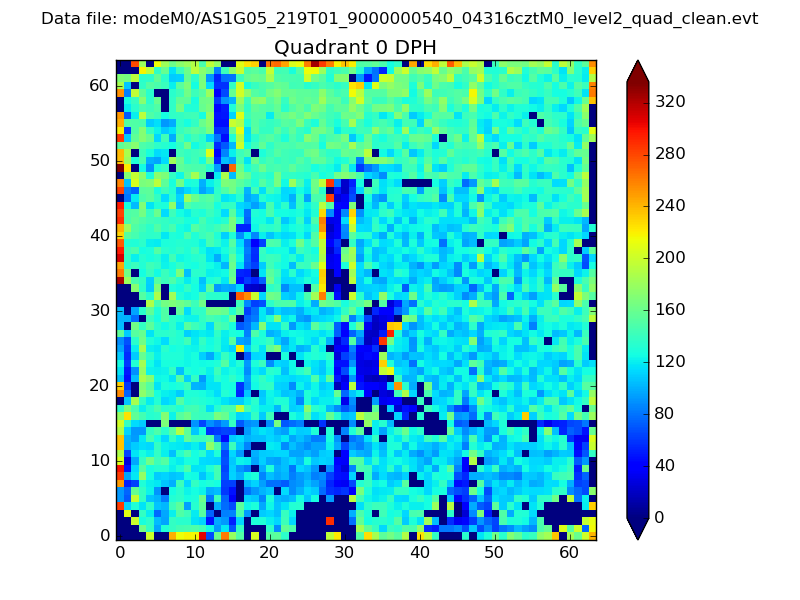 |
 |
Quadrant B |
|---|---|---|---|
| Quadrant D | 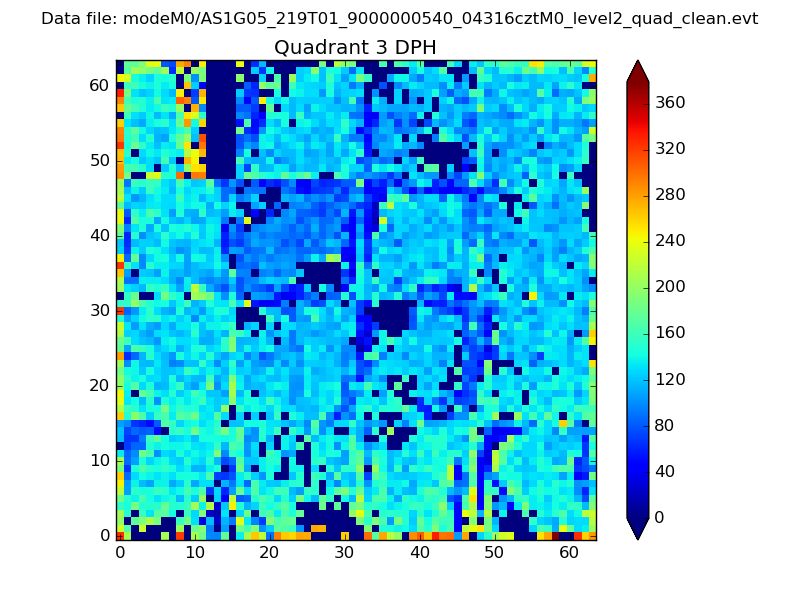 |
 |
Quadrant C |
| Plot type | Count rate plots | Images |
|---|---|---|
| Comparison with Poisson distribution Blue bars denote a histogram of data divided into 1 sec bins. Red curve is a Poisson curve with rate = median count rate of data. |
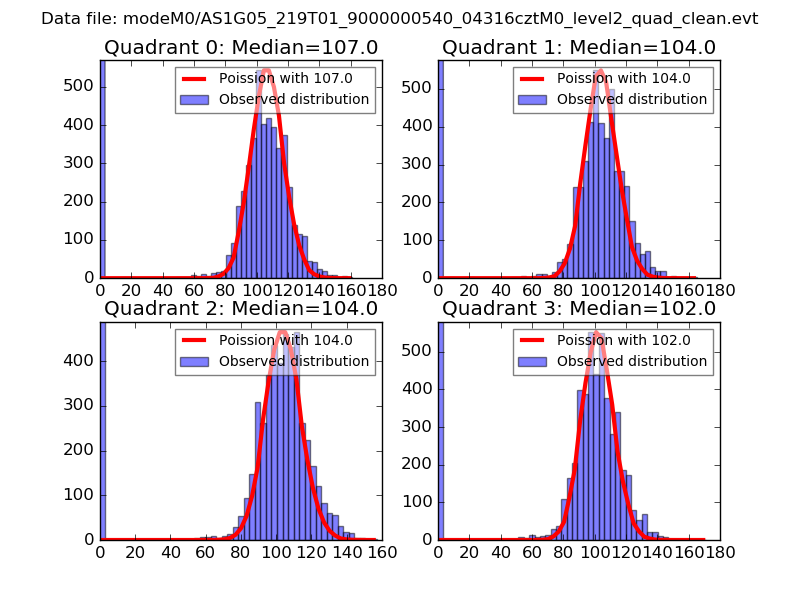 |
 |
| Quadrant-wise count rates Data is divided into 100 sec bins |
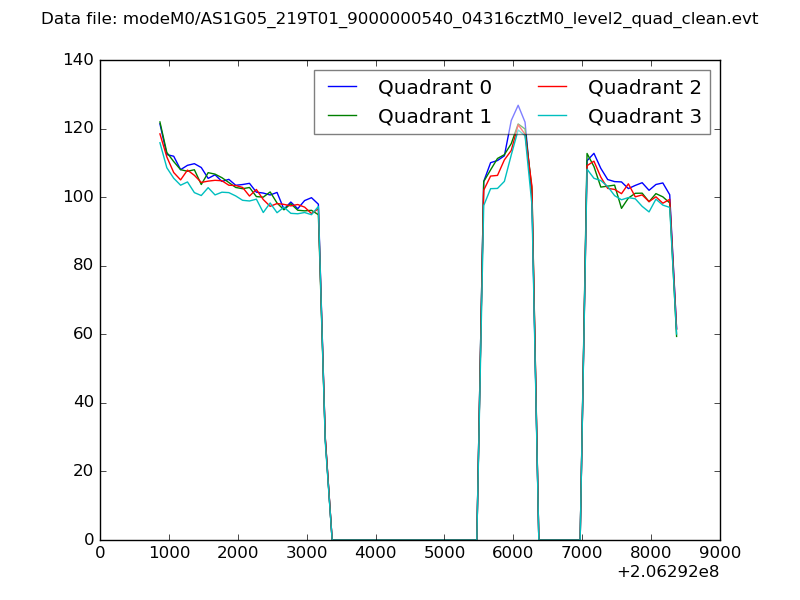 |
|
| Module-wise count rates for Quadrant A Data is divided into 100 sec bins |
 |
 |
| Module-wise count rates for Quadrant B Data is divided into 100 sec bins |
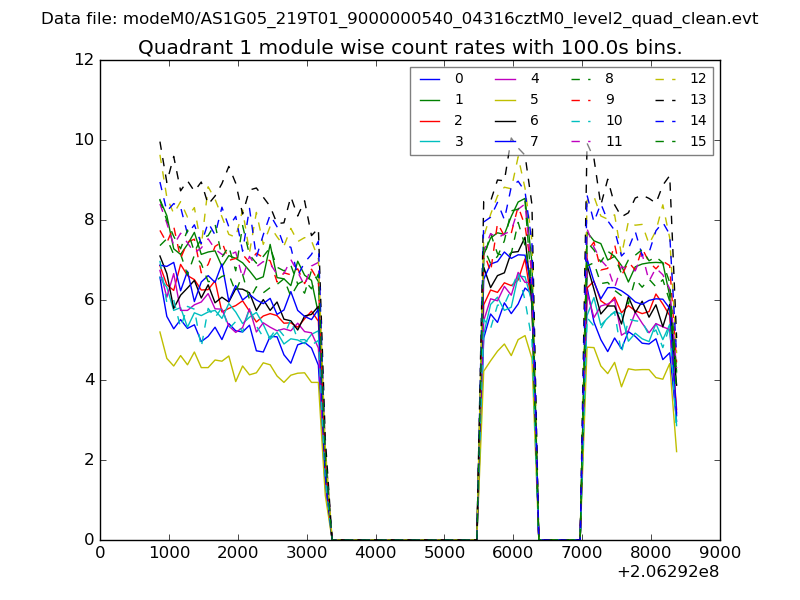 |
 |
| Module-wise count rates for Quadrant C Data is divided into 100 sec bins |
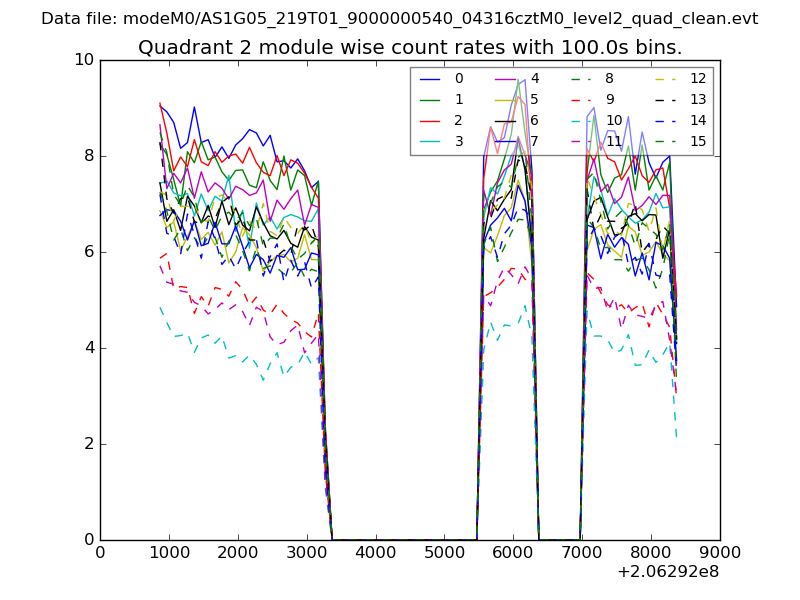 |
 |
| Module-wise count rates for Quadrant D Data is divided into 100 sec bins |
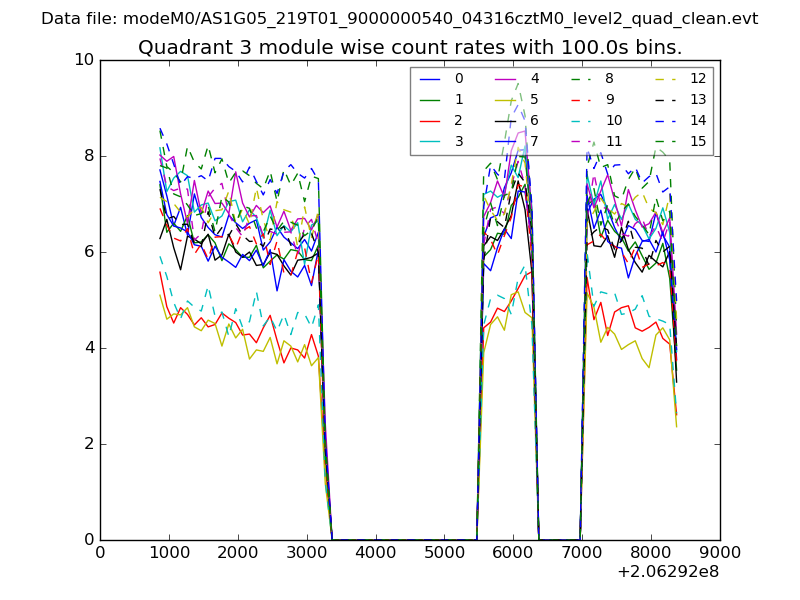 |
 |
| Parameter | Plot |
|---|---|
| CZT HV Monitor | 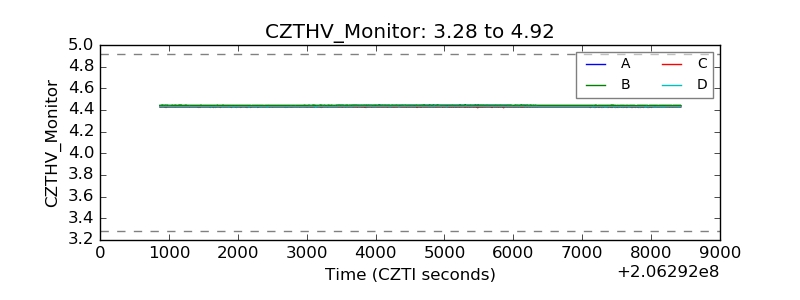 |
| D_VDD | 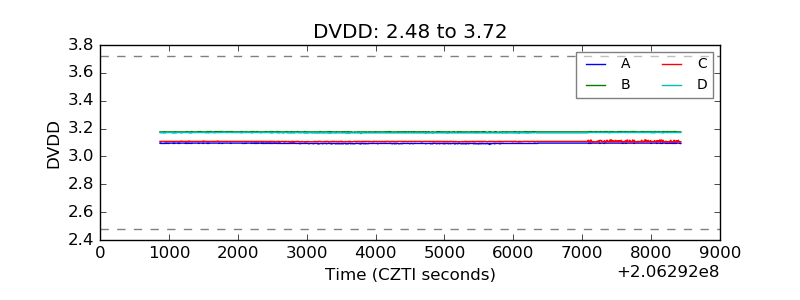 |
| Temperature 1 | 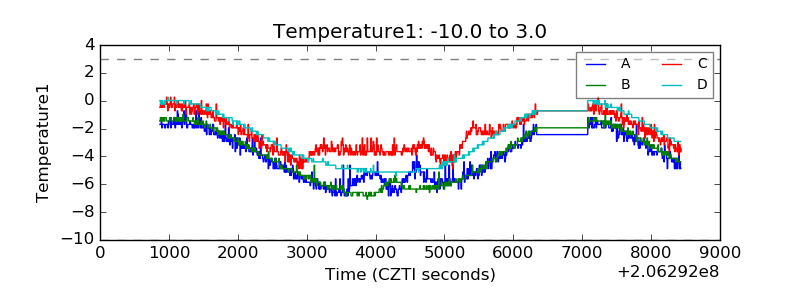 |
| Veto HV Monitor | 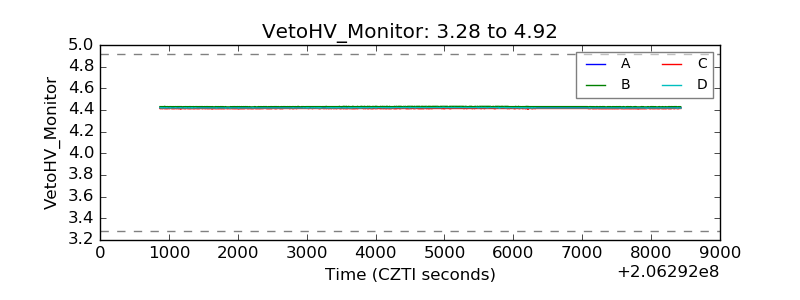 |
| Veto LLD |  |
| Alpha Counter | 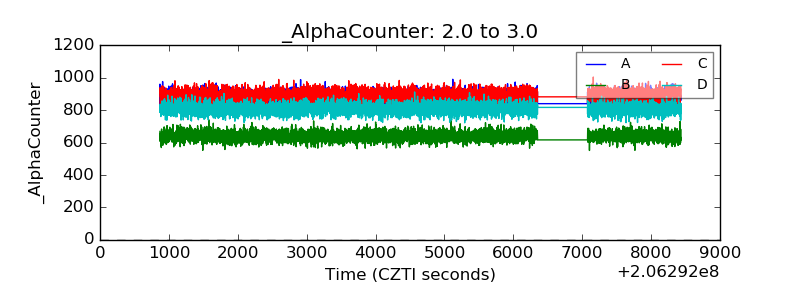 |
| _CPM_Rate | 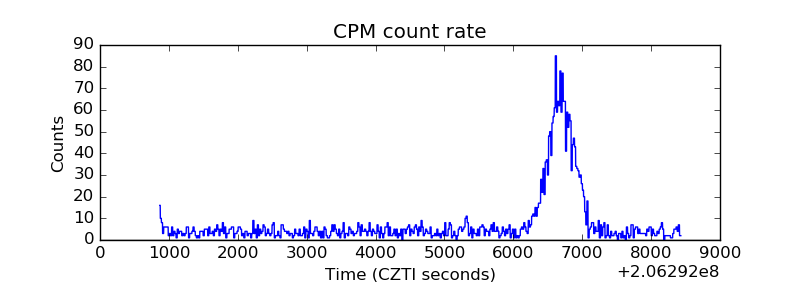 |
| CZT Counter | 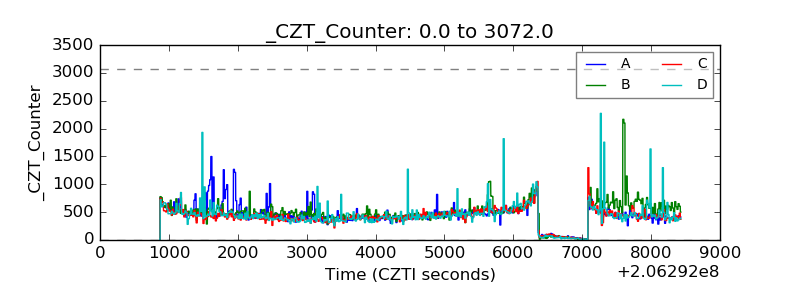 |
| +2.5 Volts monitor |  |
| +5 Volts monitor | 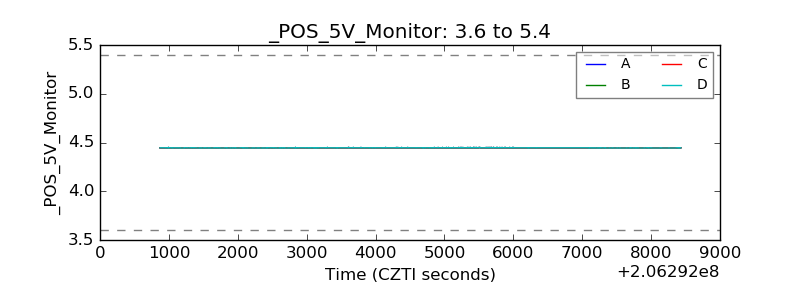 |
| _ROLL_ROT | 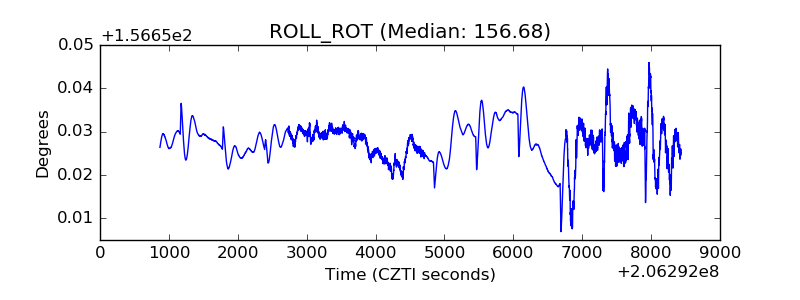 |
| _Roll_DEC | 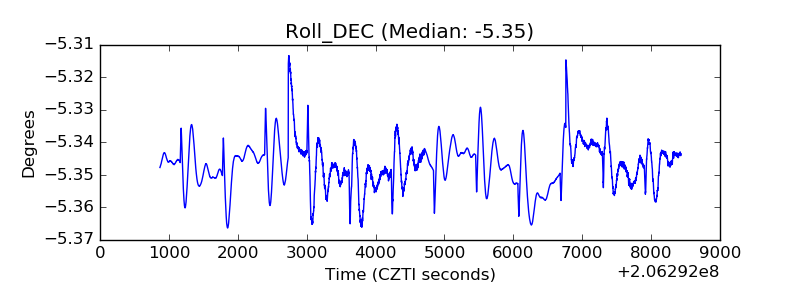 |
| _Roll_RA | 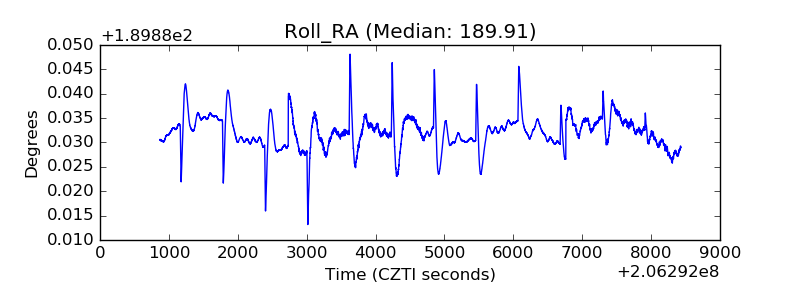 |
| Veto Counter | 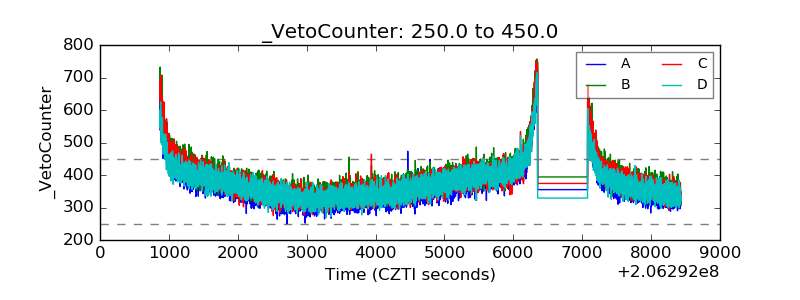 |