| Param | Original file | Final file |
|---|---|---|
| Filename | modeM0/AS1G05_219T01_9000000540_04317cztM0_level2.evt | modeM0/AS1G05_219T01_9000000540_04317cztM0_level2_quad_clean.evt |
| Size (bytes) | 490,841,280 | 84,936,960 |
| Size | 468.1 MB | 81.0 MB |
| Events in quadrant A | 3,397,312 | 527,813 |
| Events in quadrant B | 4,209,227 | 519,917 |
| Events in quadrant C | 3,208,748 | 519,272 |
| Events in quadrant D | 3,563,322 | 506,644 |
| Mode SS | |||
|---|---|---|---|
| Quadrant | BADHDUFLAG | Total packets | Discarded packets |
| A | 0 | 150 | 4 |
| B | 0 | 150 | 2 |
| C | 0 | 150 | 4 |
| D | 0 | 150 | 6 |
| Mode M9 | |||
|---|---|---|---|
| Quadrant | BADHDUFLAG | Total packets | Discarded packets |
| A | 0 | 4 | 0 |
| B | 0 | 4 | 0 |
| C | 0 | 4 | 0 |
| D | 0 | 5 | 0 |
| Mode M0 | |||
|---|---|---|---|
| Quadrant | BADHDUFLAG | Total packets | Discarded packets |
| A | 0 | 15770 | 491 |
| B | 0 | 17928 | 520 |
| C | 0 | 15248 | 477 |
| D | 0 | 16395 | 595 |
| Quadrant | Total seconds | Saturated seconds | Saturation percentage |
|---|---|---|---|
| A | 7156 | 84 | 1.173840% |
| B | 7162 | 107 | 1.493996% |
| C | 7166 | 11 | 0.153503% |
| D | 7125 | 36 | 0.505263% |
Noise dominated data is calculated using 1-second bins in cleaned event files. If a bin has >2000 counts, and if more than 50% of those come from <1% of pixels, then it is considered to be noise-dominated and hence unusable.
| Quadrant | # 1 sec bins | Bins with >0 counts | Bins with >2000 counts | High rate bins dominated by noise | Noise dominated (total time) | Noise dominated (detector-on time) | Marked lightcurve |
|---|---|---|---|---|---|---|---|
| A | 7715 | 7359 | 48 | 48 | 0.62% | 0.65% | 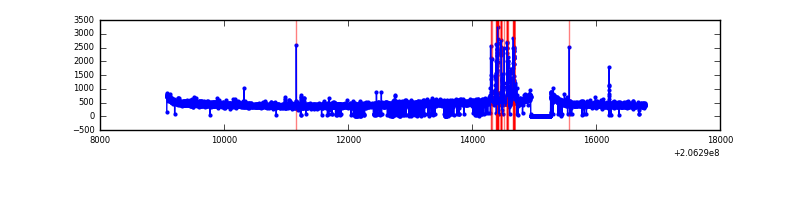 |
| B | 7715 | 7358 | 37 | 37 | 0.48% | 0.50% | 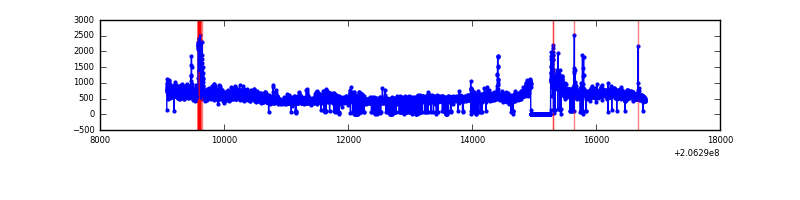 |
| C | 7715 | 7362 | 2 | 2 | 0.03% | 0.03% | 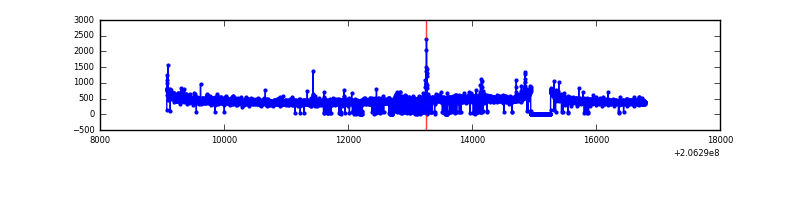 |
| D | 7715 | 7351 | 38 | 38 | 0.49% | 0.52% | 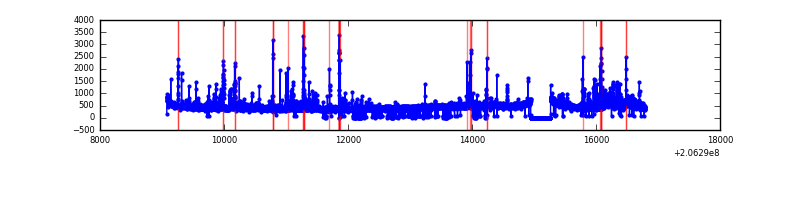 |
Top three noisy pixels from each quadrant. If the there are fewer than three noisy pixels in the level2.evt file, extra rows are filled as -1
| Pixel properties | Quadrant properties | ||||||
|---|---|---|---|---|---|---|---|
| Quadrant | DetID | PixID | Counts | Sigma | Mean | Median | Sigma |
| A | 15 | 234 | 196876 | 1164.07 | 818 | 799 | 168.4 |
| A | 13 | 251 | 39462 | 229.53 | 818 | 799 | 168.4 |
| A | 12 | 194 | 8525 | 45.87 | 818 | 799 | 168.4 |
| B | 3 | 0 | 547192 | 3406.4 | 825 | 806 | 160.4 |
| B | 15 | 204 | 283761 | 1764.06 | 825 | 806 | 160.4 |
| B | 4 | 48 | 46101 | 282.39 | 825 | 806 | 160.4 |
| C | 9 | 247 | 69948 | 371.04 | 794 | 799 | 186.4 |
| C | 8 | 128 | 13509 | 68.2 | 794 | 799 | 186.4 |
| C | 10 | 65 | 7351 | 35.16 | 794 | 799 | 186.4 |
| D | 2 | 63 | 210457 | 1090.79 | 788 | 765 | 192.2 |
| D | 4 | 95 | 147921 | 765.48 | 788 | 765 | 192.2 |
| D | 2 | 136 | 37507 | 191.13 | 788 | 765 | 192.2 |
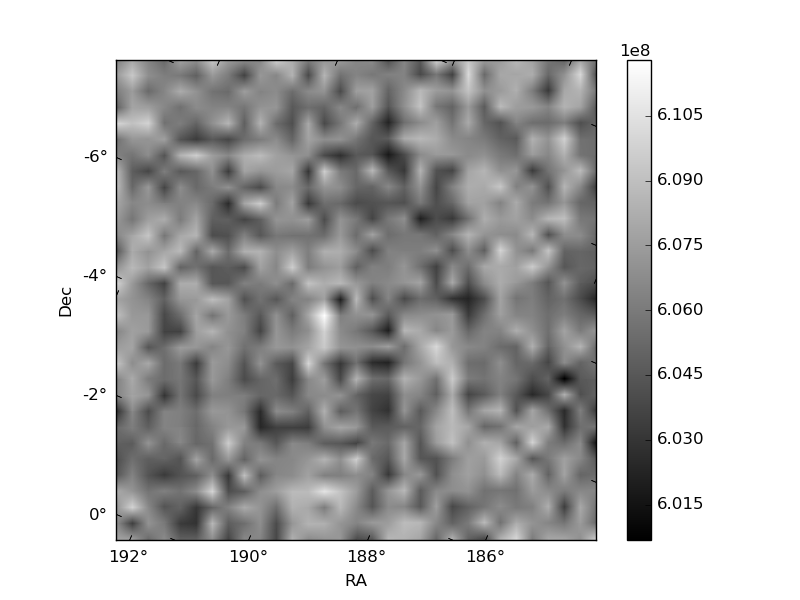
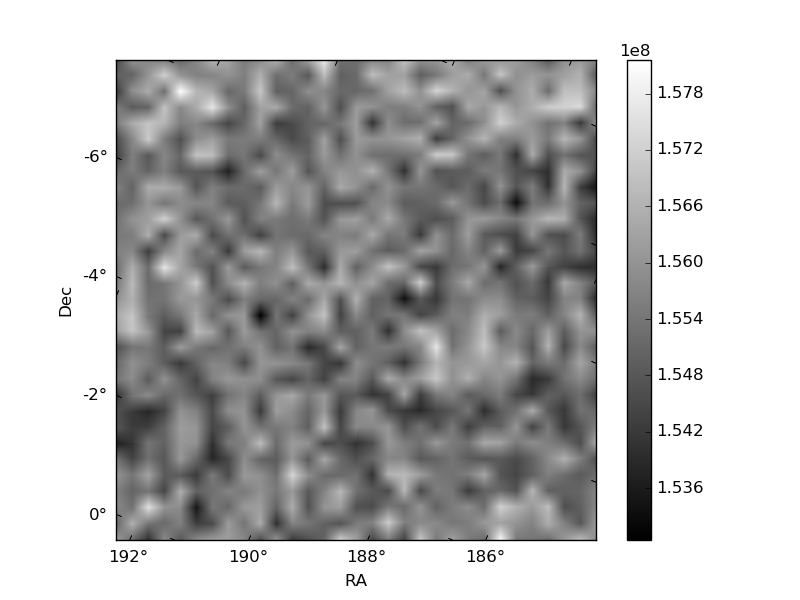
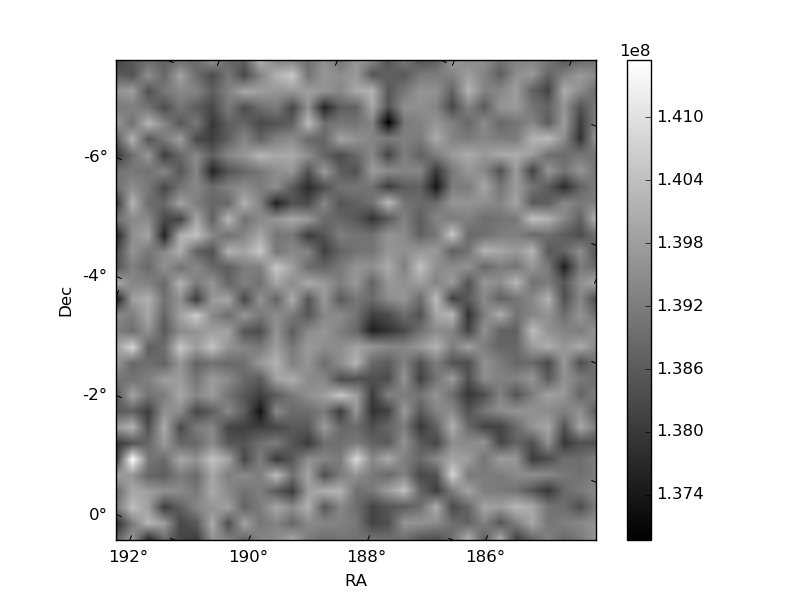
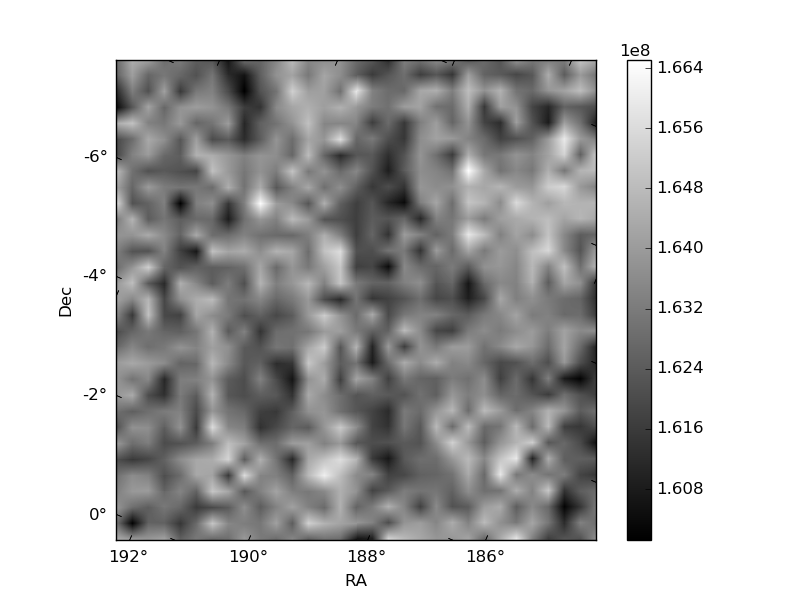
Histogram calculated using DETX and DETY for each event in the final _common_clean file
| Quadrant A | 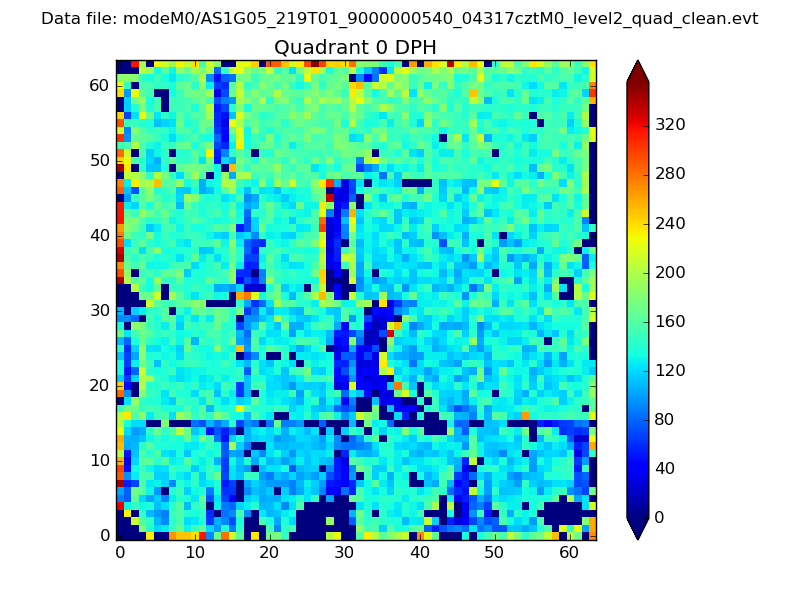 |
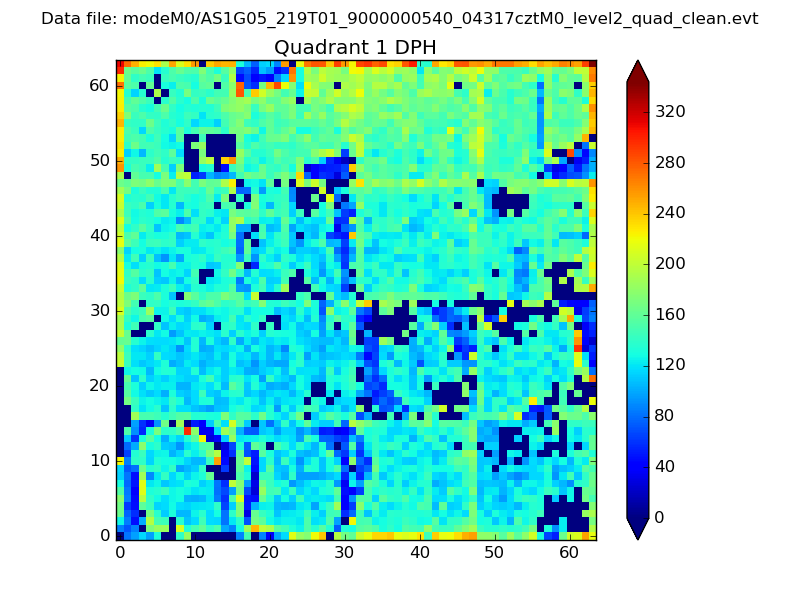 |
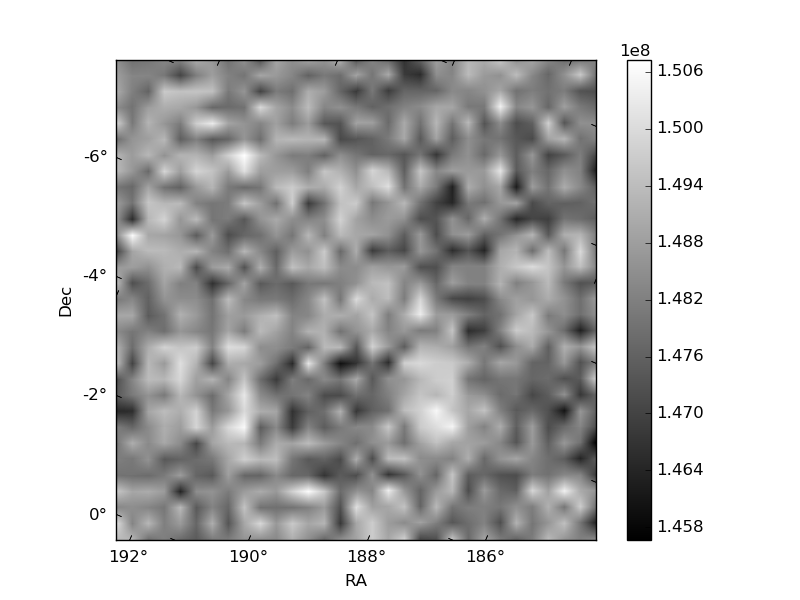
Quadrant B |
|---|---|---|---|
| Quadrant D | 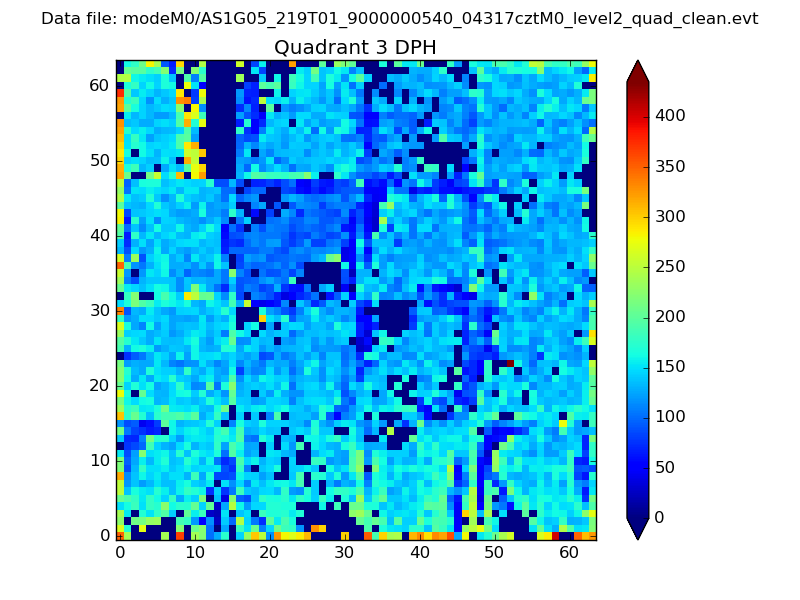 |
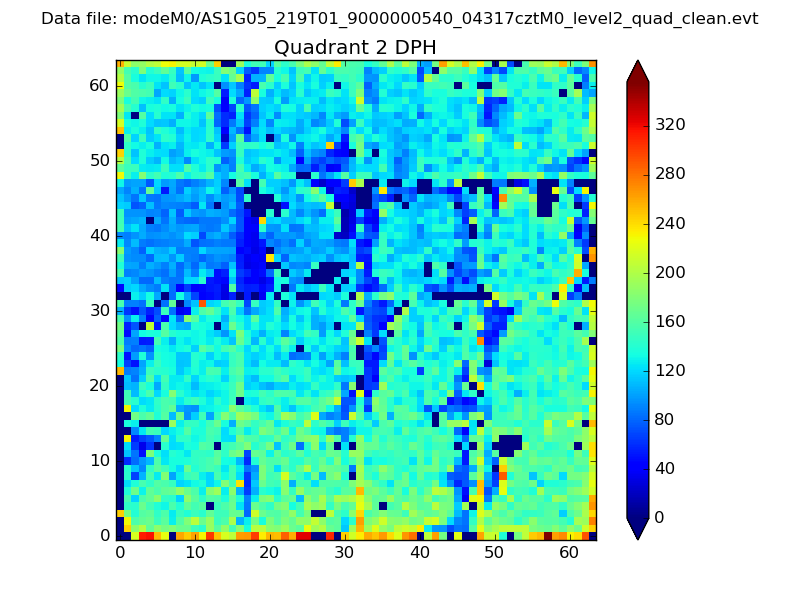 |
Quadrant C |
| Plot type | Count rate plots | Images |
|---|---|---|
| Comparison with Poisson distribution Blue bars denote a histogram of data divided into 1 sec bins. Red curve is a Poisson curve with rate = median count rate of data. |
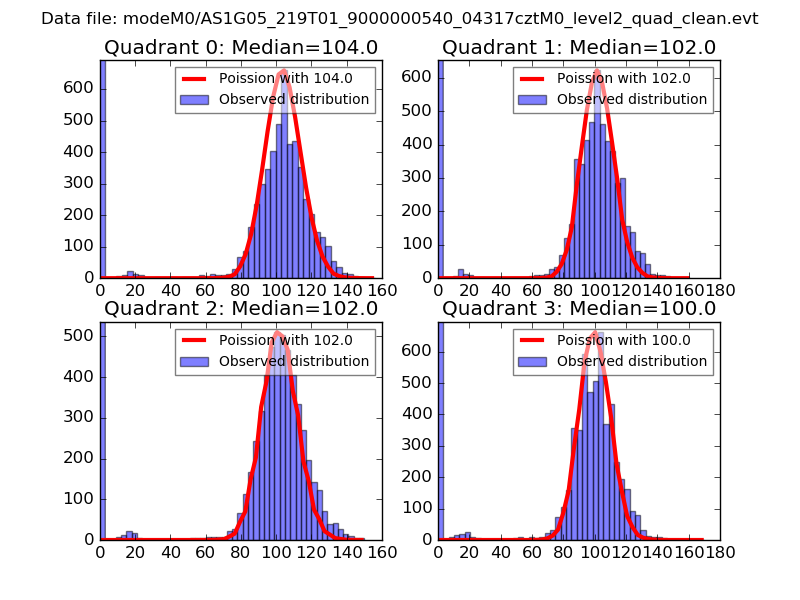 |
 |
| Quadrant-wise count rates Data is divided into 100 sec bins |
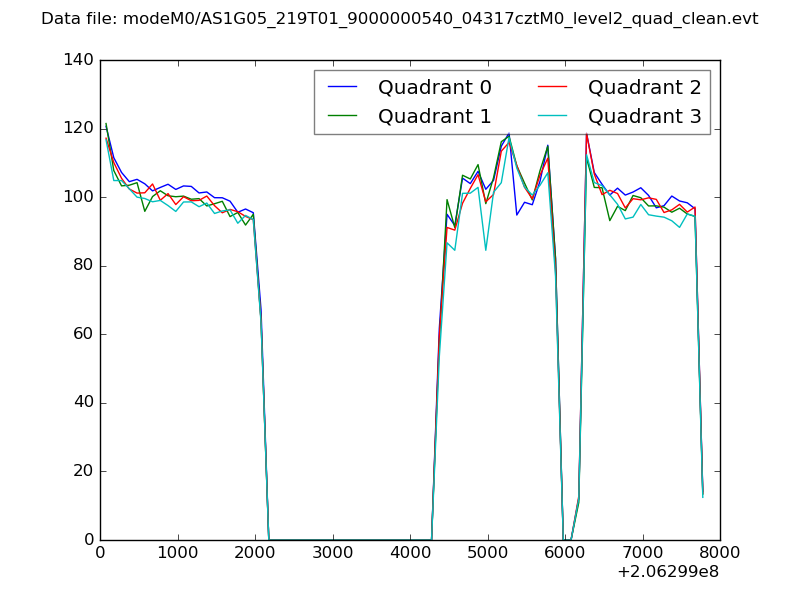 |
|
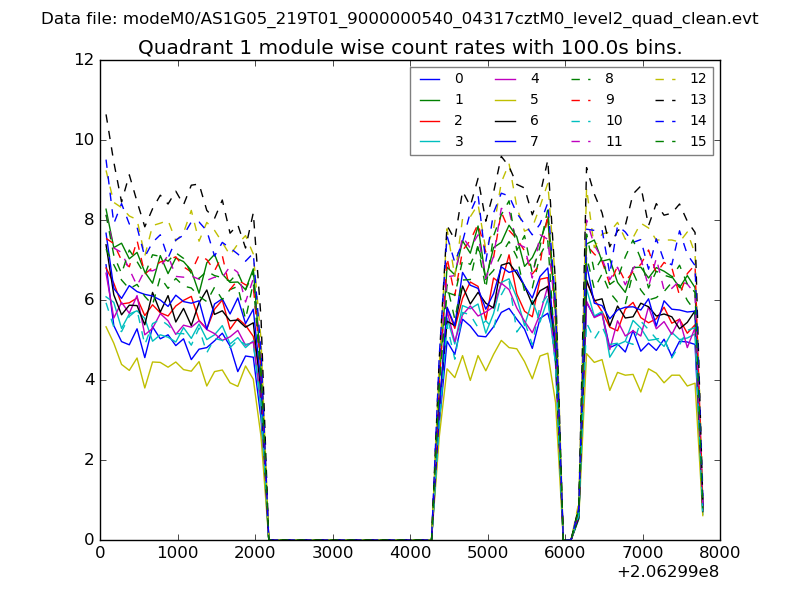
| Module-wise count rates for Quadrant A Data is divided into 100 sec bins |
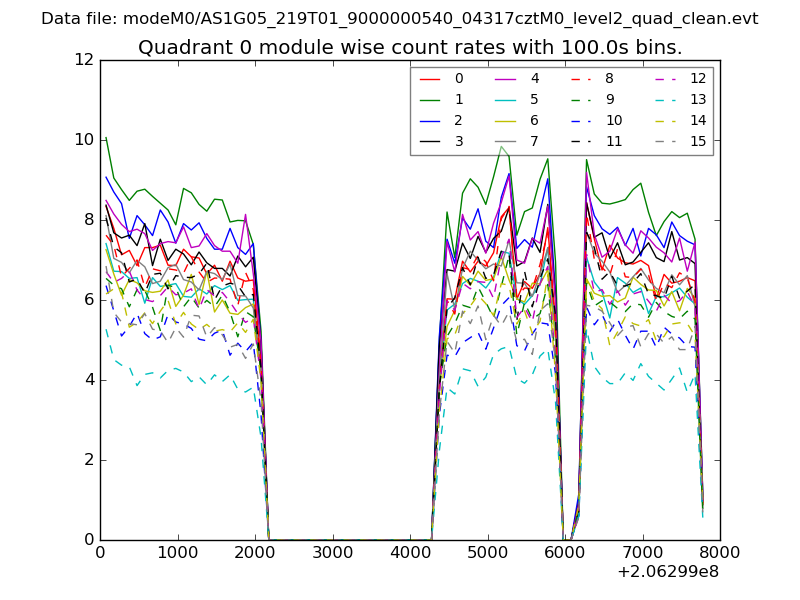 |
 |
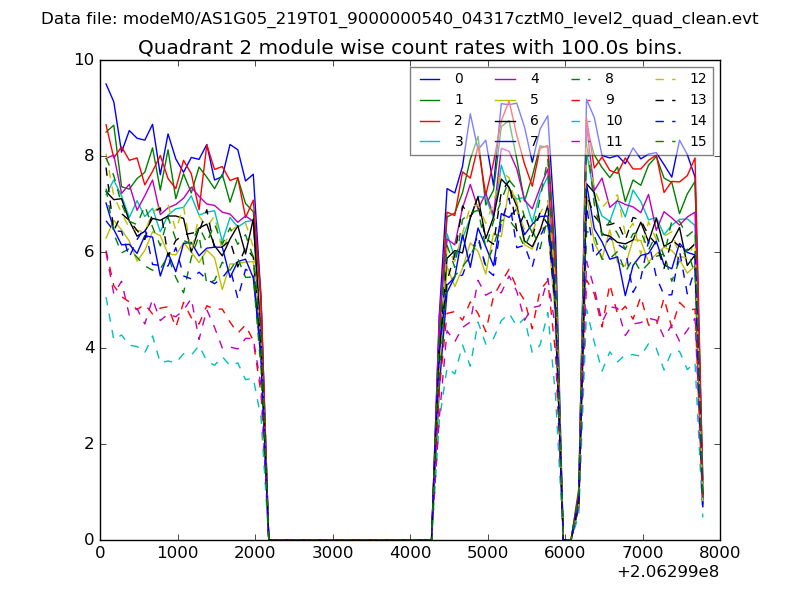
| Module-wise count rates for Quadrant B Data is divided into 100 sec bins |
 |
 |
| Module-wise count rates for Quadrant C Data is divided into 100 sec bins |
 |
 |
| Module-wise count rates for Quadrant D Data is divided into 100 sec bins |
 |
 |
| Parameter | Plot |
|---|---|
| CZT HV Monitor | 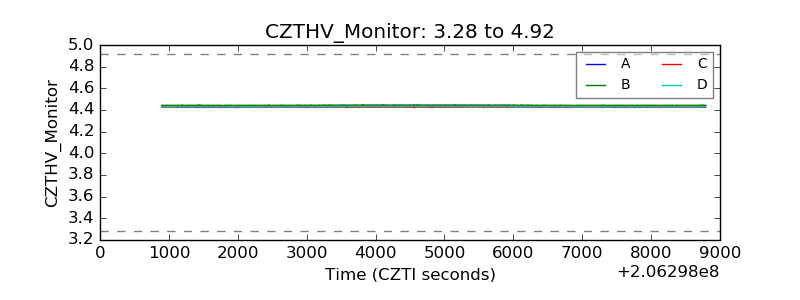 |
| D_VDD | 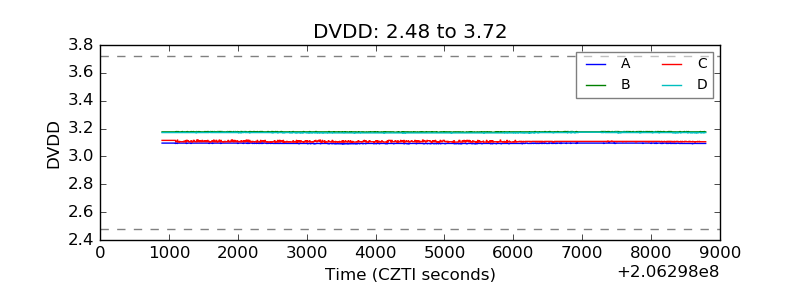 |
| Temperature 1 | 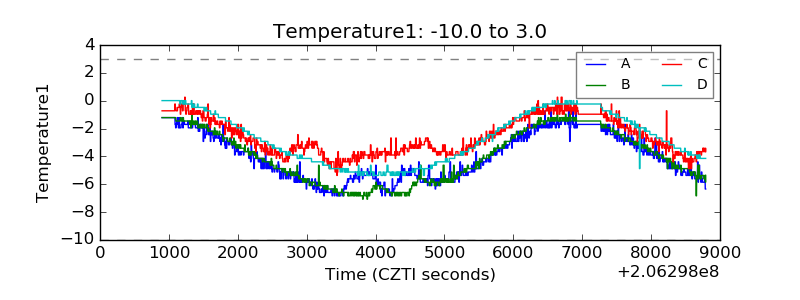 |
| Veto HV Monitor | 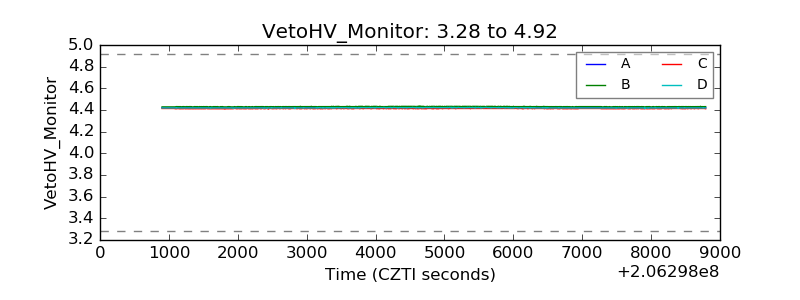 |
| Veto LLD | 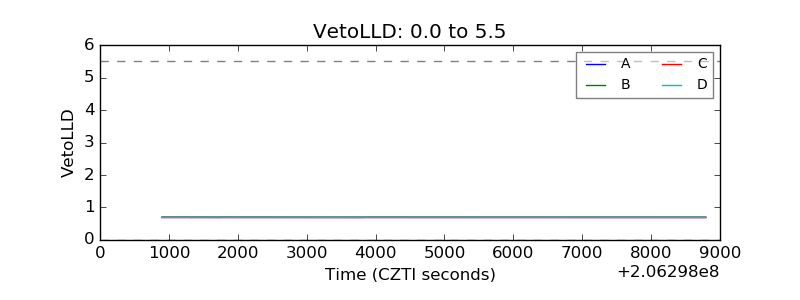 |
| Alpha Counter | 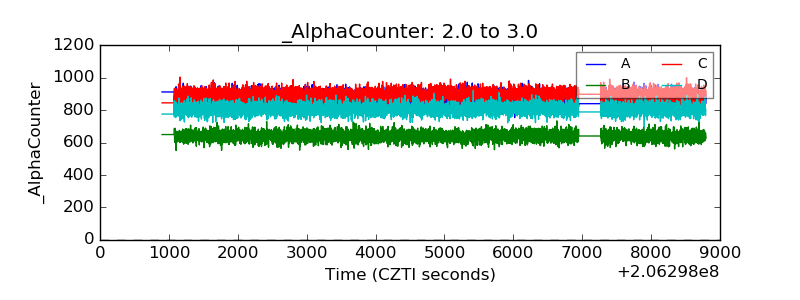 |
| _CPM_Rate | 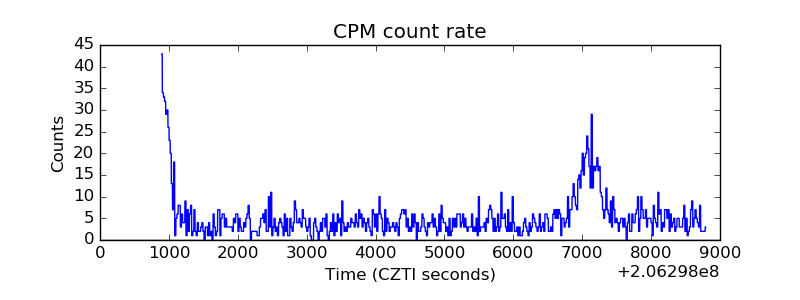 |
| CZT Counter | 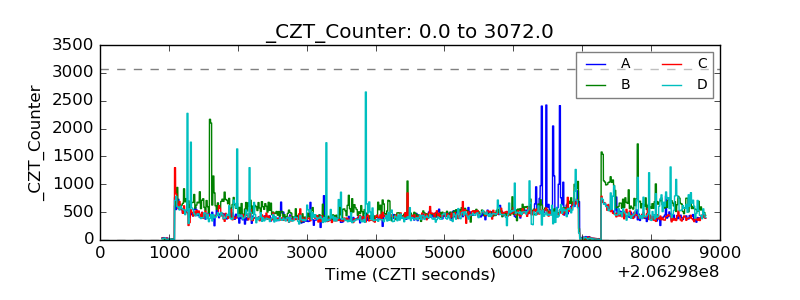 |
| +2.5 Volts monitor |  |
| +5 Volts monitor | 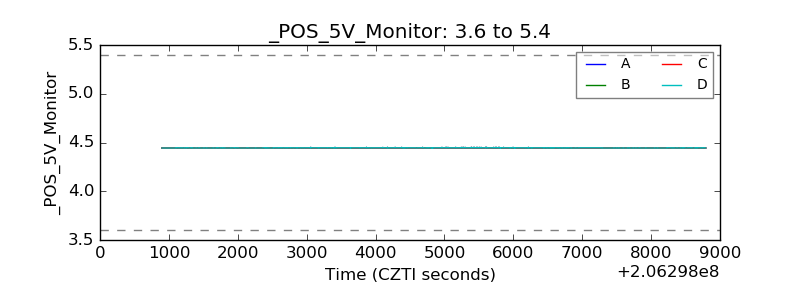 |
| _ROLL_ROT | 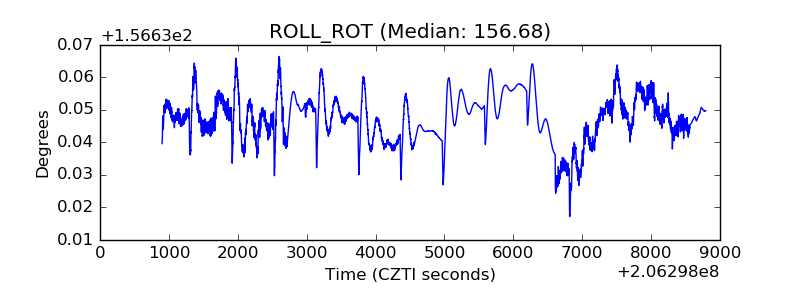 |
| _Roll_DEC | 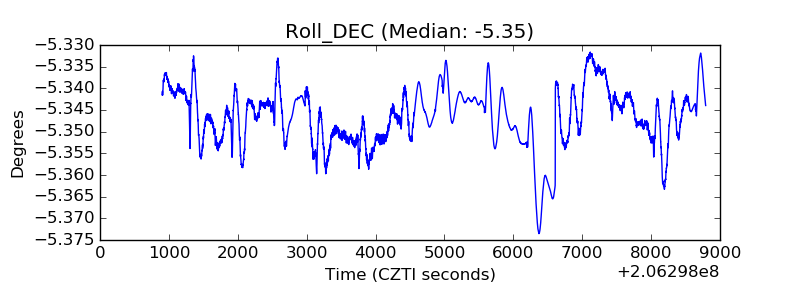 |
| _Roll_RA | 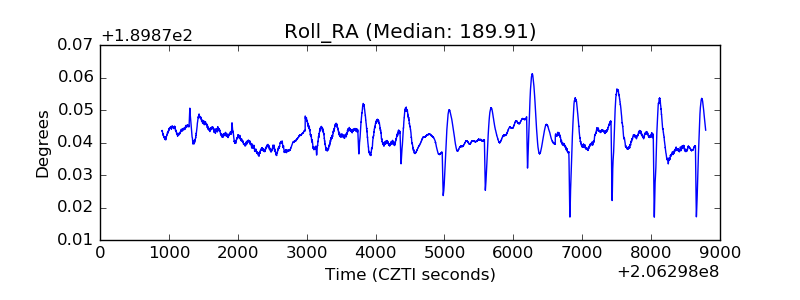 |
| Veto Counter | 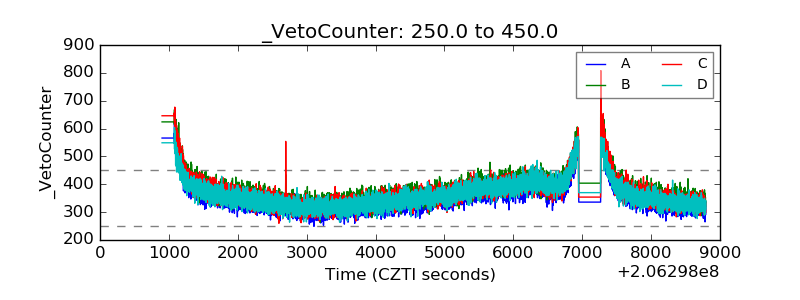 |