| Param | Original file | Final file |
|---|---|---|
| Filename | modeM0/AS1G05_219T01_9000000540_04318cztM0_level2.evt | modeM0/AS1G05_219T01_9000000540_04318cztM0_level2_quad_clean.evt |
| Size (bytes) | 590,336,640 | 89,536,320 |
| Size | 563.0 MB | 85.4 MB |
| Events in quadrant A | 3,672,991 | 555,236 |
| Events in quadrant B | 5,283,928 | 537,827 |
| Events in quadrant C | 3,517,791 | 543,120 |
| Events in quadrant D | 4,867,606 | 525,210 |
| Mode SS | |||
|---|---|---|---|
| Quadrant | BADHDUFLAG | Total packets | Discarded packets |
| A | 0 | 164 | 2 |
| B | 0 | 164 | 0 |
| C | 0 | 164 | 0 |
| D | 0 | 164 | 0 |
| Mode M9 | |||
|---|---|---|---|
| Quadrant | BADHDUFLAG | Total packets | Discarded packets |
| A | 0 | 5 | 0 |
| B | 0 | 5 | 0 |
| C | 0 | 5 | 0 |
| D | 0 | 5 | 0 |
| Mode M0 | |||
|---|---|---|---|
| Quadrant | BADHDUFLAG | Total packets | Discarded packets |
| A | 0 | 16696 | 122 |
| B | 0 | 21563 | 220 |
| C | 0 | 16466 | 119 |
| D | 0 | 20252 | 189 |
| Quadrant | Total seconds | Saturated seconds | Saturation percentage |
|---|---|---|---|
| A | 7918 | 57 | 0.719879% |
| B | 7890 | 179 | 2.268695% |
| C | 7911 | 22 | 0.278094% |
| D | 7892 | 180 | 2.280791% |
Noise dominated data is calculated using 1-second bins in cleaned event files. If a bin has >2000 counts, and if more than 50% of those come from <1% of pixels, then it is considered to be noise-dominated and hence unusable.
| Quadrant | # 1 sec bins | Bins with >0 counts | Bins with >2000 counts | High rate bins dominated by noise | Noise dominated (total time) | Noise dominated (detector-on time) | Marked lightcurve |
|---|---|---|---|---|---|---|---|
| A | 8491 | 7960 | 19 | 19 | 0.22% | 0.24% | 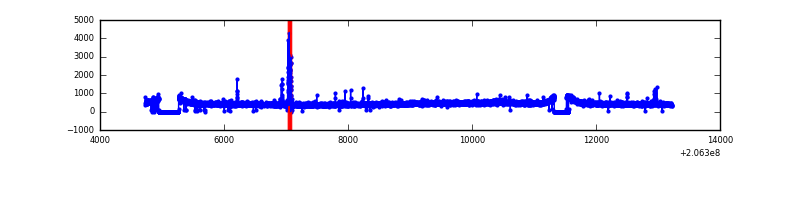 |
| B | 8491 | 7956 | 6 | 6 | 0.07% | 0.08% | 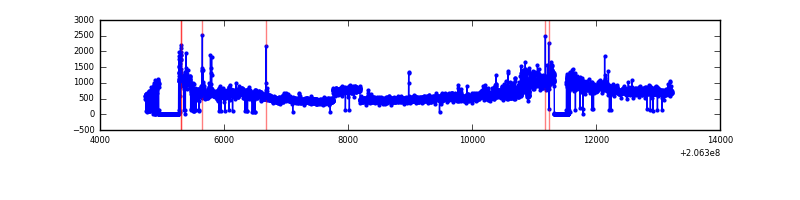 |
| C | 8491 | 7961 | 1 | 1 | 0.01% | 0.01% | 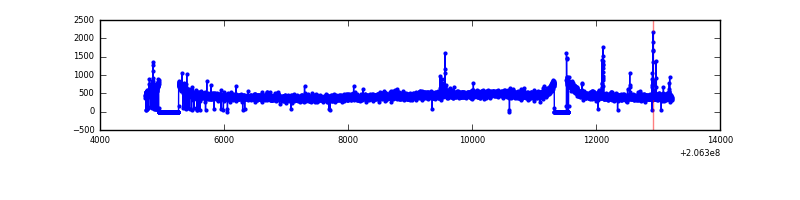 |
| D | 8491 | 7955 | 98 | 98 | 1.15% | 1.23% | 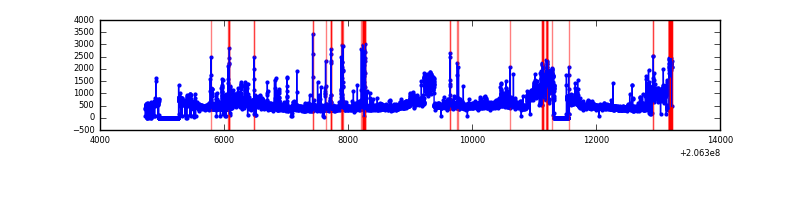 |
Top three noisy pixels from each quadrant. If the there are fewer than three noisy pixels in the level2.evt file, extra rows are filled as -1
| Pixel properties | Quadrant properties | ||||||
|---|---|---|---|---|---|---|---|
| Quadrant | DetID | PixID | Counts | Sigma | Mean | Median | Sigma |
| A | 0 | 50 | 79103 | 413.29 | 912 | 891 | 189.2 |
| A | 13 | 251 | 35210 | 181.35 | 912 | 891 | 189.2 |
| A | 13 | 14 | 24512 | 124.82 | 912 | 891 | 189.2 |
| B | 3 | 0 | 1457502 | 8210.54 | 913 | 891 | 177.4 |
| B | 8 | 3 | 95611 | 533.91 | 913 | 891 | 177.4 |
| B | 14 | 167 | 58076 | 322.34 | 913 | 891 | 177.4 |
| C | 9 | 247 | 52129 | 247.36 | 881 | 884 | 207.2 |
| C | 14 | 48 | 17804 | 81.67 | 881 | 884 | 207.2 |
| C | 13 | 61 | 7385 | 31.38 | 881 | 884 | 207.2 |
| D | 2 | 63 | 1141307 | 5327.47 | 871 | 843 | 214.1 |
| D | 13 | 223 | 80997 | 374.42 | 871 | 843 | 214.1 |
| D | 2 | 37 | 77381 | 357.53 | 871 | 843 | 214.1 |
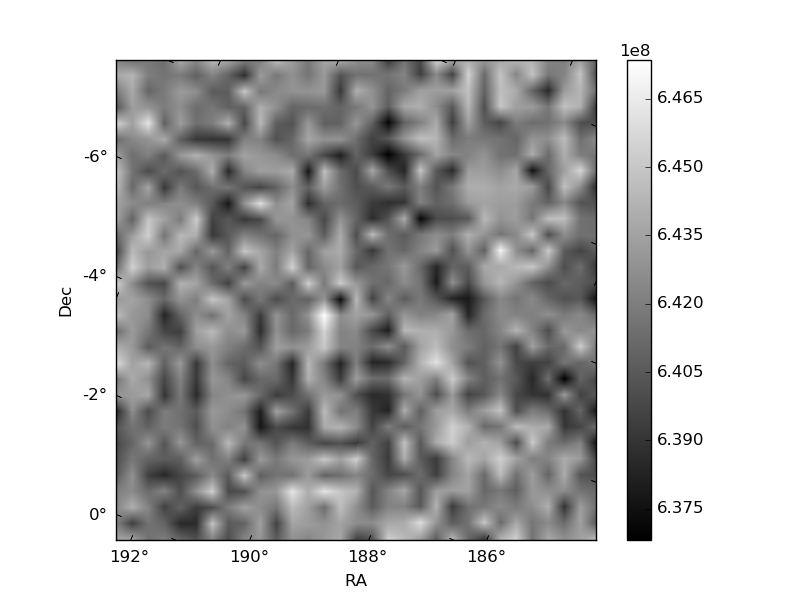
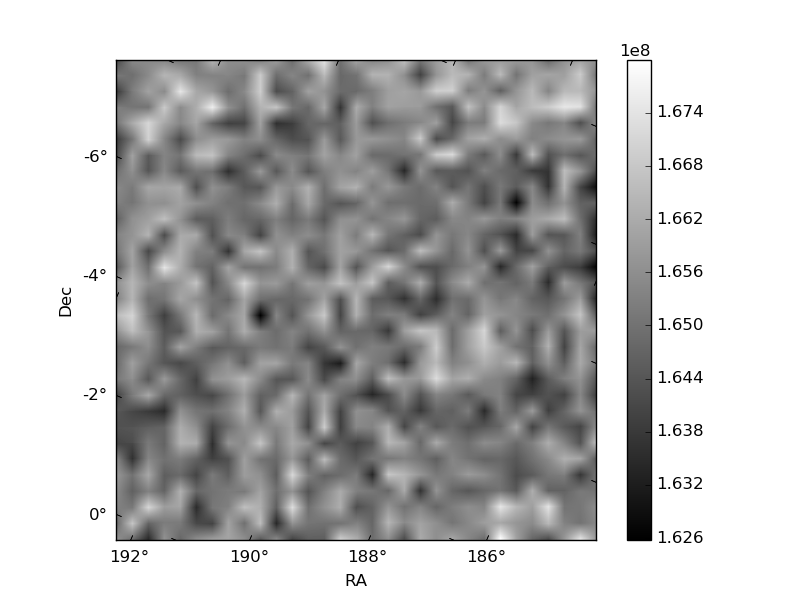
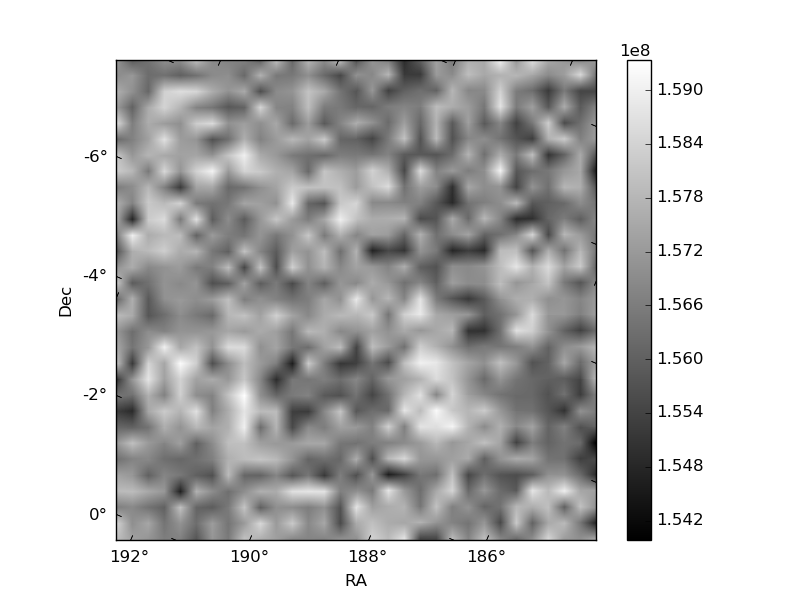
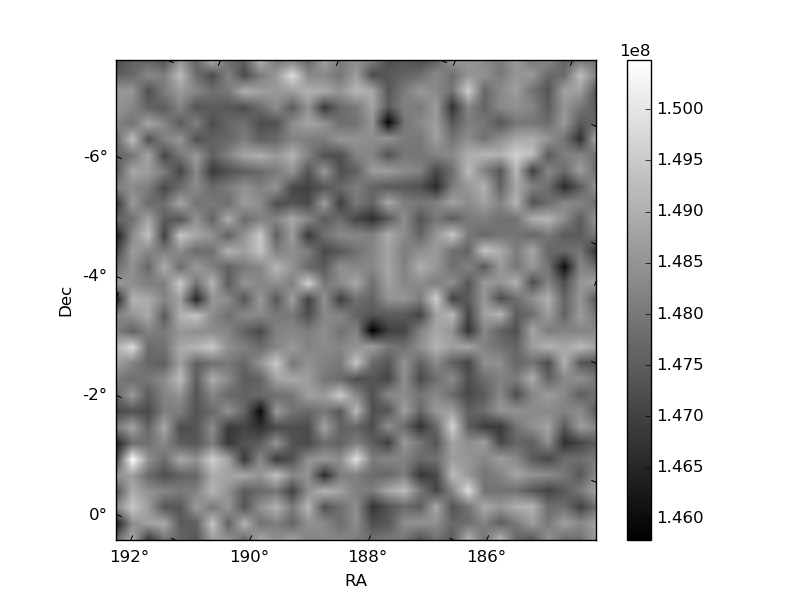
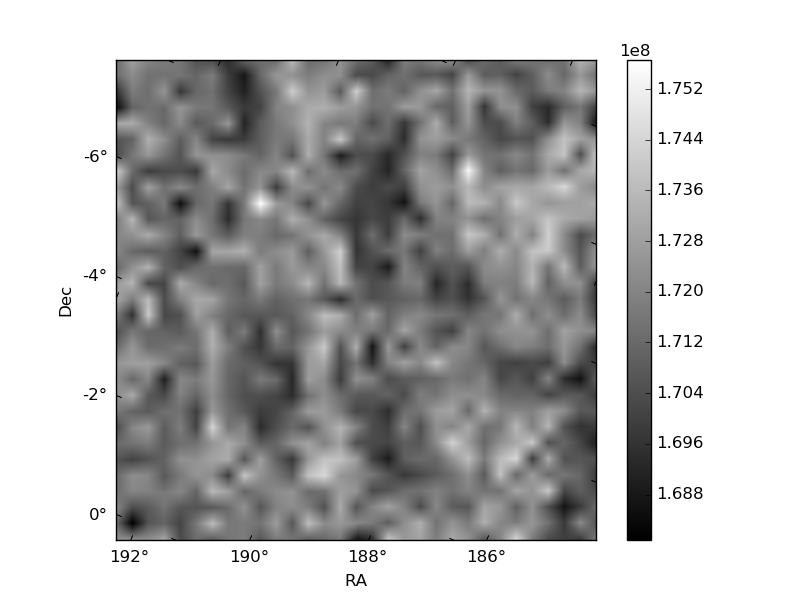
Histogram calculated using DETX and DETY for each event in the final _common_clean file
| Quadrant A | 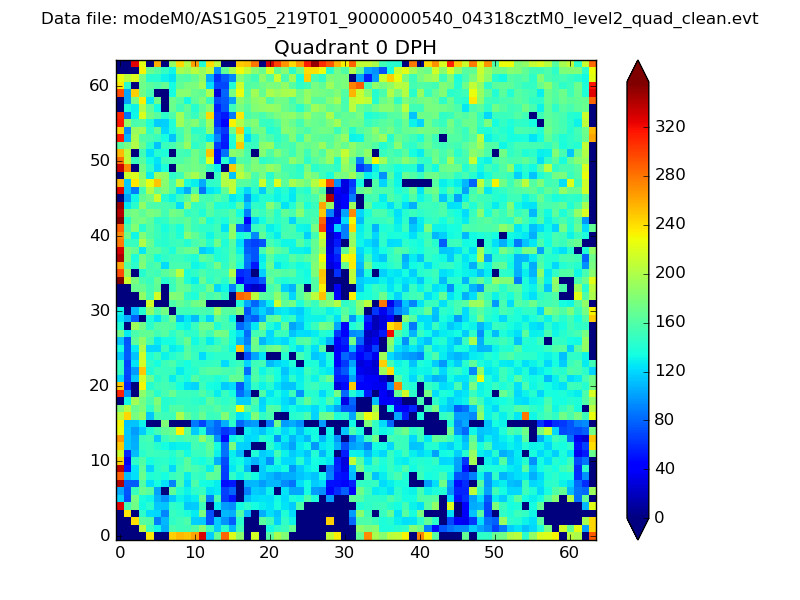 |
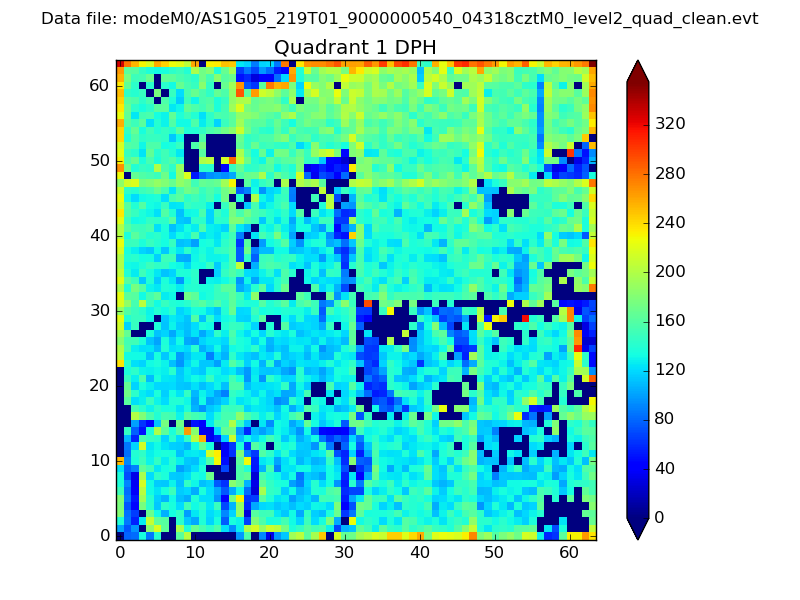 |
Quadrant B |
|---|---|---|---|
| Quadrant D |  |
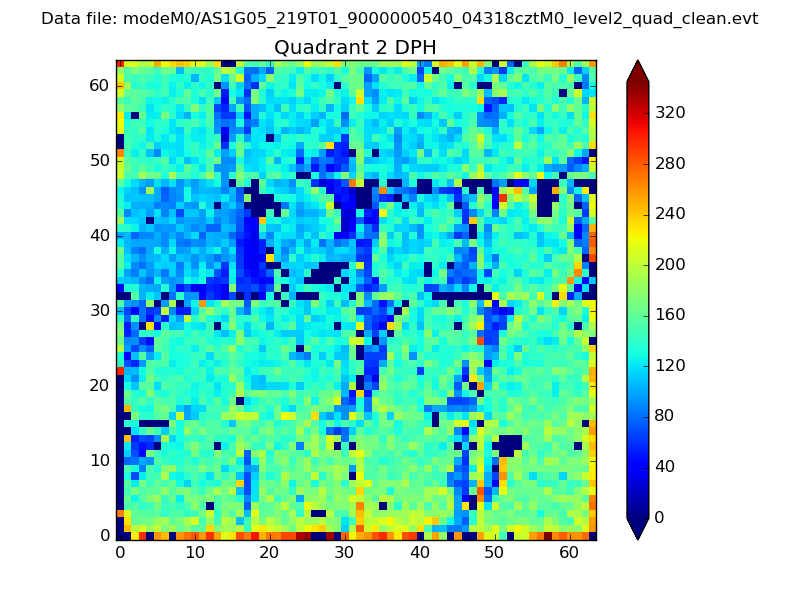 |
Quadrant C |
| Plot type | Count rate plots | Images |
|---|---|---|
| Comparison with Poisson distribution Blue bars denote a histogram of data divided into 1 sec bins. Red curve is a Poisson curve with rate = median count rate of data. |
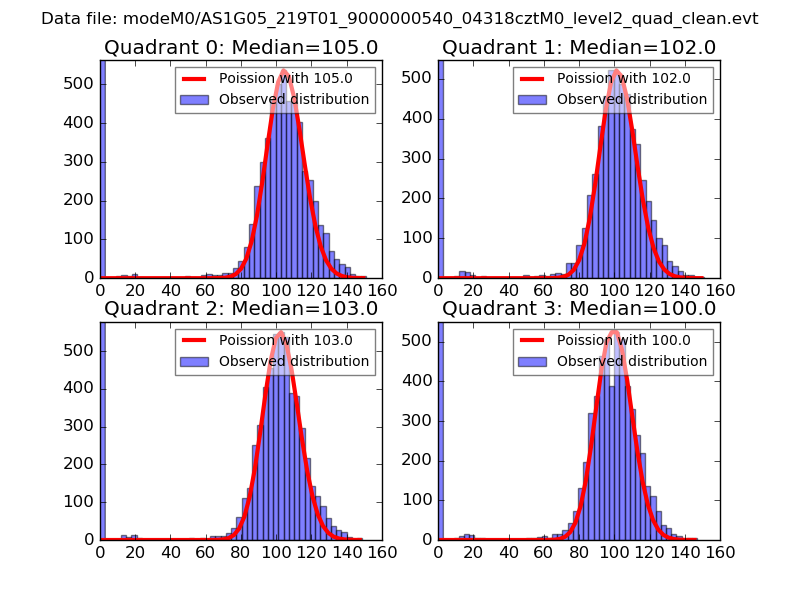 |
 |
| Quadrant-wise count rates Data is divided into 100 sec bins |
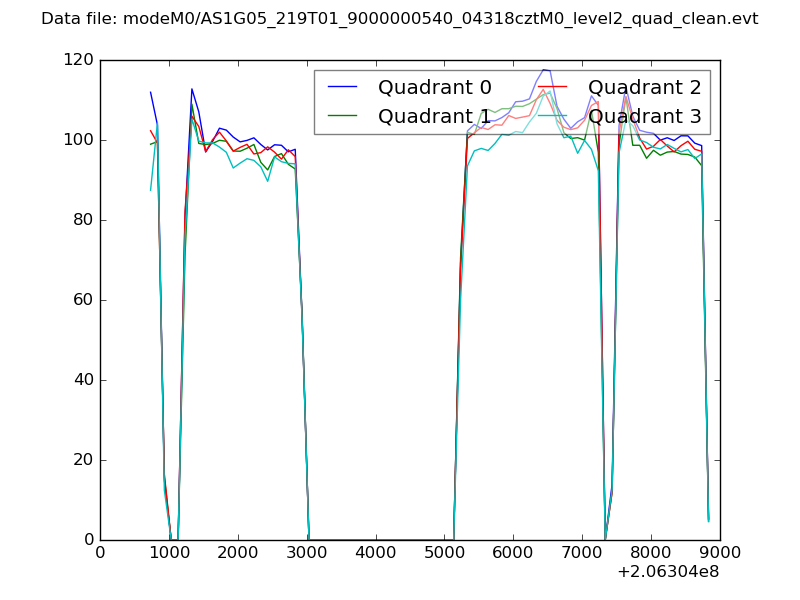 |
|
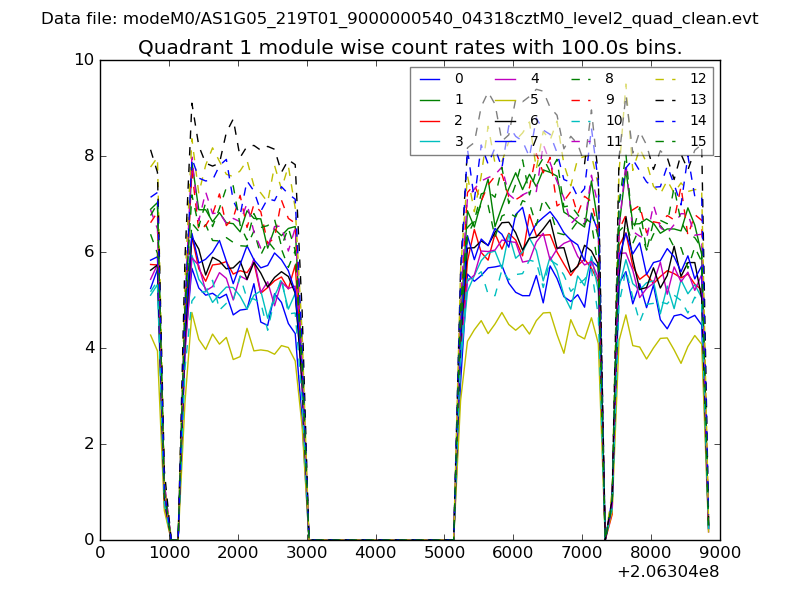
| Module-wise count rates for Quadrant A Data is divided into 100 sec bins |
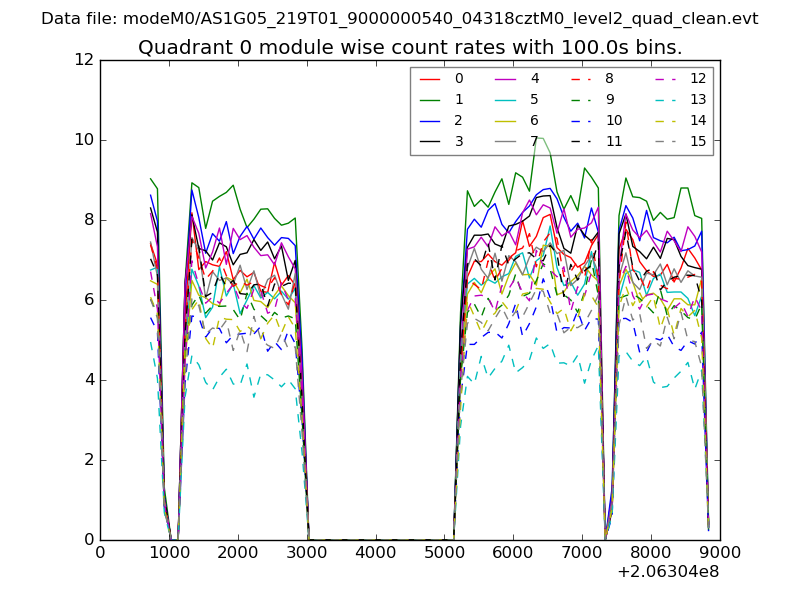 |
 |
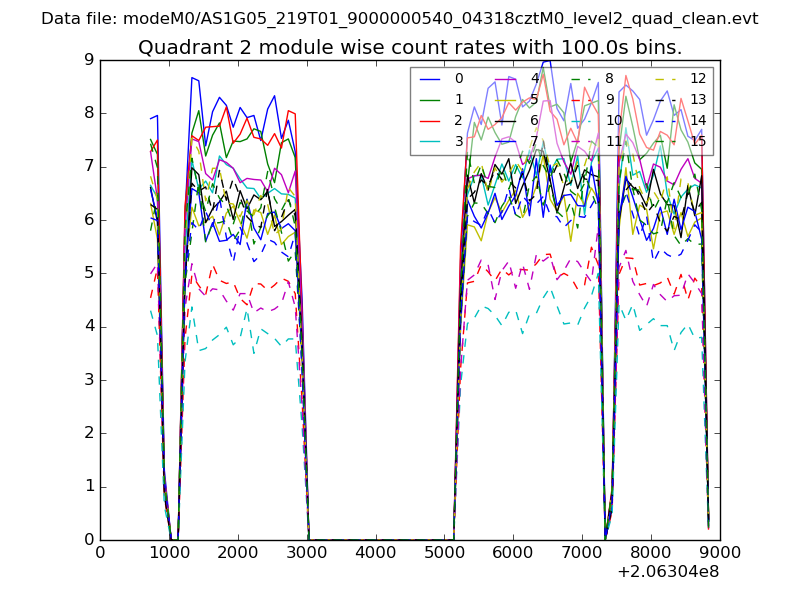
| Module-wise count rates for Quadrant B Data is divided into 100 sec bins |
 |
 |
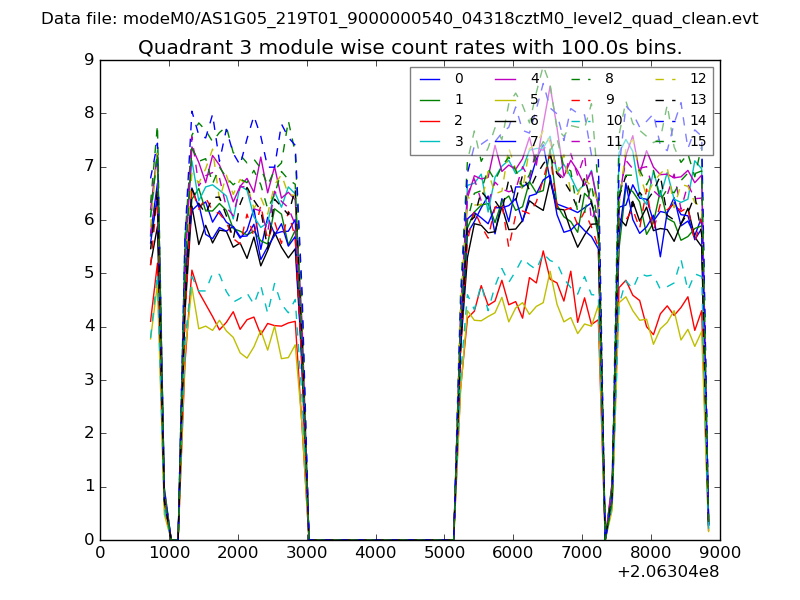
| Module-wise count rates for Quadrant C Data is divided into 100 sec bins |
 |
 |
| Module-wise count rates for Quadrant D Data is divided into 100 sec bins |
 |
 |
| Parameter | Plot |
|---|---|
| CZT HV Monitor | 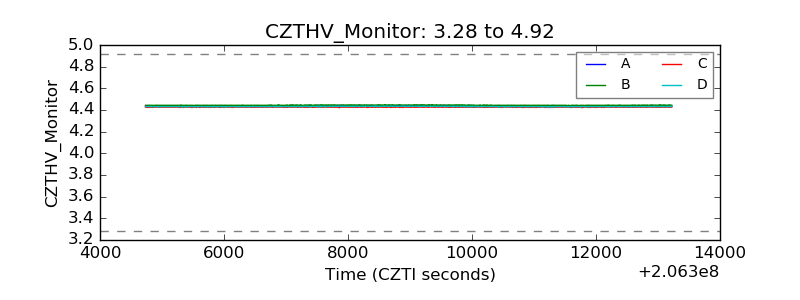 |
| D_VDD | 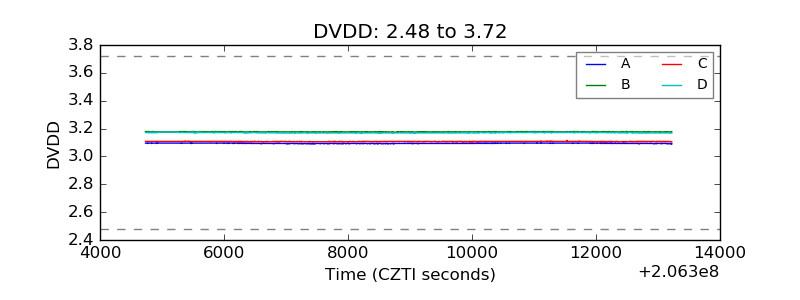 |
| Temperature 1 | 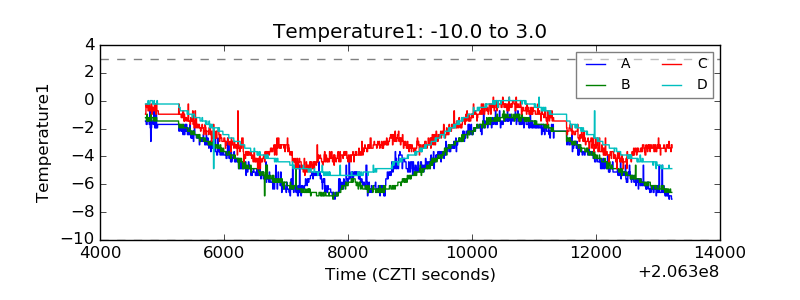 |
| Veto HV Monitor | 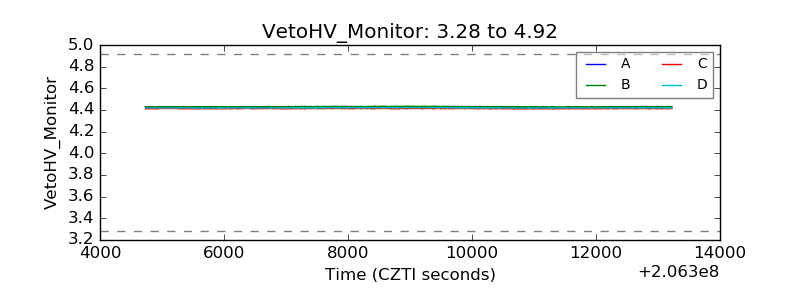 |
| Veto LLD | 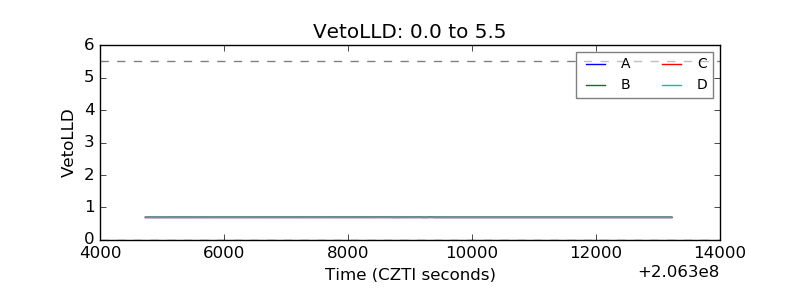 |
| Alpha Counter | 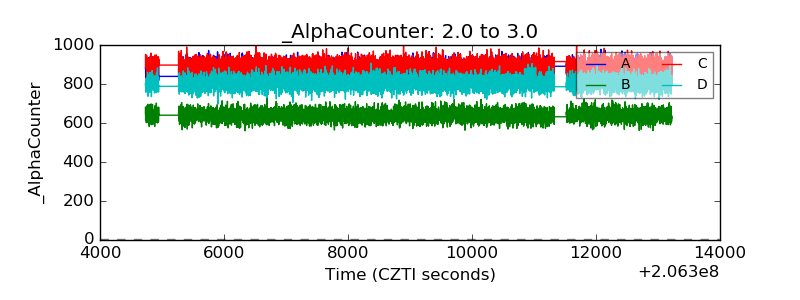 |
| _CPM_Rate | 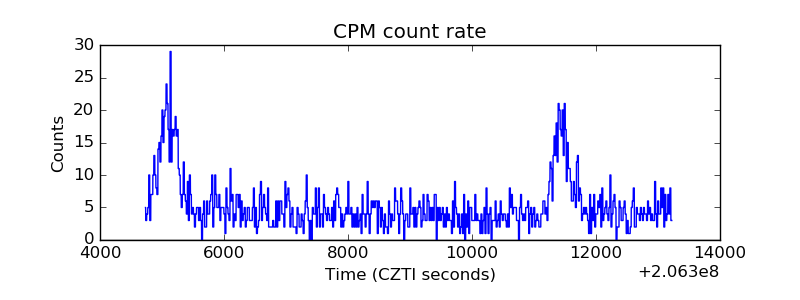 |
| CZT Counter | 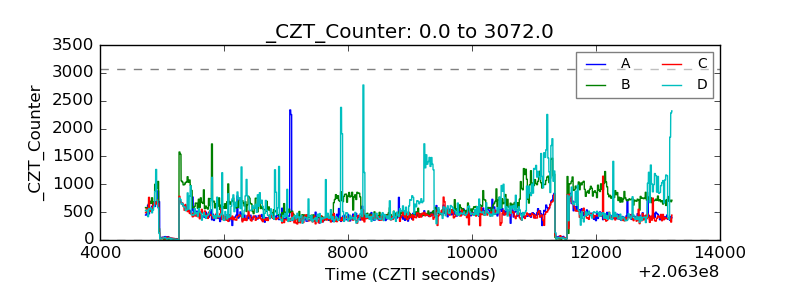 |
| +2.5 Volts monitor |  |
| +5 Volts monitor |  |
| _ROLL_ROT | 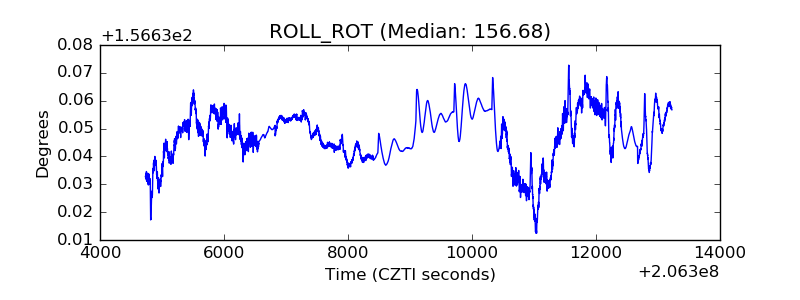 |
| _Roll_DEC | 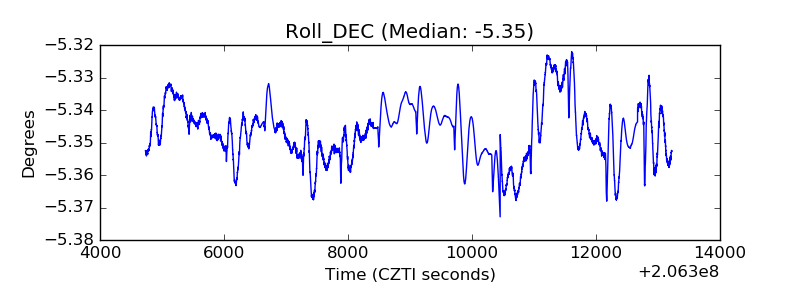 |
| _Roll_RA | 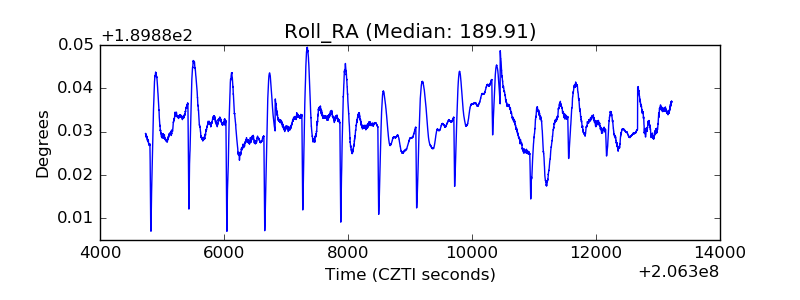 |
| Veto Counter | 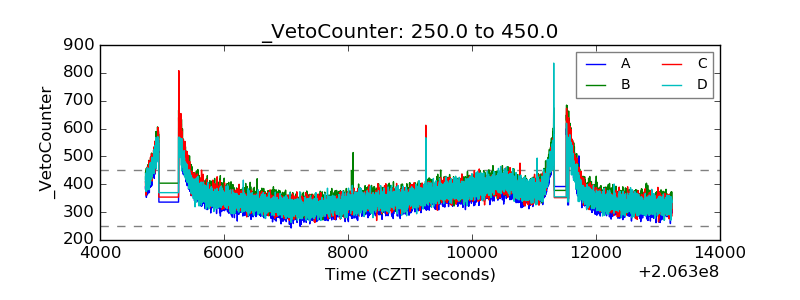 |