| Param | Original file | Final file |
|---|---|---|
| Filename | modeM0/AS1G05_219T01_9000000540_04321cztM0_level2.evt | modeM0/AS1G05_219T01_9000000540_04321cztM0_level2_quad_clean.evt |
| Size (bytes) | 1,448,184,960 | 114,027,840 |
| Size | 1.3 GB | 108.7 MB |
| Events in quadrant A | 6,170,841 | 746,173 |
| Events in quadrant B | 24,598,825 | 352,493 |
| Events in quadrant C | 5,848,236 | 730,504 |
| Events in quadrant D | 6,350,758 | 710,791 |
| Mode SS | |||
|---|---|---|---|
| Quadrant | BADHDUFLAG | Total packets | Discarded packets |
| A | 0 | 272 | 4 |
| B | 0 | 272 | 2 |
| C | 0 | 272 | 2 |
| D | 0 | 272 | 4 |
| Mode M9 | |||
|---|---|---|---|
| Quadrant | BADHDUFLAG | Total packets | Discarded packets |
| A | 0 | 16 | 0 |
| B | 0 | 16 | 0 |
| C | 0 | 16 | 0 |
| D | 0 | 16 | 0 |
| Mode M0 | |||
|---|---|---|---|
| Quadrant | BADHDUFLAG | Total packets | Discarded packets |
| A | 0 | 27729 | 104 |
| B | 0 | 82779 | 879 |
| C | 0 | 27189 | 131 |
| D | 0 | 28938 | 166 |
| Quadrant | Total seconds | Saturated seconds | Saturation percentage |
|---|---|---|---|
| A | 13206 | 175 | 1.325155% |
| B | 13128 | 8118 | 61.837294% |
| C | 13192 | 74 | 0.560946% |
| D | 13187 | 87 | 0.659741% |
Noise dominated data is calculated using 1-second bins in cleaned event files. If a bin has >2000 counts, and if more than 50% of those come from <1% of pixels, then it is considered to be noise-dominated and hence unusable.
| Quadrant | # 1 sec bins | Bins with >0 counts | Bins with >2000 counts | High rate bins dominated by noise | Noise dominated (total time) | Noise dominated (detector-on time) | Marked lightcurve |
|---|---|---|---|---|---|---|---|
| A | 14870 | 13254 | 56 | 56 | 0.38% | 0.42% | 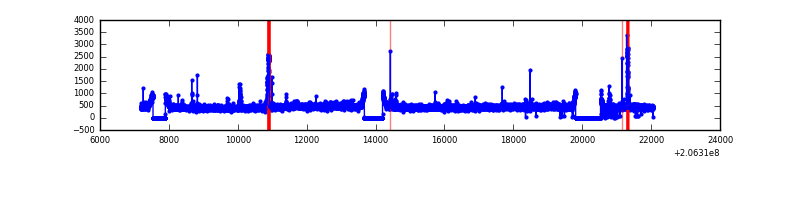 |
| B | 14869 | 13160 | 7742 | 7742 | 52.07% | 58.83% | 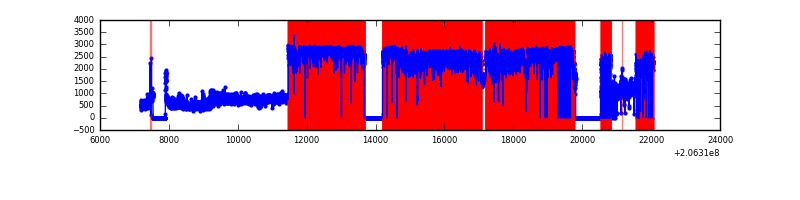 |
| C | 14870 | 13250 | 6 | 6 | 0.04% | 0.05% | 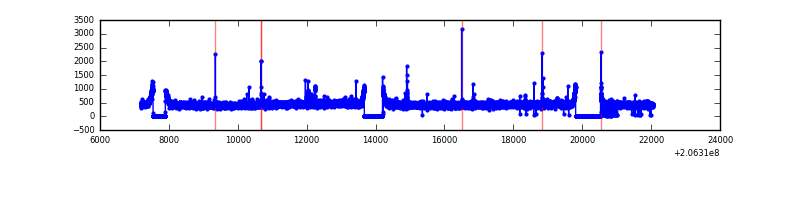 |
| D | 14870 | 13253 | 42 | 42 | 0.28% | 0.32% | 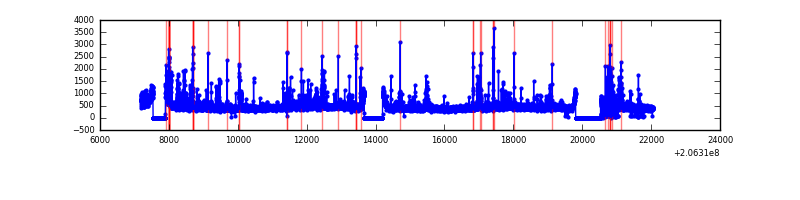 |
Top three noisy pixels from each quadrant. If the there are fewer than three noisy pixels in the level2.evt file, extra rows are filled as -1
| Pixel properties | Quadrant properties | ||||||
|---|---|---|---|---|---|---|---|
| Quadrant | DetID | PixID | Counts | Sigma | Mean | Median | Sigma |
| A | 0 | 50 | 133535 | 428.42 | 1511 | 1474 | 308.2 |
| A | 15 | 234 | 112781 | 361.09 | 1511 | 1474 | 308.2 |
| A | 8 | 15 | 76790 | 244.33 | 1511 | 1474 | 308.2 |
| B | 3 | 0 | 20481996 | 105010.31 | 1011 | 986 | 195.0 |
| B | 4 | 48 | 62928 | 317.59 | 1011 | 986 | 195.0 |
| B | 15 | 204 | 34358 | 171.1 | 1011 | 986 | 195.0 |
| C | 9 | 247 | 56863 | 161.53 | 1462 | 1467 | 342.9 |
| C | 10 | 65 | 35220 | 98.42 | 1462 | 1467 | 342.9 |
| C | 8 | 128 | 15834 | 41.89 | 1462 | 1467 | 342.9 |
| D | 2 | 63 | 191508 | 539.69 | 1453 | 1410 | 352.2 |
| D | 4 | 95 | 187980 | 529.67 | 1453 | 1410 | 352.2 |
| D | 2 | 136 | 89063 | 248.85 | 1453 | 1410 | 352.2 |
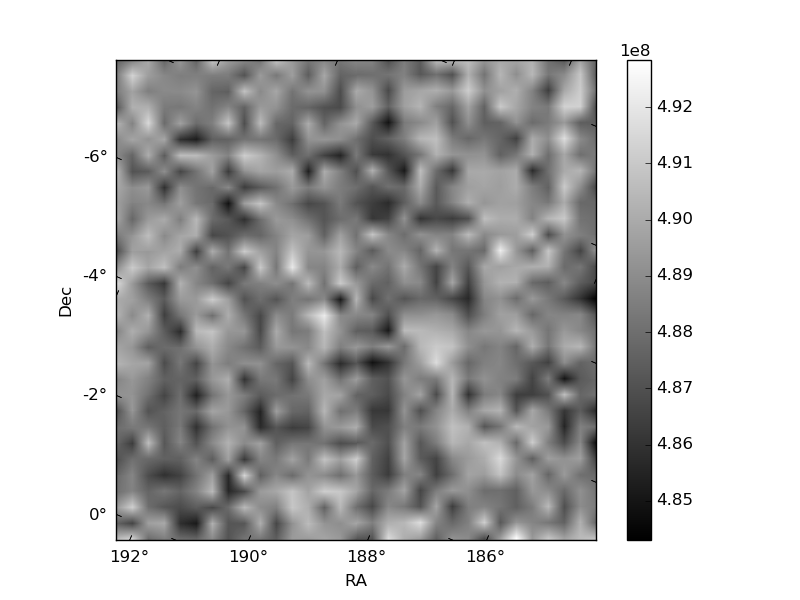
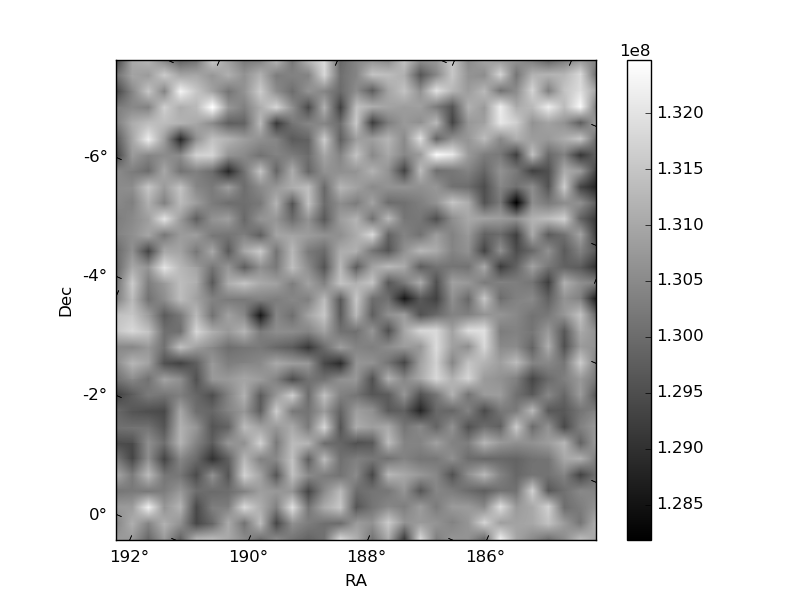
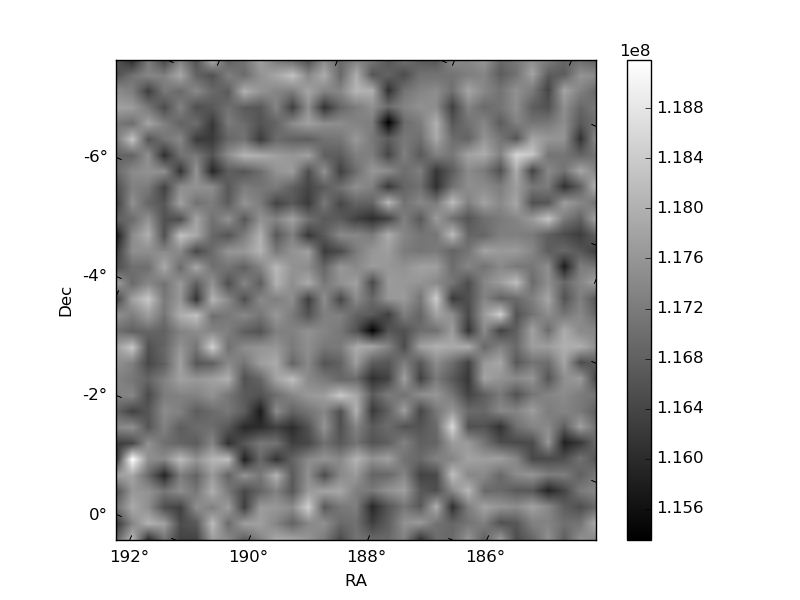
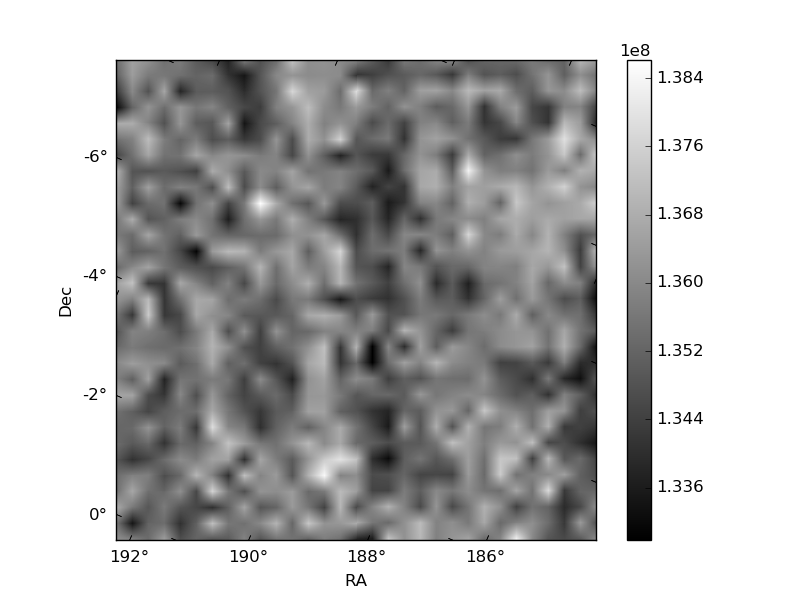
Histogram calculated using DETX and DETY for each event in the final _common_clean file
| Quadrant A | 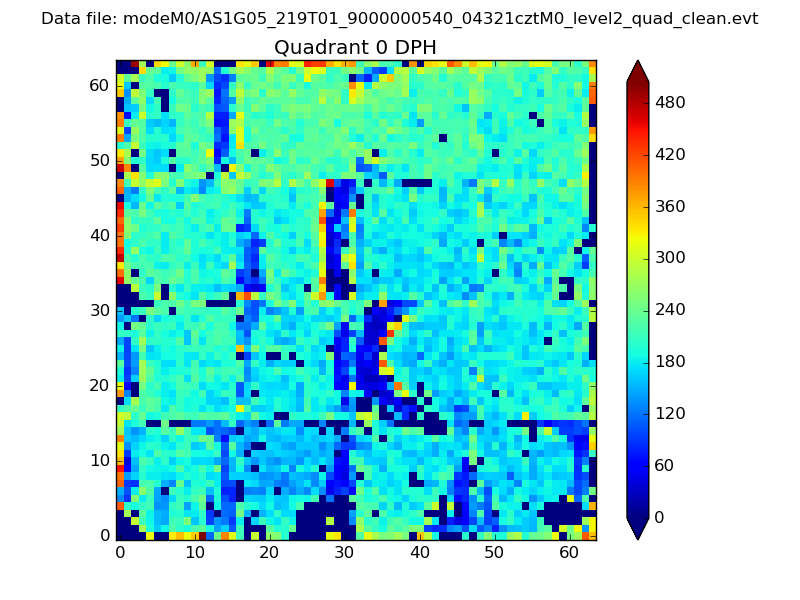 |
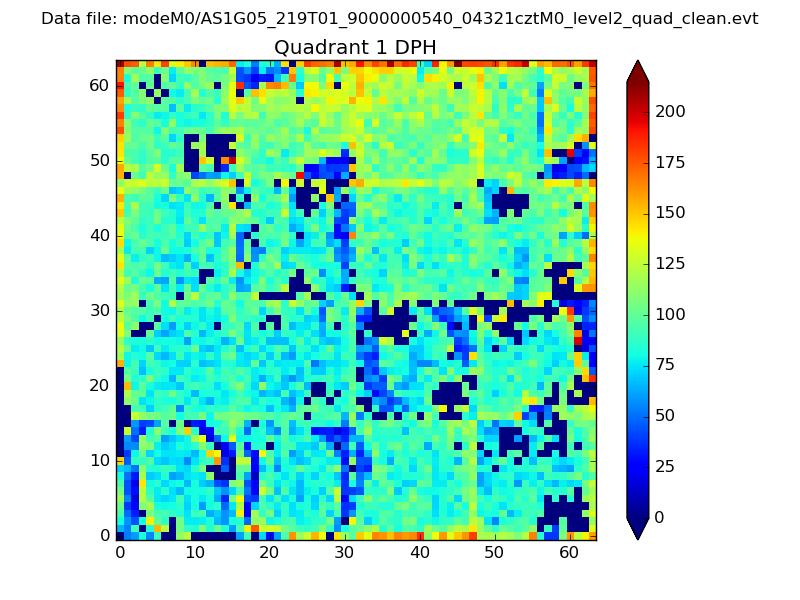 |
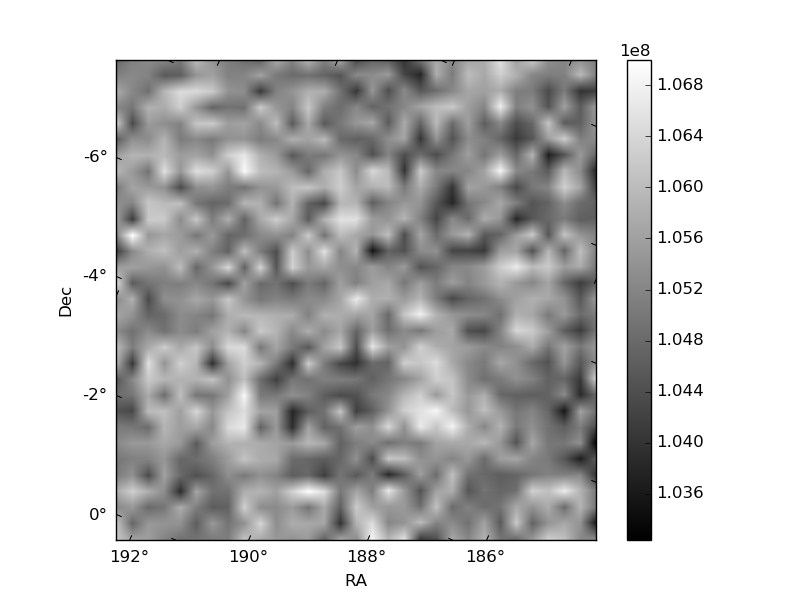
Quadrant B |
|---|---|---|---|
| Quadrant D | 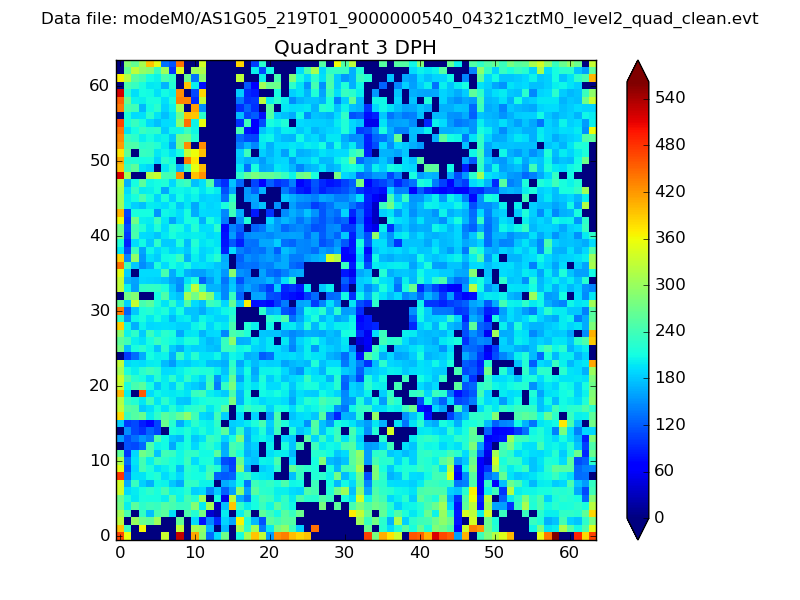 |
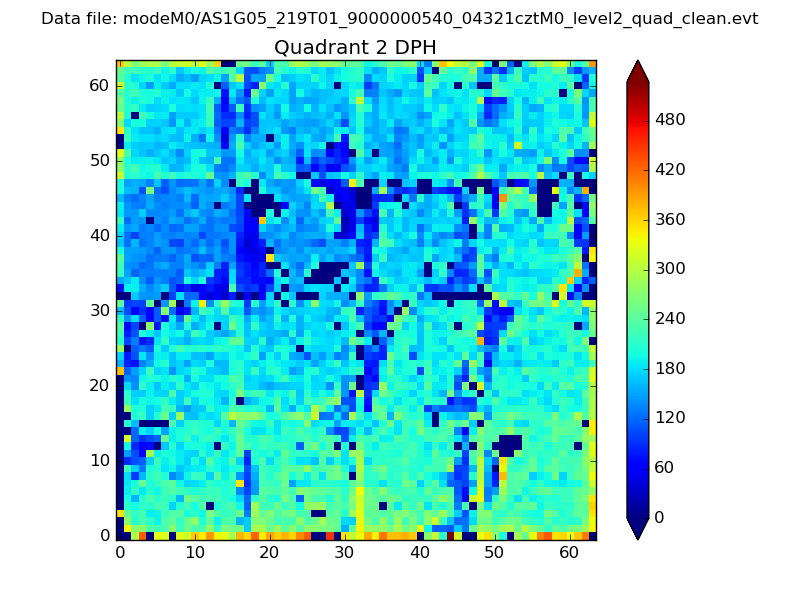 |
Quadrant C |
| Plot type | Count rate plots | Images |
|---|---|---|
| Comparison with Poisson distribution Blue bars denote a histogram of data divided into 1 sec bins. Red curve is a Poisson curve with rate = median count rate of data. |
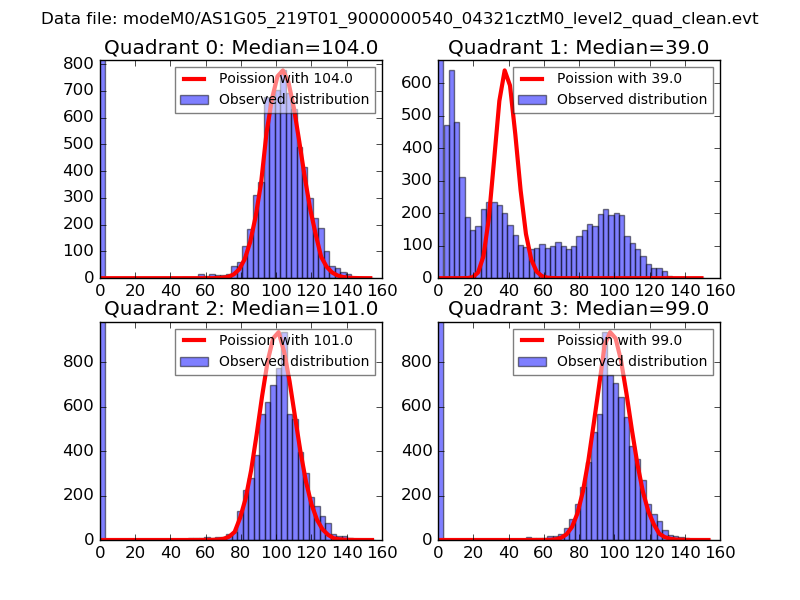 |
 |
| Quadrant-wise count rates Data is divided into 100 sec bins |
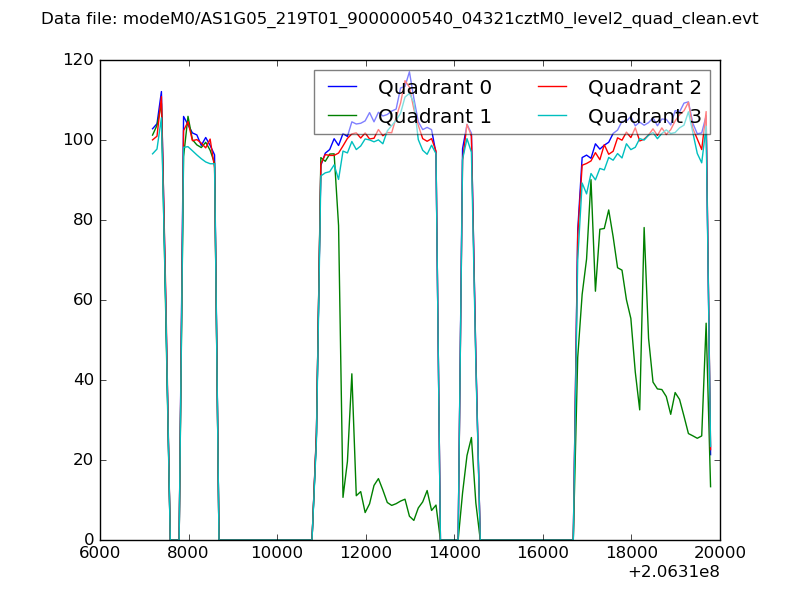 |
|
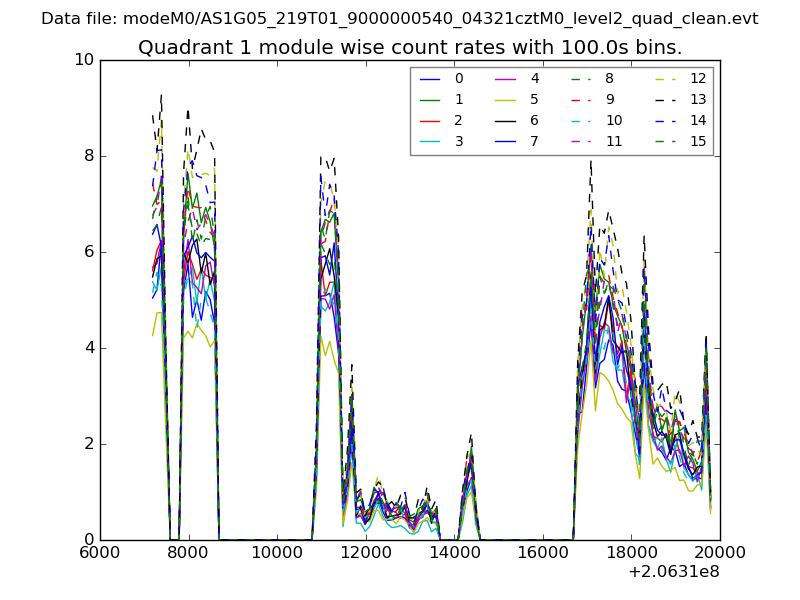
| Module-wise count rates for Quadrant A Data is divided into 100 sec bins |
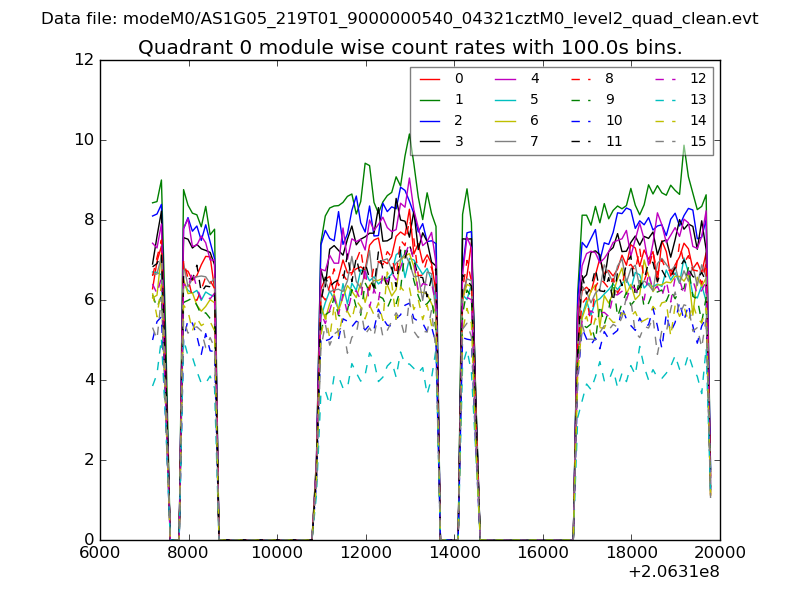 |
 |
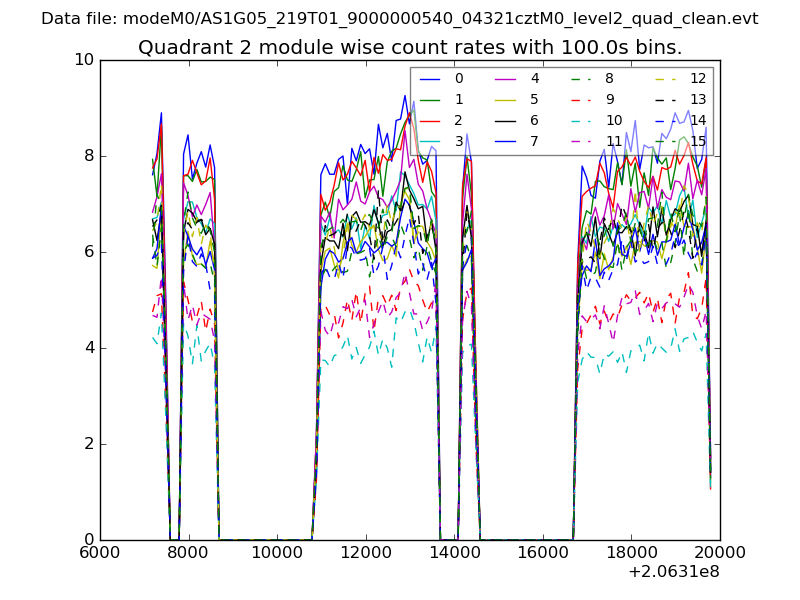
| Module-wise count rates for Quadrant B Data is divided into 100 sec bins |
 |
 |
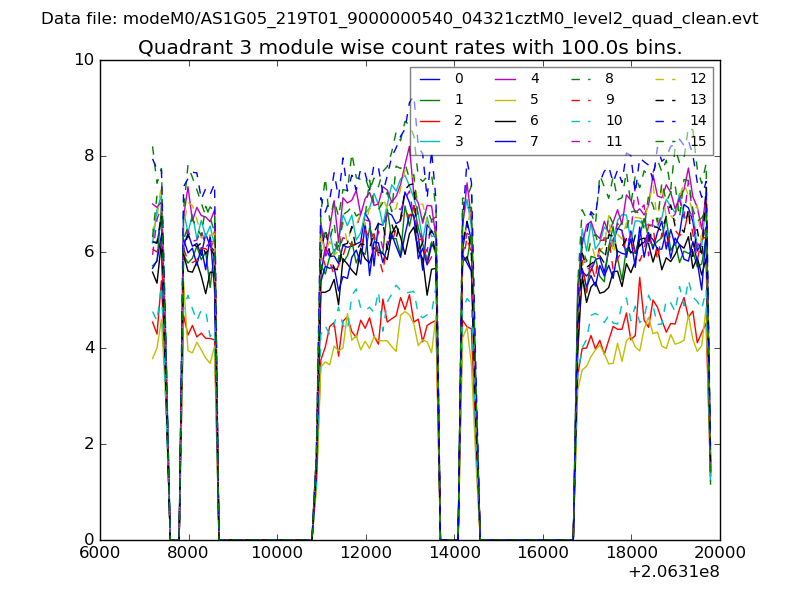
| Module-wise count rates for Quadrant C Data is divided into 100 sec bins |
 |
 |
| Module-wise count rates for Quadrant D Data is divided into 100 sec bins |
 |
 |
| Parameter | Plot |
|---|---|
| CZT HV Monitor | 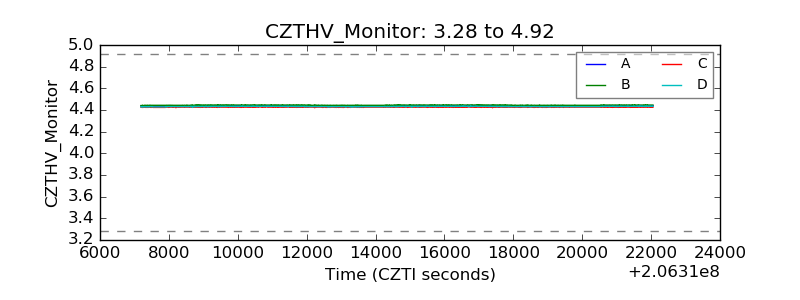 |
| D_VDD | 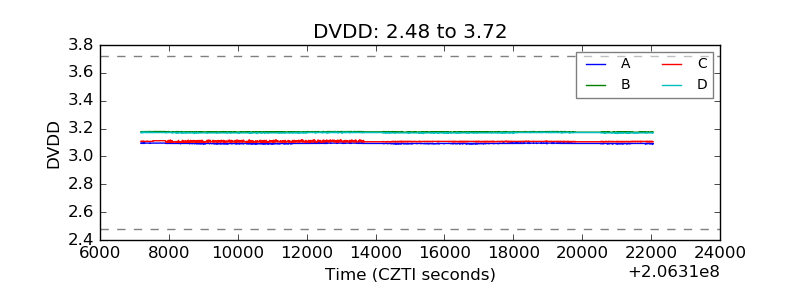 |
| Temperature 1 | 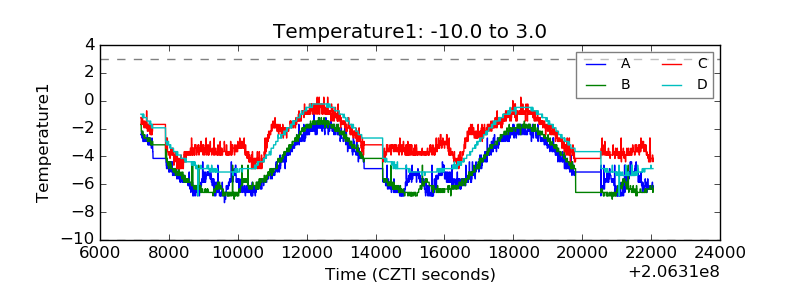 |
| Veto HV Monitor | 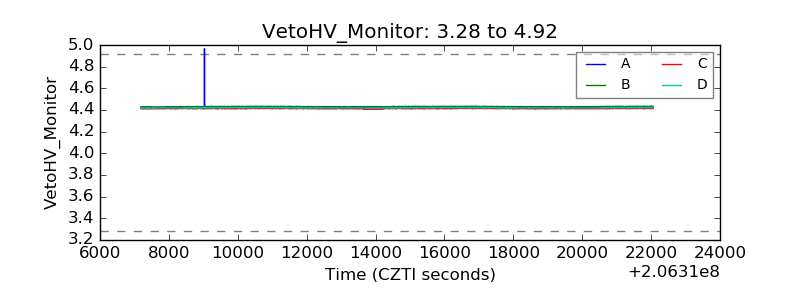 |
| Veto LLD | 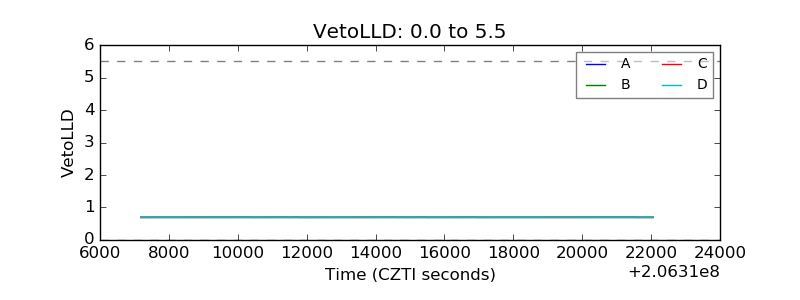 |
| Alpha Counter | 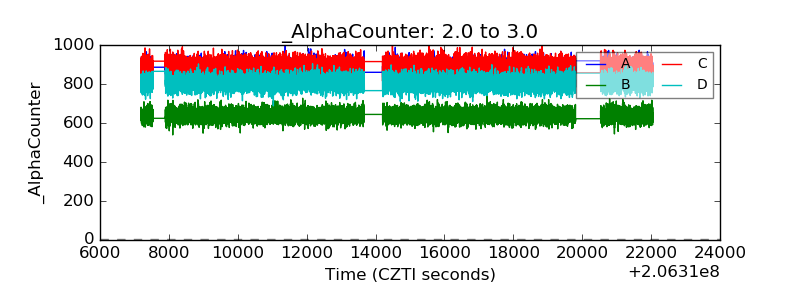 |
| _CPM_Rate | 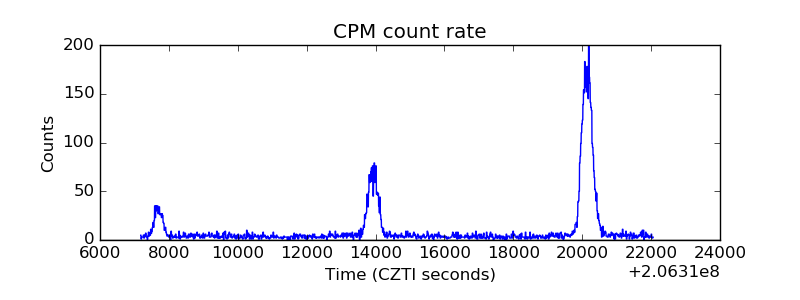 |
| CZT Counter | 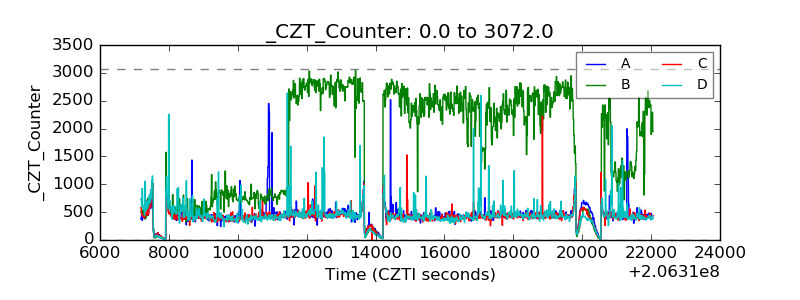 |
| +2.5 Volts monitor |  |
| +5 Volts monitor |  |
| _ROLL_ROT | 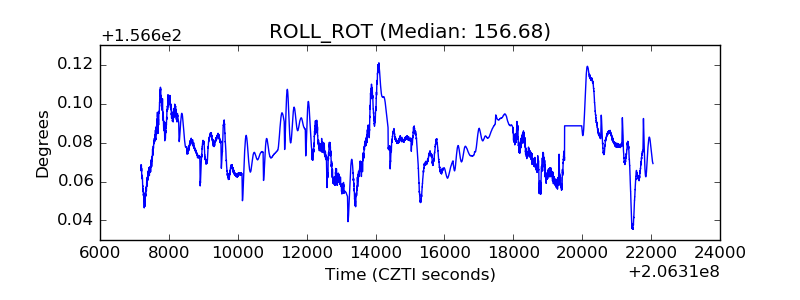 |
| _Roll_DEC | 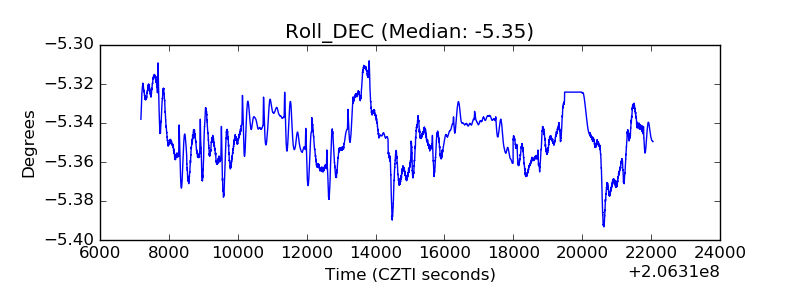 |
| _Roll_RA | 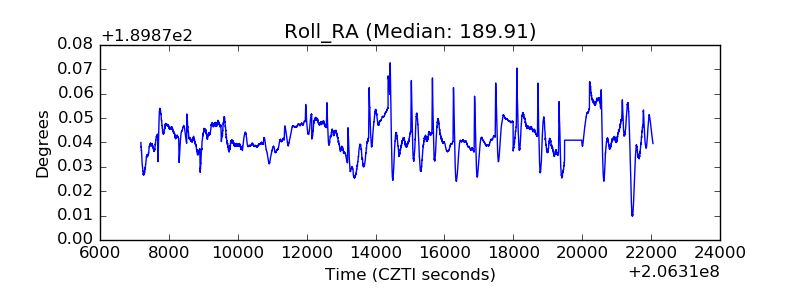 |
| Veto Counter | 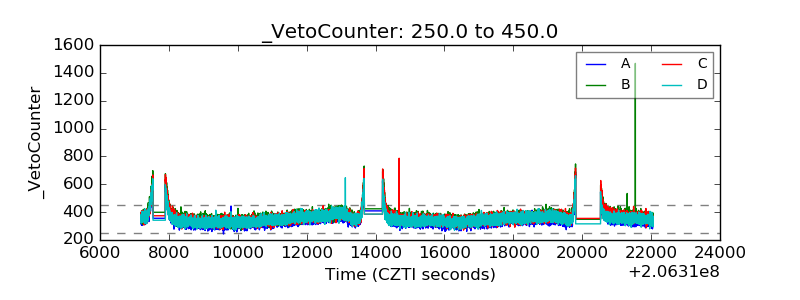 |