| Param | Original file | Final file |
|---|---|---|
| Filename | modeM0/AS1G05_219T01_9000000540_04323cztM0_level2.evt | modeM0/AS1G05_219T01_9000000540_04323cztM0_level2_quad_clean.evt |
| Size (bytes) | 886,533,120 | 56,675,520 |
| Size | 845.5 MB | 54.0 MB |
| Events in quadrant A | 3,174,905 | 392,665 |
| Events in quadrant B | 16,742,999 | 89,313 |
| Events in quadrant C | 3,252,337 | 385,061 |
| Events in quadrant D | 3,222,539 | 377,148 |
| Mode SS | |||
|---|---|---|---|
| Quadrant | BADHDUFLAG | Total packets | Discarded packets |
| A | 0 | 136 | 0 |
| B | 0 | 136 | 0 |
| C | 0 | 136 | 0 |
| D | 0 | 136 | 0 |
| Mode M9 | |||
|---|---|---|---|
| Quadrant | BADHDUFLAG | Total packets | Discarded packets |
| A | 0 | 12 | 0 |
| B | 0 | 12 | 0 |
| C | 0 | 12 | 0 |
| D | 0 | 13 | 0 |
| Mode M0 | |||
|---|---|---|---|
| Quadrant | BADHDUFLAG | Total packets | Discarded packets |
| A | 0 | 13948 | 3 |
| B | 0 | 54330 | 2 |
| C | 0 | 14435 | 2 |
| D | 0 | 14342 | 2 |
| Quadrant | Total seconds | Saturated seconds | Saturation percentage |
|---|---|---|---|
| A | 6740 | 90 | 1.335312% |
| B | 6740 | 6060 | 89.910979% |
| C | 6740 | 127 | 1.884273% |
| D | 6740 | 90 | 1.335312% |
Noise dominated data is calculated using 1-second bins in cleaned event files. If a bin has >2000 counts, and if more than 50% of those come from <1% of pixels, then it is considered to be noise-dominated and hence unusable.
| Quadrant | # 1 sec bins | Bins with >0 counts | Bins with >2000 counts | High rate bins dominated by noise | Noise dominated (total time) | Noise dominated (detector-on time) | Marked lightcurve |
|---|---|---|---|---|---|---|---|
| A | 7750 | 6740 | 4 | 4 | 0.05% | 0.06% | 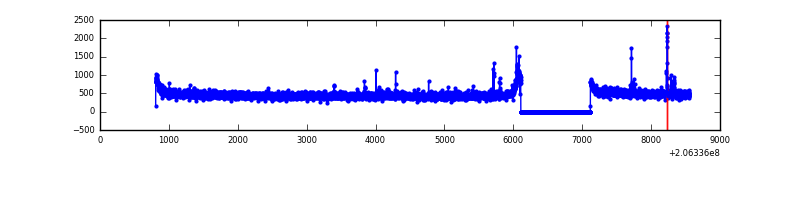 |
| B | 7749 | 6739 | 5752 | 5752 | 74.23% | 85.35% | 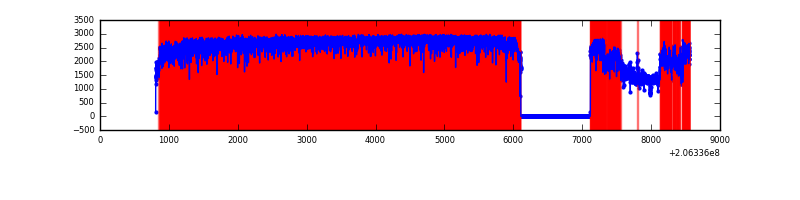 |
| C | 7750 | 6740 | 34 | 34 | 0.44% | 0.50% | 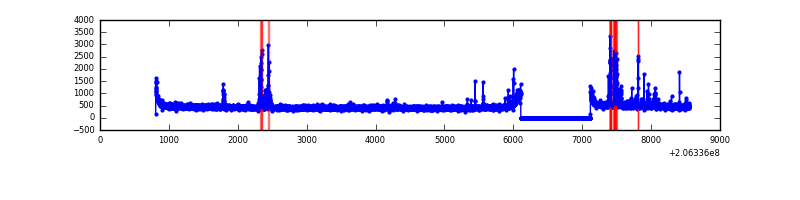 |
| D | 7750 | 6740 | 25 | 25 | 0.32% | 0.37% |  |
Top three noisy pixels from each quadrant. If the there are fewer than three noisy pixels in the level2.evt file, extra rows are filled as -1
| Pixel properties | Quadrant properties | ||||||
|---|---|---|---|---|---|---|---|
| Quadrant | DetID | PixID | Counts | Sigma | Mean | Median | Sigma |
| A | 15 | 234 | 28612 | 170.02 | 803 | 784 | 163.7 |
| A | 8 | 15 | 19055 | 111.63 | 803 | 784 | 163.7 |
| A | 13 | 14 | 17217 | 100.4 | 803 | 784 | 163.7 |
| B | 3 | 0 | 15265019 | 214565.9 | 365 | 356 | 71.1 |
| B | 15 | 204 | 20364 | 281.24 | 365 | 356 | 71.1 |
| B | 14 | 167 | 14263 | 195.48 | 365 | 356 | 71.1 |
| C | 9 | 247 | 236155 | 1305.94 | 771 | 774 | 180.2 |
| C | 13 | 61 | 6479 | 31.65 | 771 | 774 | 180.2 |
| C | 7 | 174 | 3323 | 14.14 | 771 | 774 | 180.2 |
| D | 4 | 95 | 82973 | 436.99 | 772 | 748 | 188.2 |
| D | 13 | 239 | 38587 | 201.1 | 772 | 748 | 188.2 |
| D | 13 | 223 | 36956 | 192.43 | 772 | 748 | 188.2 |
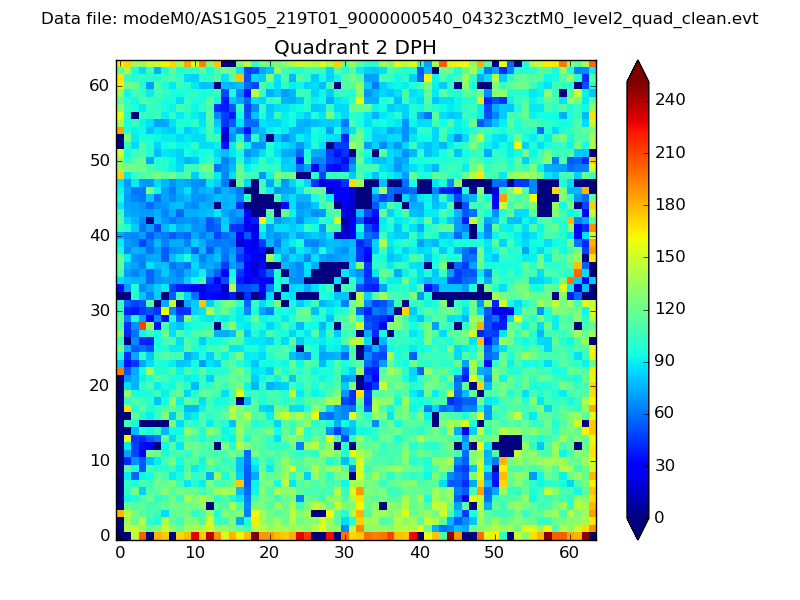
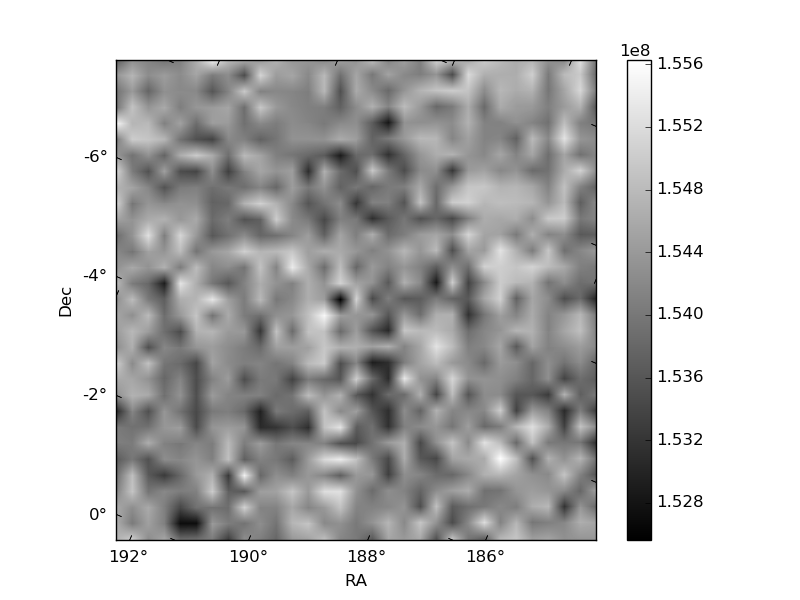
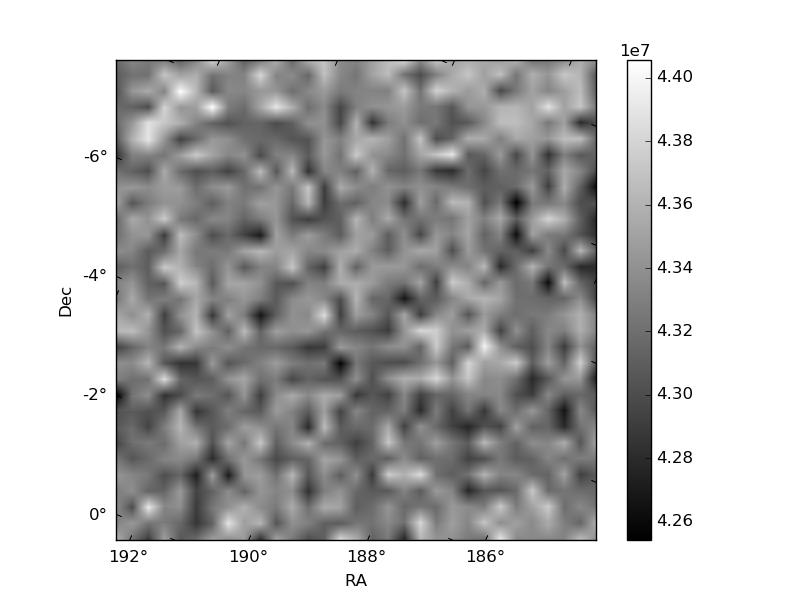
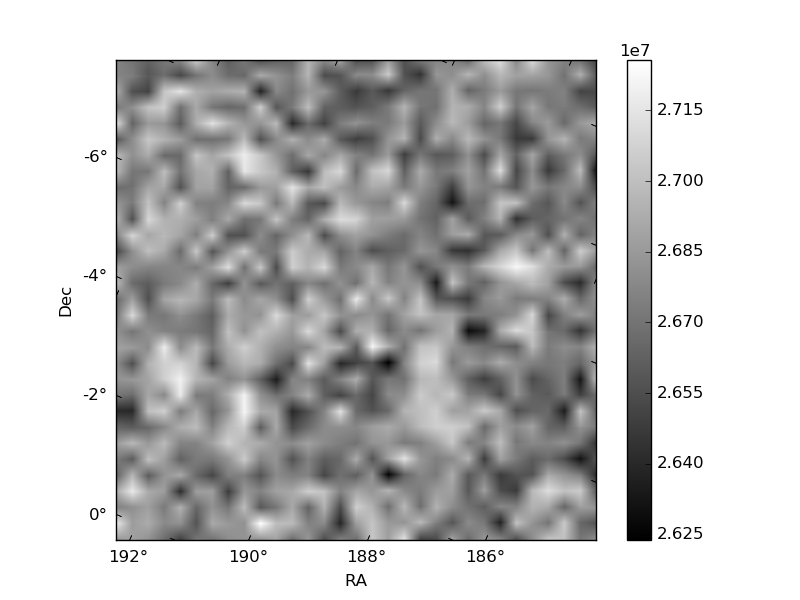
Histogram calculated using DETX and DETY for each event in the final _common_clean file
| Quadrant A | 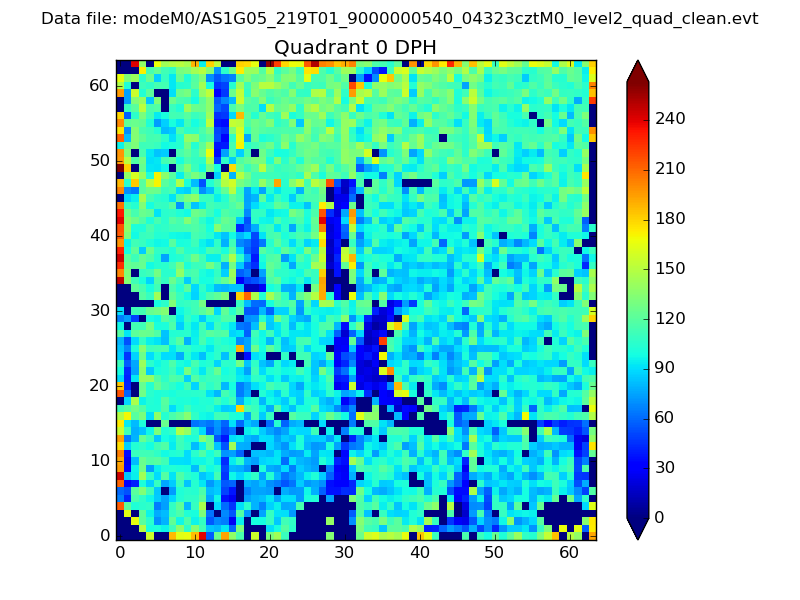 |
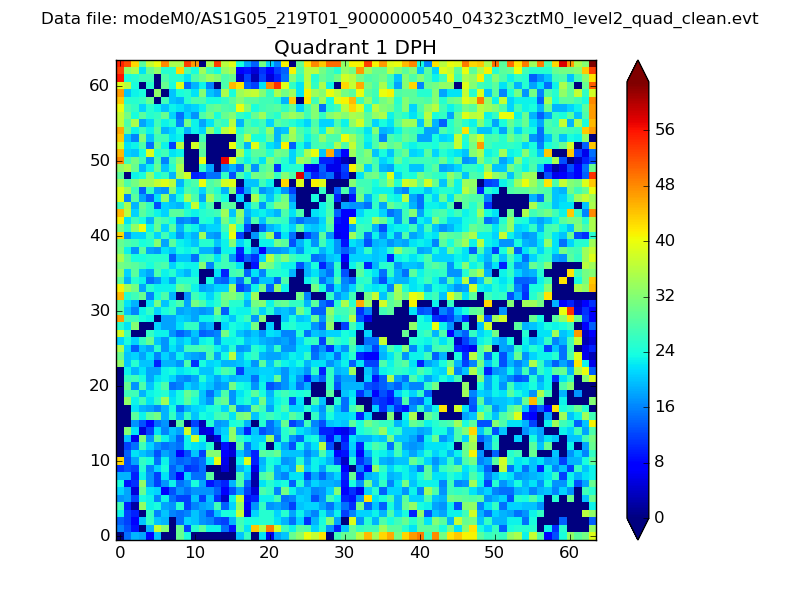 |
Quadrant B |
|---|---|---|---|
| Quadrant D | 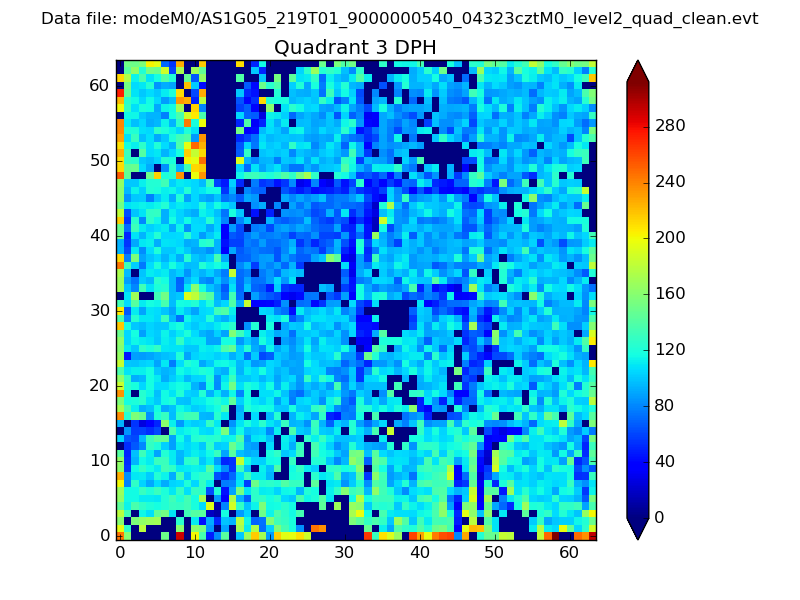 |
 |
Quadrant C |
| Plot type | Count rate plots | Images |
|---|---|---|
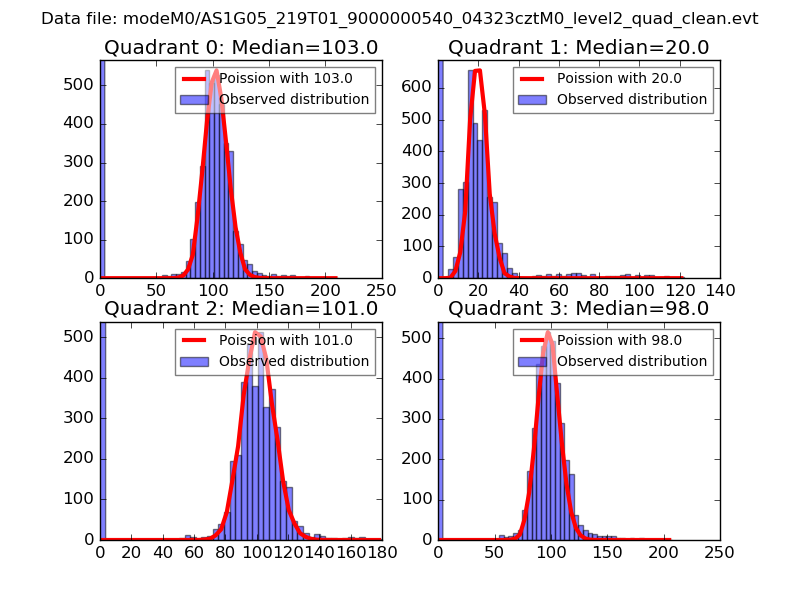
| Comparison with Poisson distribution Blue bars denote a histogram of data divided into 1 sec bins. Red curve is a Poisson curve with rate = median count rate of data. |
 |
 |
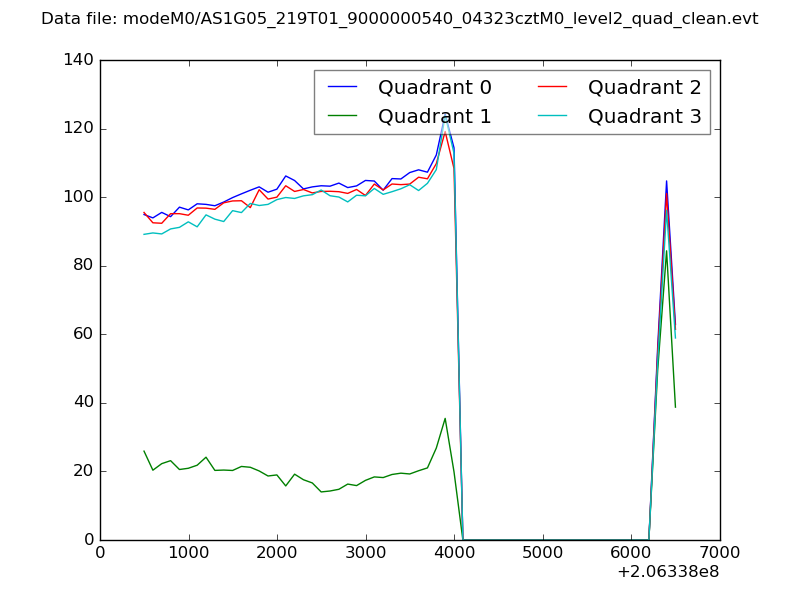
| Quadrant-wise count rates Data is divided into 100 sec bins |
 |
|
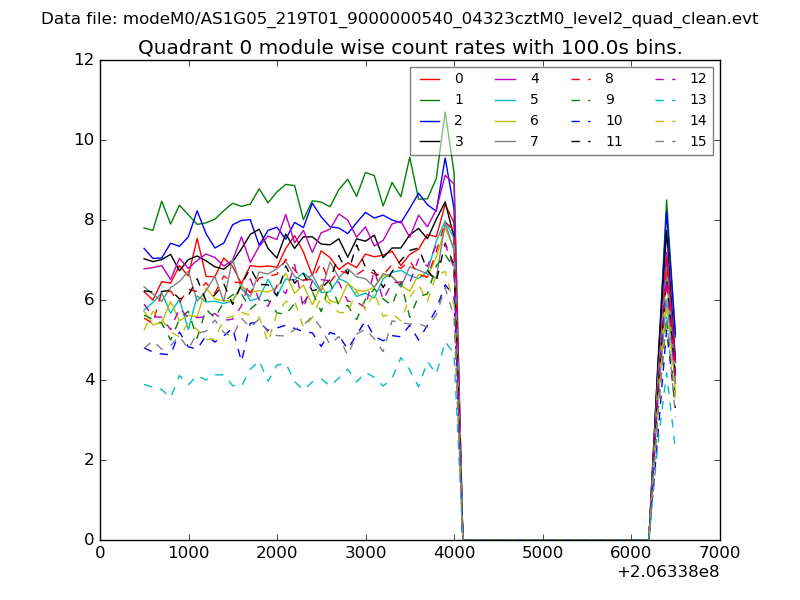
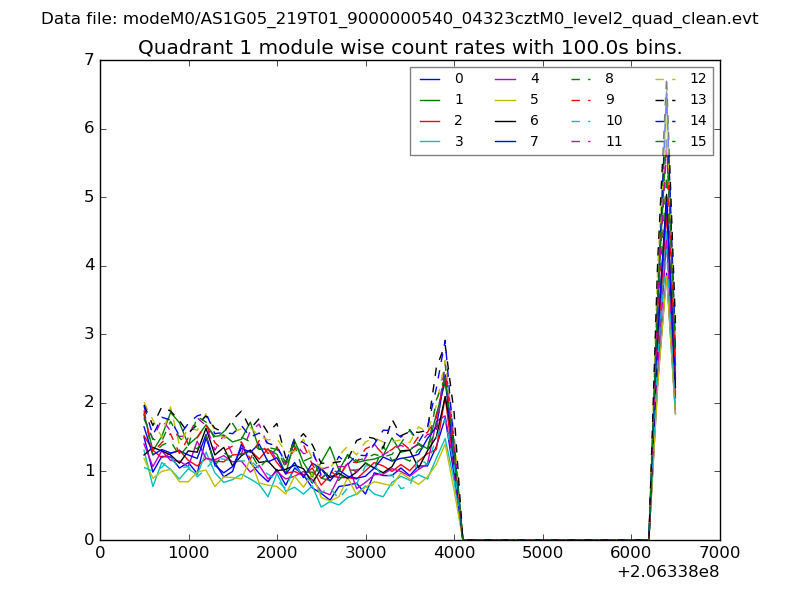
| Module-wise count rates for Quadrant A Data is divided into 100 sec bins |
 |
 |
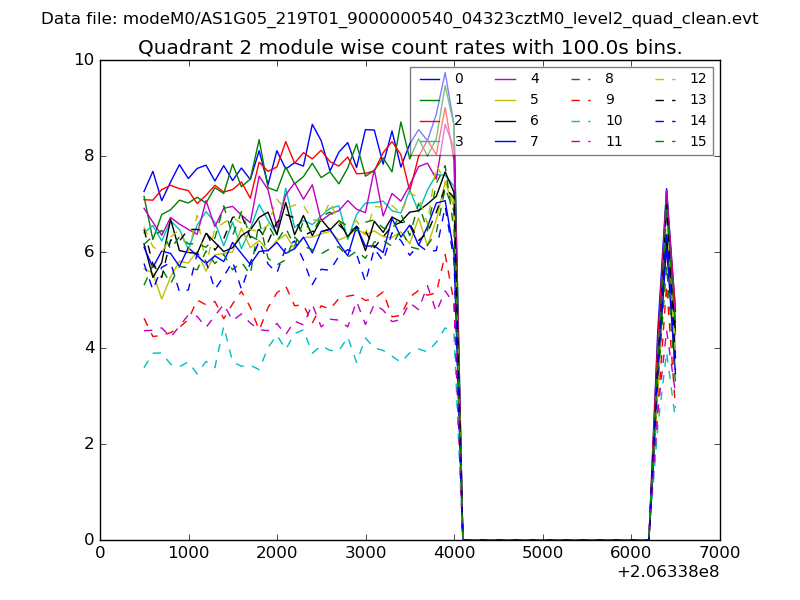
| Module-wise count rates for Quadrant B Data is divided into 100 sec bins |
 |
 |
| Module-wise count rates for Quadrant C Data is divided into 100 sec bins |
 |
 |
| Module-wise count rates for Quadrant D Data is divided into 100 sec bins |
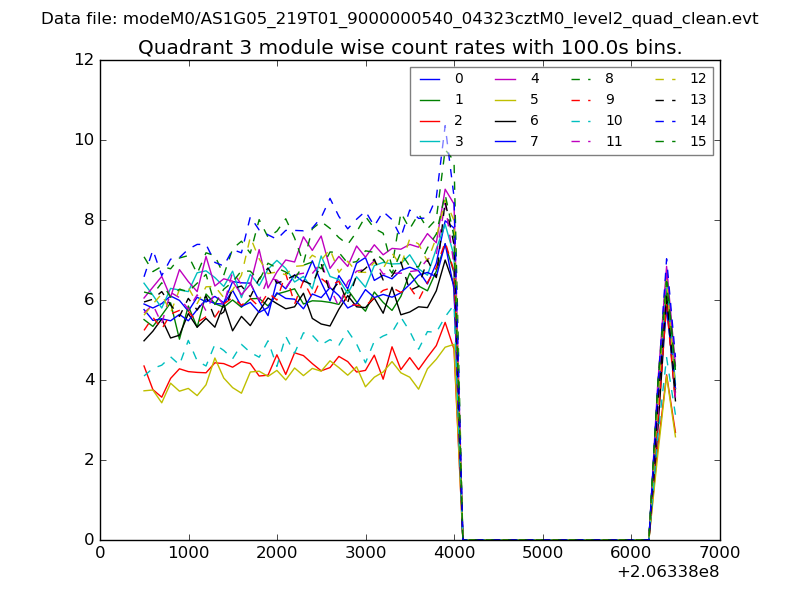 |
 |
| Parameter | Plot |
|---|---|
| CZT HV Monitor | 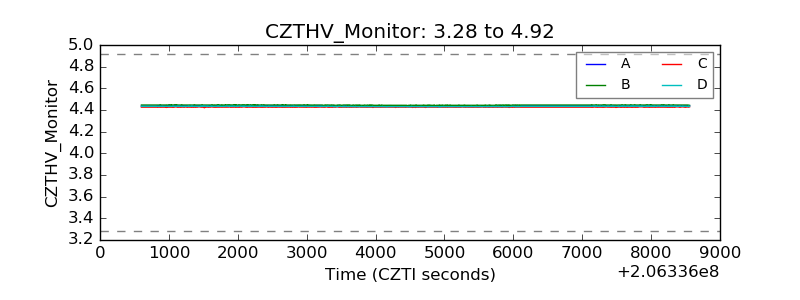 |
| D_VDD | 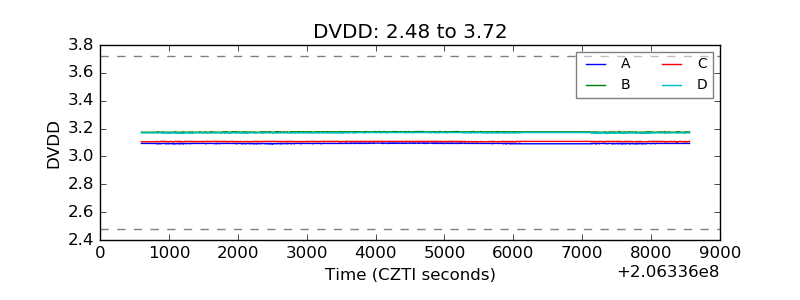 |
| Temperature 1 | 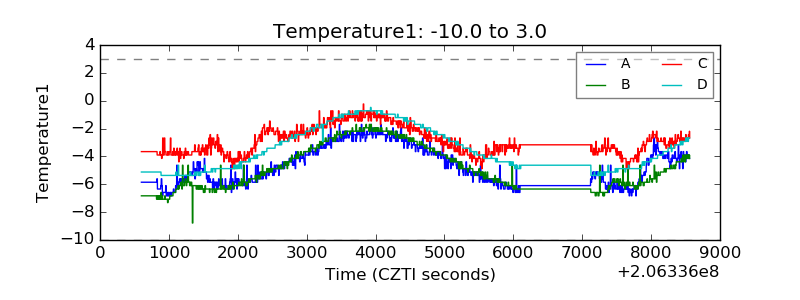 |
| Veto HV Monitor | 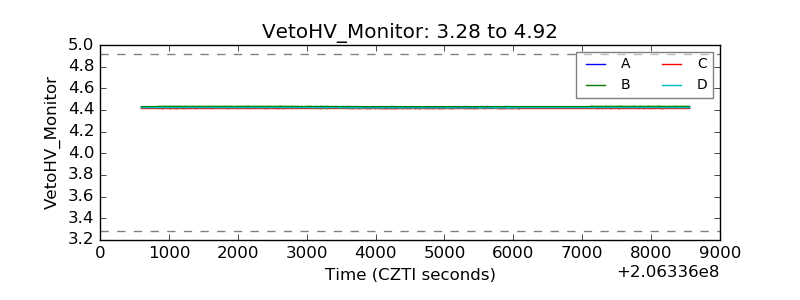 |
| Veto LLD | 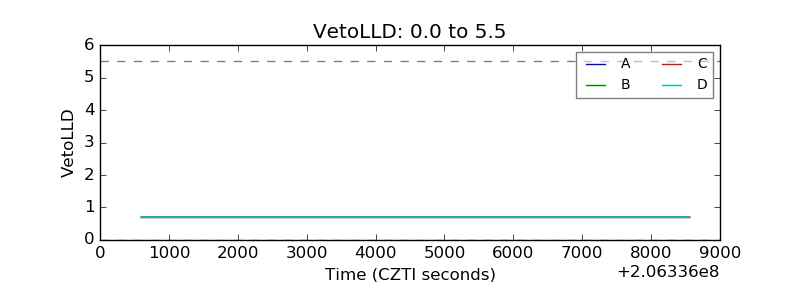 |
| Alpha Counter |  |
| _CPM_Rate |  |
| CZT Counter | 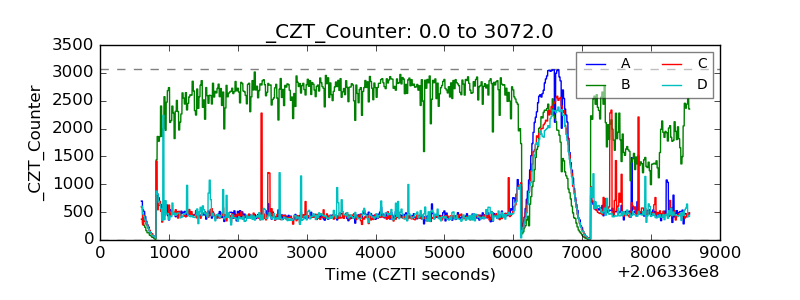 |
| +2.5 Volts monitor |  |
| +5 Volts monitor |  |
| _ROLL_ROT | 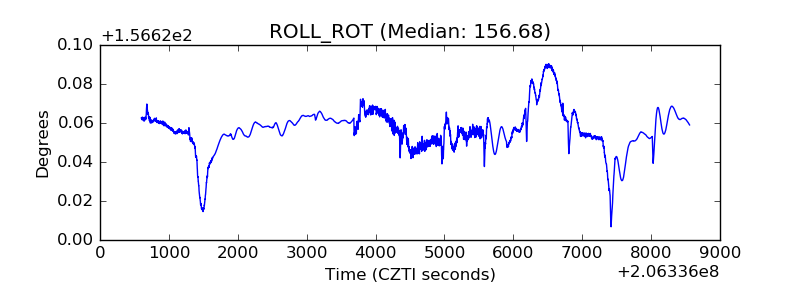 |
| _Roll_DEC | 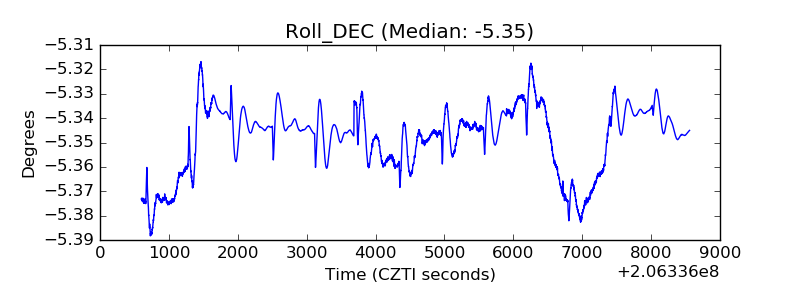 |
| _Roll_RA | 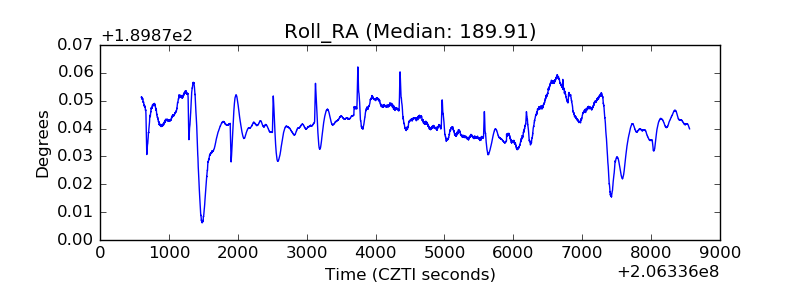 |
| Veto Counter | 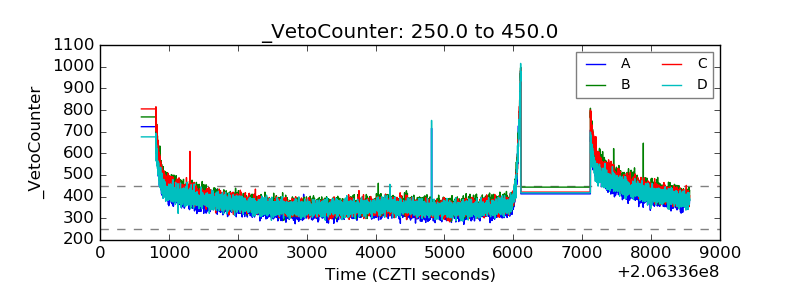 |