| Param | Original file | Final file |
|---|---|---|
| Filename | modeM0/AS1G05_219T01_9000000540_04325cztM0_level2.evt | modeM0/AS1G05_219T01_9000000540_04325cztM0_level2_quad_clean.evt |
| Size (bytes) | 815,938,560 | 63,720,000 |
| Size | 778.1 MB | 60.8 MB |
| Events in quadrant A | 3,393,443 | 432,272 |
| Events in quadrant B | 14,472,060 | 204,831 |
| Events in quadrant C | 3,273,436 | 424,299 |
| Events in quadrant D | 3,132,527 | 413,267 |
| Mode SS | |||
|---|---|---|---|
| Quadrant | BADHDUFLAG | Total packets | Discarded packets |
| A | 0 | 132 | 0 |
| B | 0 | 132 | 0 |
| C | 0 | 132 | 0 |
| D | 0 | 132 | 0 |
| Mode M9 | |||
|---|---|---|---|
| Quadrant | BADHDUFLAG | Total packets | Discarded packets |
| A | 0 | 17 | 0 |
| B | 0 | 17 | 0 |
| C | 0 | 17 | 0 |
| D | 0 | 18 | 0 |
| Mode M0 | |||
|---|---|---|---|
| Quadrant | BADHDUFLAG | Total packets | Discarded packets |
| A | 0 | 14125 | 3 |
| B | 0 | 47528 | 7 |
| C | 0 | 14117 | 2 |
| D | 0 | 13768 | 2 |
| Quadrant | Total seconds | Saturated seconds | Saturation percentage |
|---|---|---|---|
| A | 6489 | 154 | 2.373247% |
| B | 6488 | 4920 | 75.832306% |
| C | 6489 | 134 | 2.065033% |
| D | 6489 | 92 | 1.417784% |
Noise dominated data is calculated using 1-second bins in cleaned event files. If a bin has >2000 counts, and if more than 50% of those come from <1% of pixels, then it is considered to be noise-dominated and hence unusable.
| Quadrant | # 1 sec bins | Bins with >0 counts | Bins with >2000 counts | High rate bins dominated by noise | Noise dominated (total time) | Noise dominated (detector-on time) | Marked lightcurve |
|---|---|---|---|---|---|---|---|
| A | 7599 | 6489 | 38 | 38 | 0.50% | 0.59% |  |
| B | 7599 | 6489 | 4394 | 4394 | 57.82% | 67.71% |  |
| C | 7599 | 6489 | 49 | 49 | 0.64% | 0.76% | 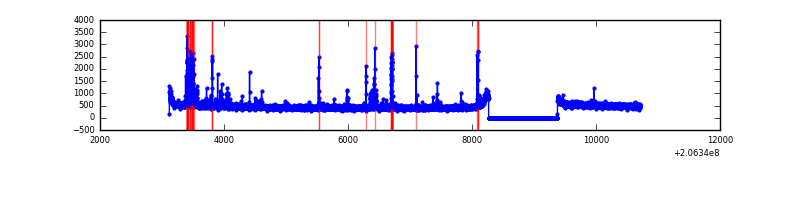 |
| D | 7599 | 6489 | 22 | 22 | 0.29% | 0.34% |  |
Top three noisy pixels from each quadrant. If the there are fewer than three noisy pixels in the level2.evt file, extra rows are filled as -1
| Pixel properties | Quadrant properties | ||||||
|---|---|---|---|---|---|---|---|
| Quadrant | DetID | PixID | Counts | Sigma | Mean | Median | Sigma |
| A | 8 | 15 | 154365 | 946.43 | 794 | 776 | 162.3 |
| A | 14 | 111 | 86512 | 528.31 | 794 | 776 | 162.3 |
| A | 15 | 234 | 33772 | 203.32 | 794 | 776 | 162.3 |
| B | 3 | 0 | 12323468 | 123234.16 | 523 | 513 | 100.0 |
| B | 8 | 3 | 26334 | 258.22 | 523 | 513 | 100.0 |
| B | 14 | 167 | 25070 | 245.58 | 523 | 513 | 100.0 |
| C | 9 | 247 | 292077 | 1633.8 | 763 | 765 | 178.3 |
| C | 13 | 61 | 6600 | 32.73 | 763 | 765 | 178.3 |
| C | 14 | 48 | 1958 | 6.69 | 763 | 765 | 178.3 |
| D | 13 | 239 | 59676 | 316.64 | 769 | 747 | 186.1 |
| D | 2 | 136 | 46852 | 247.73 | 769 | 747 | 186.1 |
| D | 13 | 223 | 37049 | 195.06 | 769 | 747 | 186.1 |
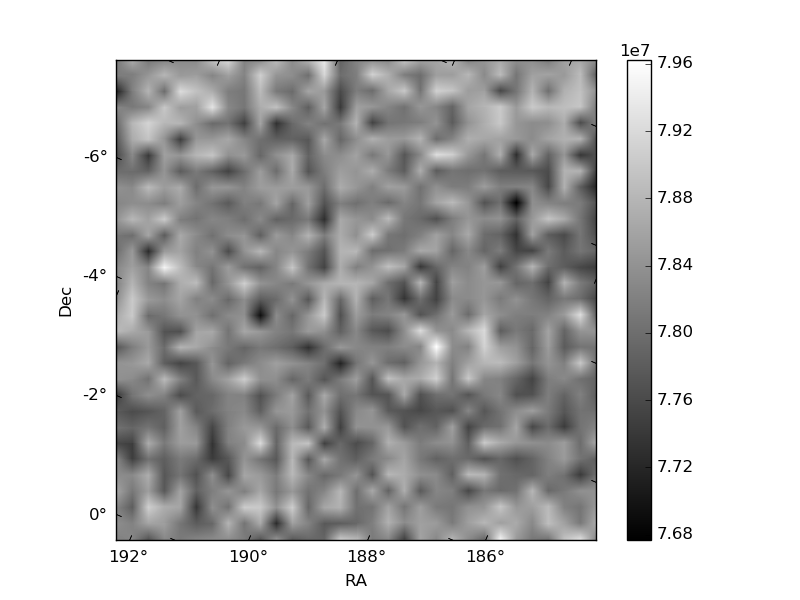
Histogram calculated using DETX and DETY for each event in the final _common_clean file
| Quadrant A | 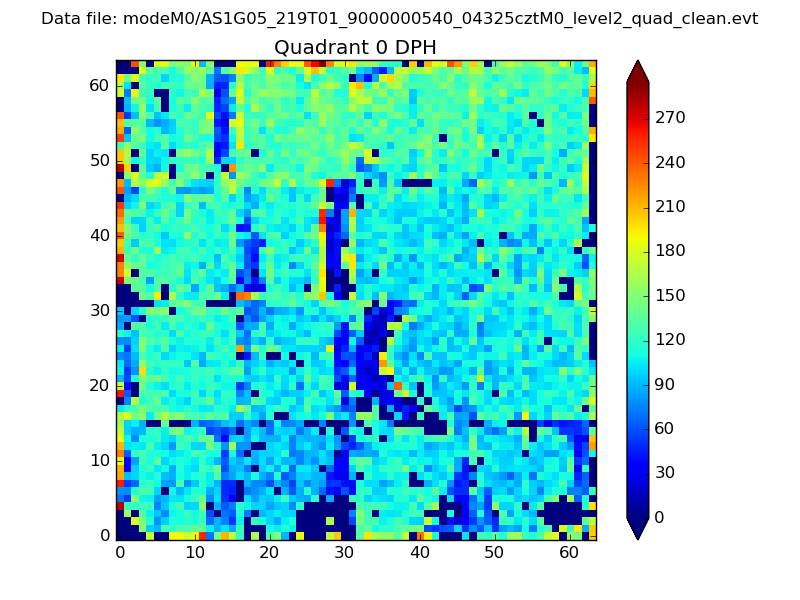 |
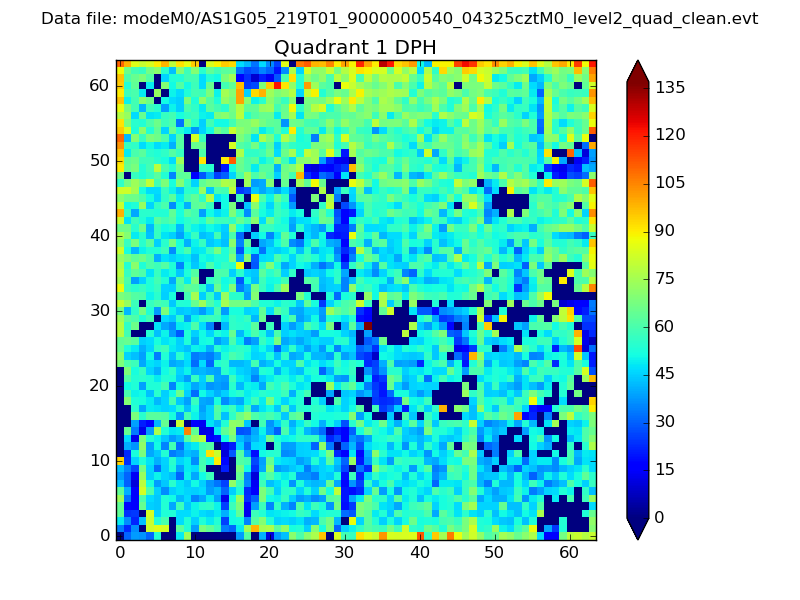 |
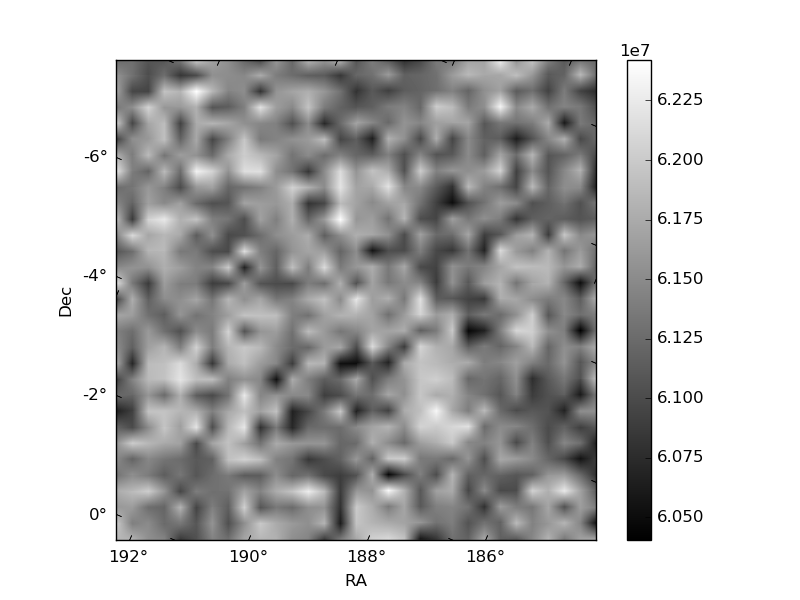
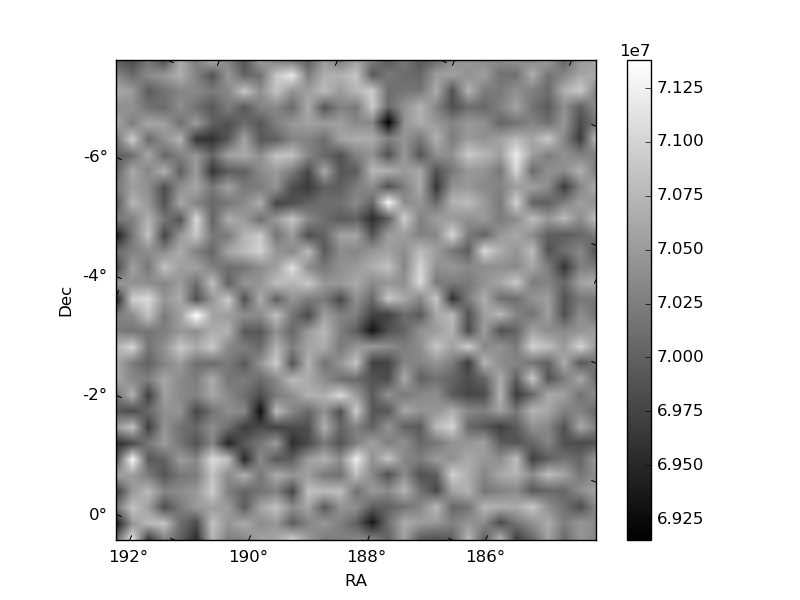
Quadrant B |
|---|---|---|---|
| Quadrant D | 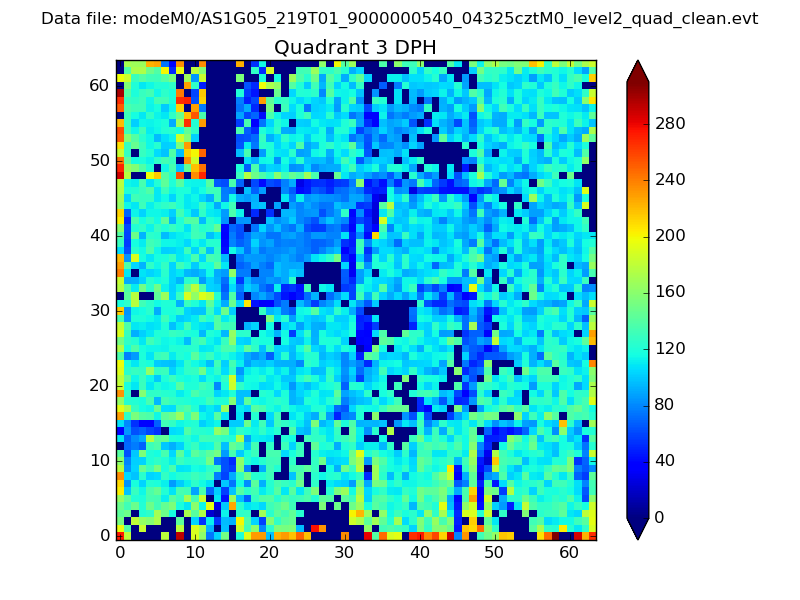 |
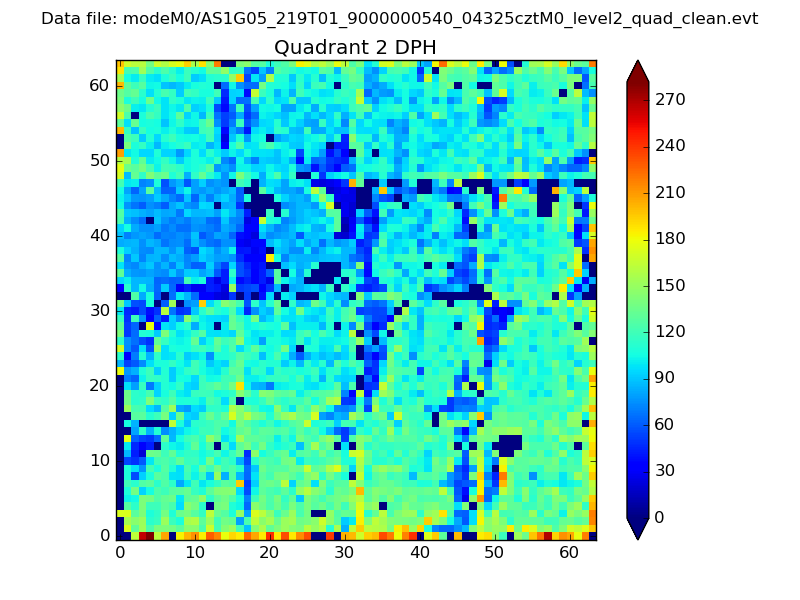 |
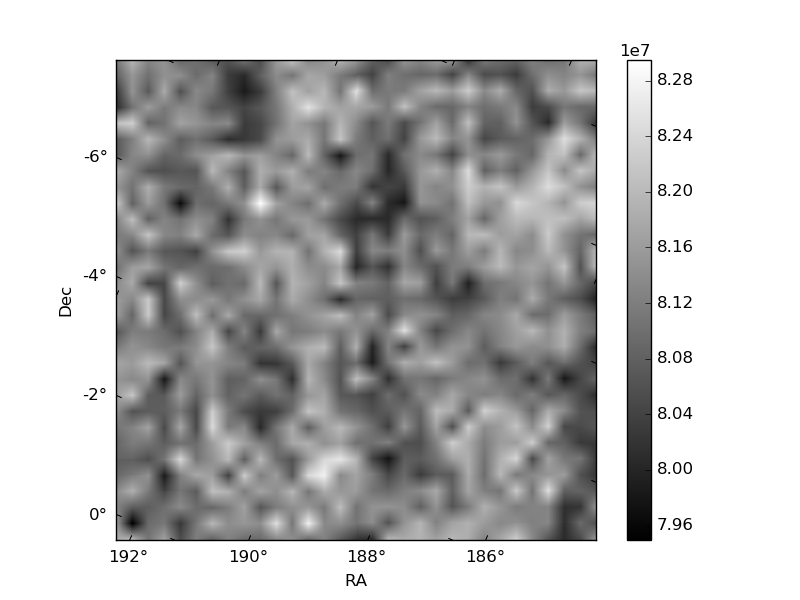
Quadrant C |
| Plot type | Count rate plots | Images |
|---|---|---|
| Comparison with Poisson distribution Blue bars denote a histogram of data divided into 1 sec bins. Red curve is a Poisson curve with rate = median count rate of data. |
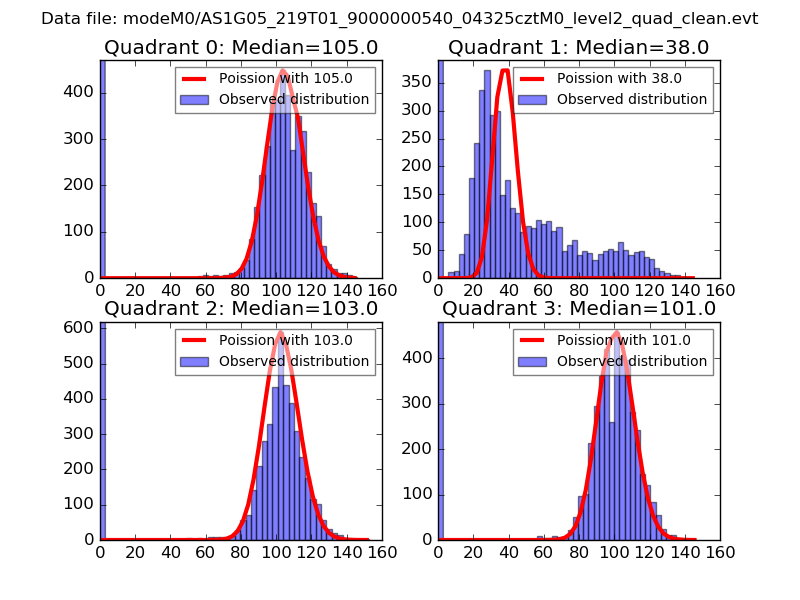 |
 |
| Quadrant-wise count rates Data is divided into 100 sec bins |
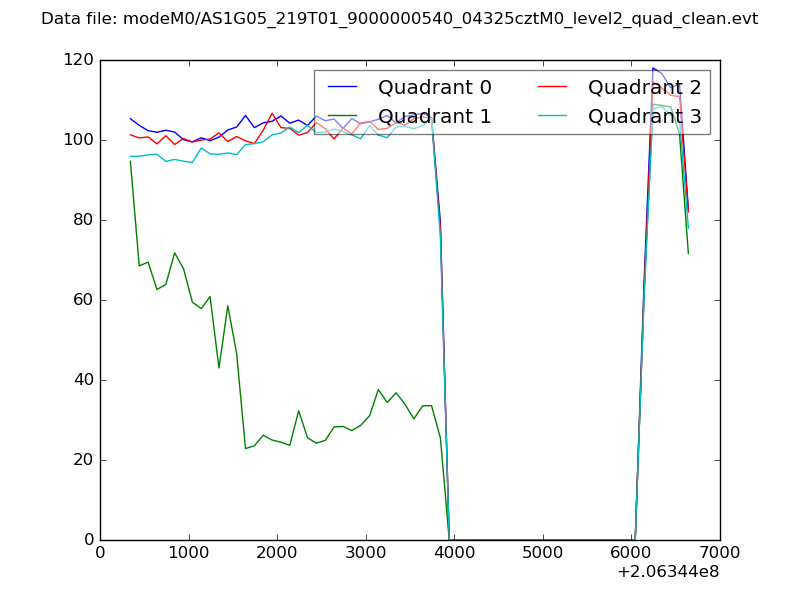 |
|
| Module-wise count rates for Quadrant A Data is divided into 100 sec bins |
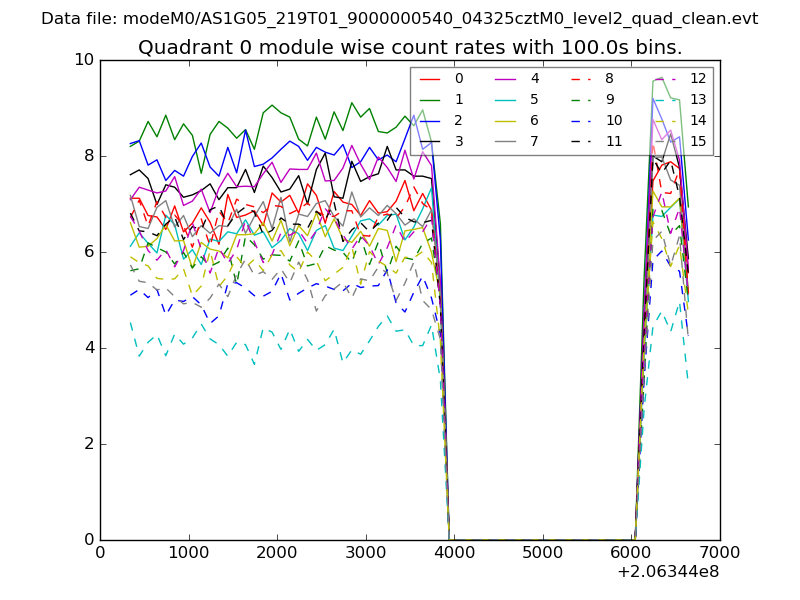 |
 |
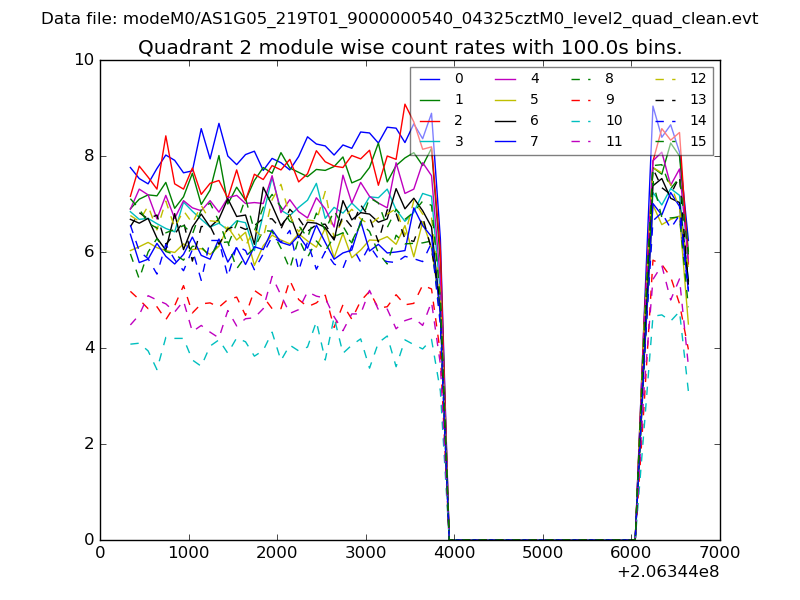
| Module-wise count rates for Quadrant B Data is divided into 100 sec bins |
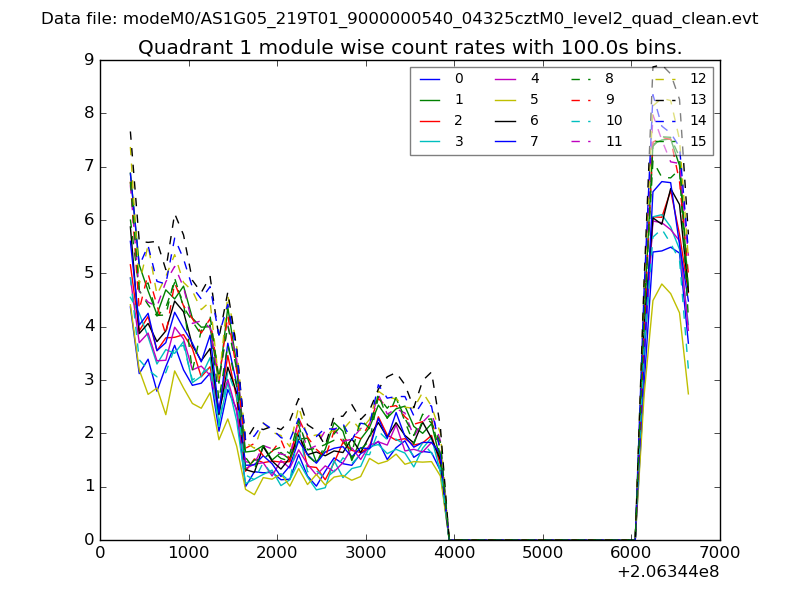 |
 |
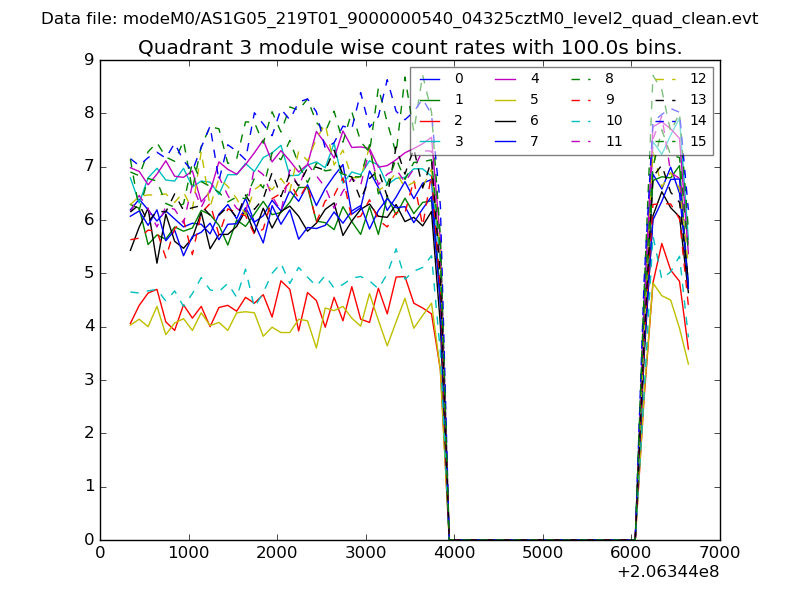
| Module-wise count rates for Quadrant C Data is divided into 100 sec bins |
 |
 |
| Module-wise count rates for Quadrant D Data is divided into 100 sec bins |
 |
 |
| Parameter | Plot |
|---|---|
| CZT HV Monitor | 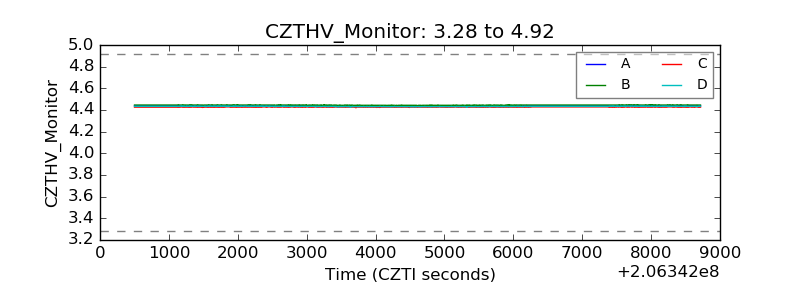 |
| D_VDD | 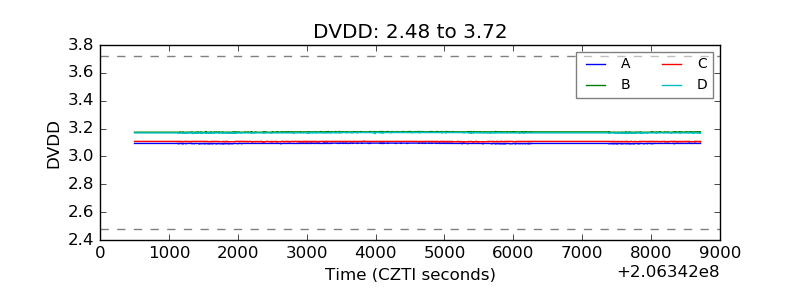 |
| Temperature 1 | 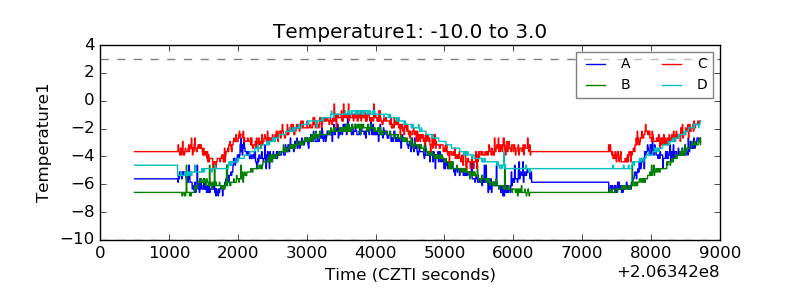 |
| Veto HV Monitor | 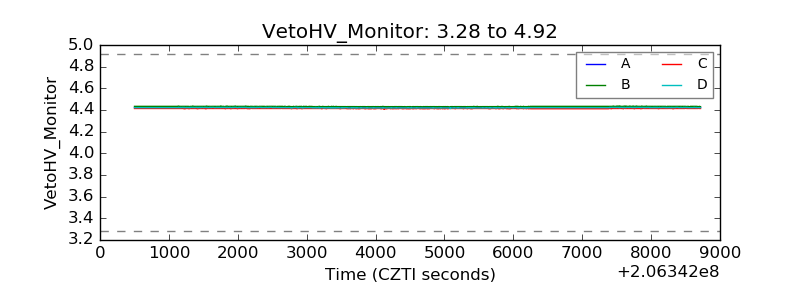 |
| Veto LLD | 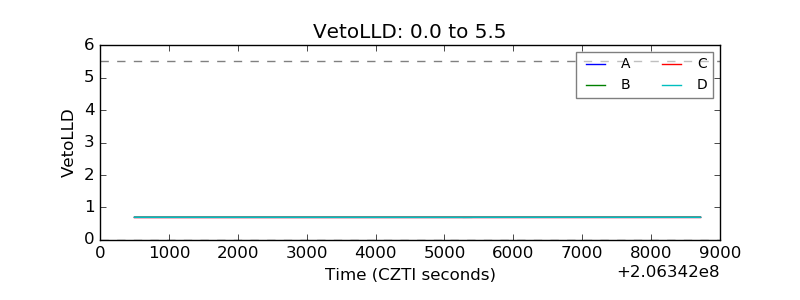 |
| Alpha Counter | 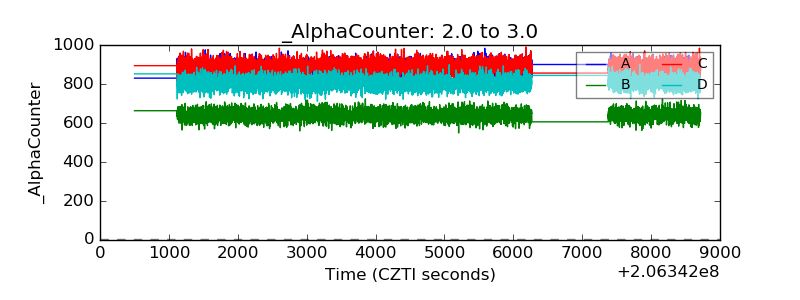 |
| _CPM_Rate | 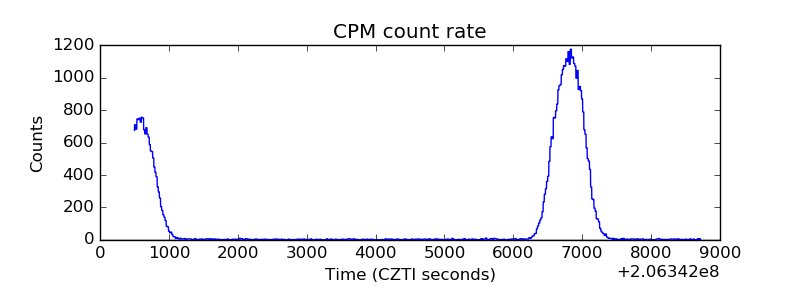 |
| CZT Counter | 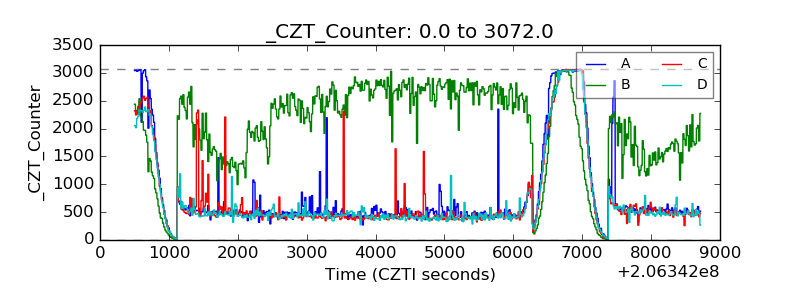 |
| +2.5 Volts monitor | 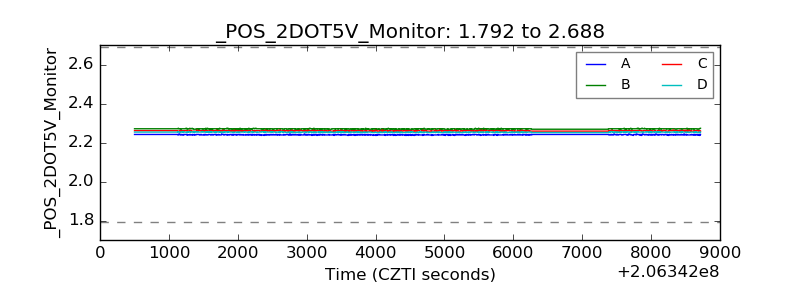 |
| +5 Volts monitor |  |
| _ROLL_ROT | 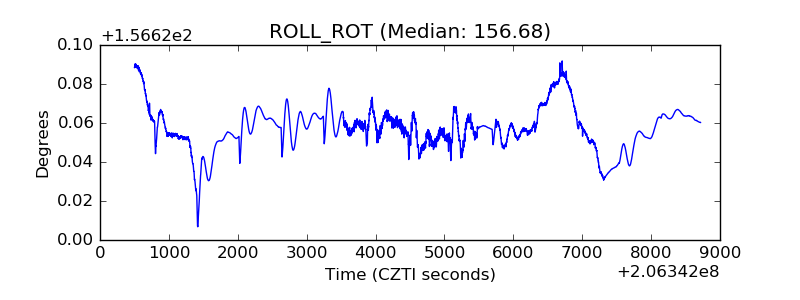 |
| _Roll_DEC | 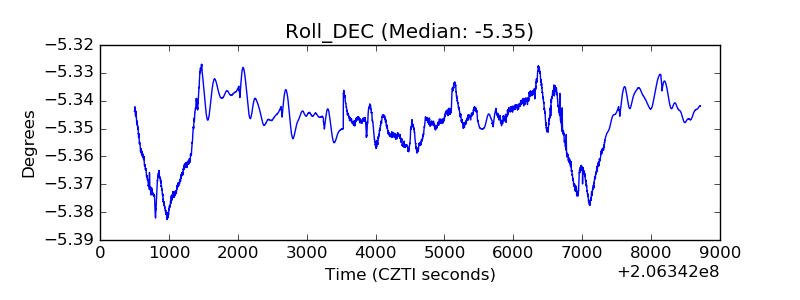 |
| _Roll_RA | 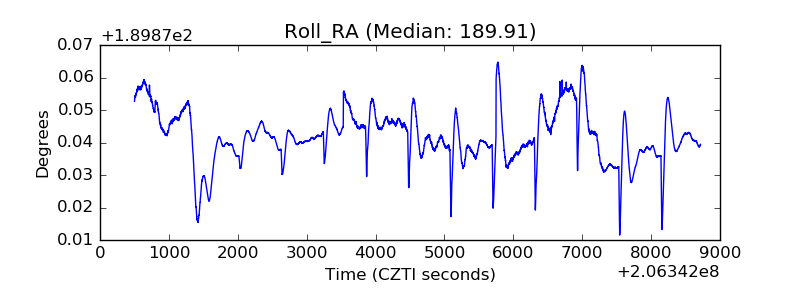 |
| Veto Counter | 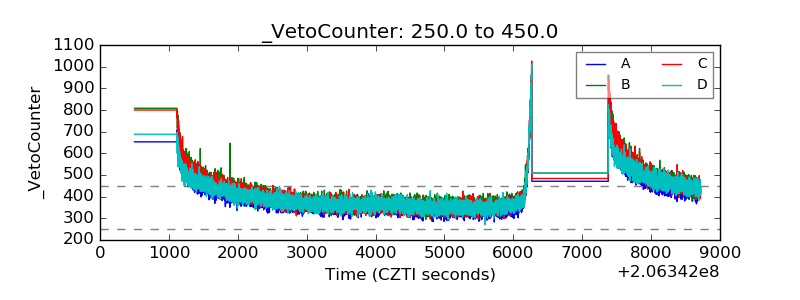 |