| Param | Original file | Final file |
|---|---|---|
| Filename | modeM0/AS1G05_219T01_9000000540_04326cztM0_level2.evt | modeM0/AS1G05_219T01_9000000540_04326cztM0_level2_quad_clean.evt |
| Size (bytes) | 811,774,080 | 73,028,160 |
| Size | 774.2 MB | 69.6 MB |
| Events in quadrant A | 3,263,180 | 515,815 |
| Events in quadrant B | 14,637,230 | 261,412 |
| Events in quadrant C | 3,062,466 | 502,412 |
| Events in quadrant D | 3,194,546 | 489,313 |
| Mode SS | |||
|---|---|---|---|
| Quadrant | BADHDUFLAG | Total packets | Discarded packets |
| A | 0 | 130 | 0 |
| B | 0 | 130 | 0 |
| C | 0 | 130 | 0 |
| D | 0 | 130 | 0 |
| Mode M9 | |||
|---|---|---|---|
| Quadrant | BADHDUFLAG | Total packets | Discarded packets |
| A | 0 | 12 | 0 |
| B | 0 | 12 | 0 |
| C | 0 | 12 | 0 |
| D | 0 | 12 | 0 |
| Mode M0 | |||
|---|---|---|---|
| Quadrant | BADHDUFLAG | Total packets | Discarded packets |
| A | 0 | 13479 | 2 |
| B | 0 | 47778 | 1 |
| C | 0 | 13266 | 1 |
| D | 0 | 13599 | 1 |
| Quadrant | Total seconds | Saturated seconds | Saturation percentage |
|---|---|---|---|
| A | 6304 | 79 | 1.253173% |
| B | 6304 | 5272 | 83.629442% |
| C | 6304 | 51 | 0.809010% |
| D | 6304 | 65 | 1.031091% |
Noise dominated data is calculated using 1-second bins in cleaned event files. If a bin has >2000 counts, and if more than 50% of those come from <1% of pixels, then it is considered to be noise-dominated and hence unusable.
| Quadrant | # 1 sec bins | Bins with >0 counts | Bins with >2000 counts | High rate bins dominated by noise | Noise dominated (total time) | Noise dominated (detector-on time) | Marked lightcurve |
|---|---|---|---|---|---|---|---|
| A | 7524 | 6304 | 2 | 2 | 0.03% | 0.03% | 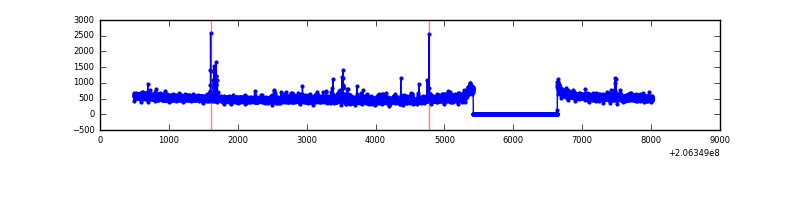 |
| B | 7523 | 6303 | 4884 | 4884 | 64.92% | 77.49% | 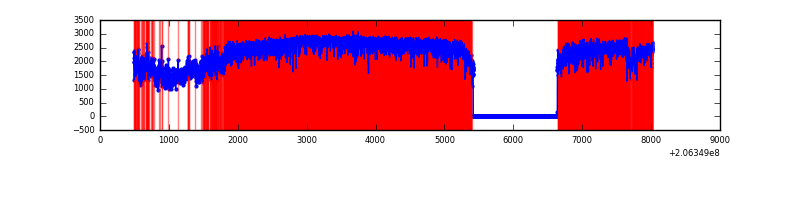 |
| C | 7524 | 6304 | 0 | 0 | 0.00% | 0.00% |  |
| D | 7523 | 6303 | 9 | 9 | 0.12% | 0.14% | 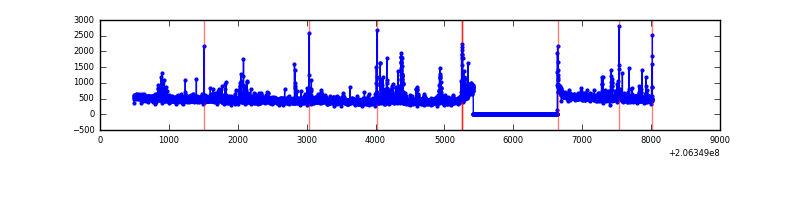 |
Top three noisy pixels from each quadrant. If the there are fewer than three noisy pixels in the level2.evt file, extra rows are filled as -1
| Pixel properties | Quadrant properties | ||||||
|---|---|---|---|---|---|---|---|
| Quadrant | DetID | PixID | Counts | Sigma | Mean | Median | Sigma |
| A | 14 | 111 | 88103 | 537.53 | 796 | 781 | 162.5 |
| A | 13 | 251 | 36569 | 220.3 | 796 | 781 | 162.5 |
| A | 13 | 14 | 34909 | 210.08 | 796 | 781 | 162.5 |
| B | 3 | 0 | 12578921 | 131338.67 | 503 | 492 | 95.8 |
| B | 8 | 3 | 42566 | 439.32 | 503 | 492 | 95.8 |
| B | 14 | 167 | 42172 | 435.21 | 503 | 492 | 95.8 |
| C | 9 | 247 | 90679 | 509.49 | 760 | 766 | 176.5 |
| C | 13 | 61 | 6373 | 31.77 | 760 | 766 | 176.5 |
| C | 9 | 16 | 4316 | 20.12 | 760 | 766 | 176.5 |
| D | 2 | 136 | 85449 | 464.09 | 765 | 744 | 182.5 |
| D | 13 | 239 | 51517 | 278.18 | 765 | 744 | 182.5 |
| D | 12 | 22 | 30960 | 165.55 | 765 | 744 | 182.5 |
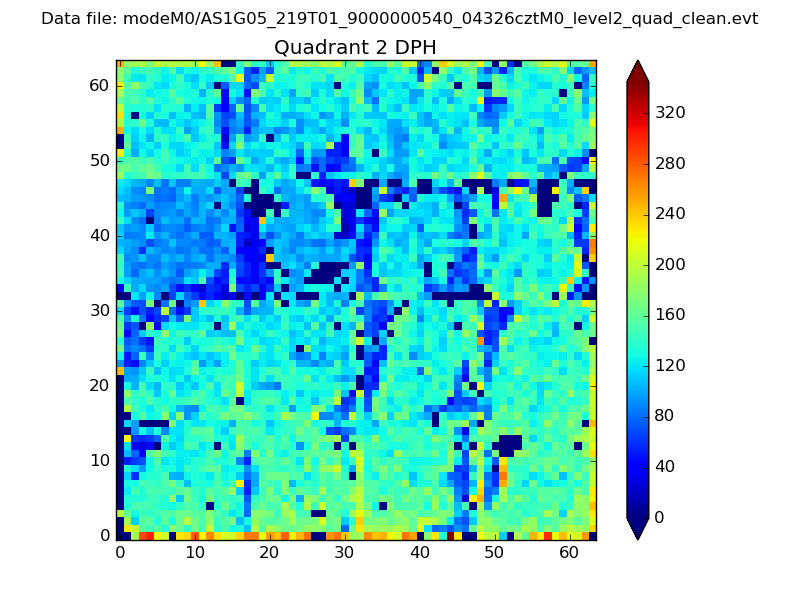
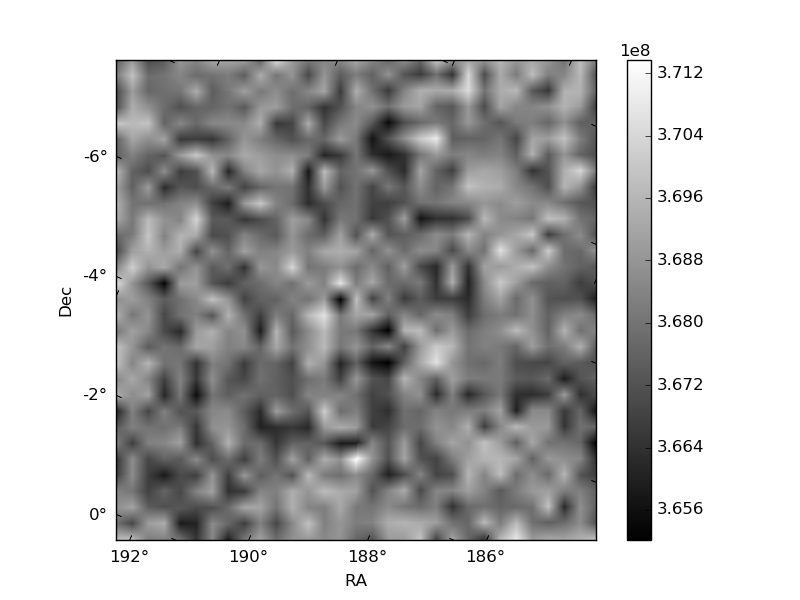
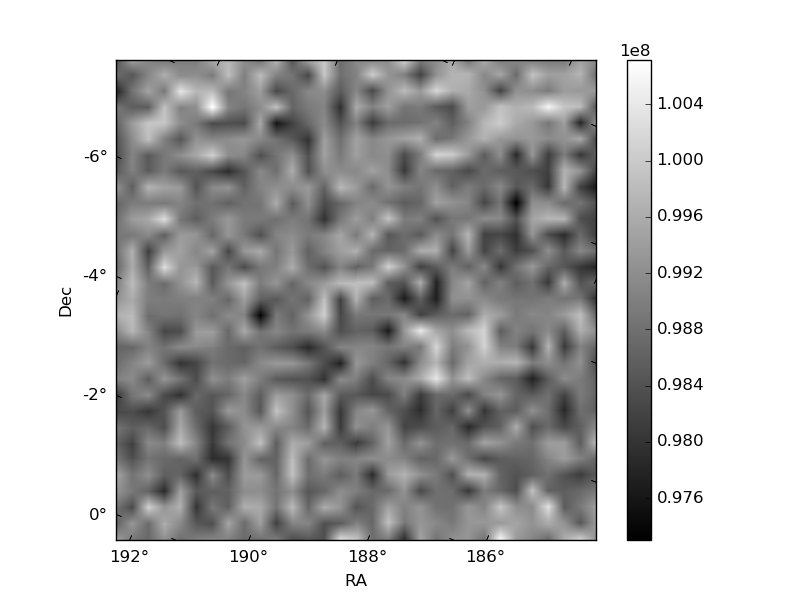
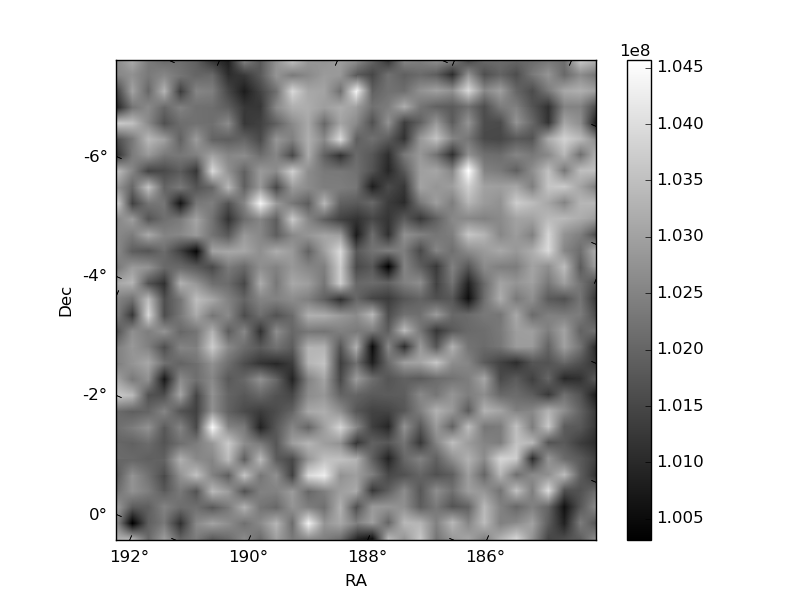
Histogram calculated using DETX and DETY for each event in the final _common_clean file
| Quadrant A | 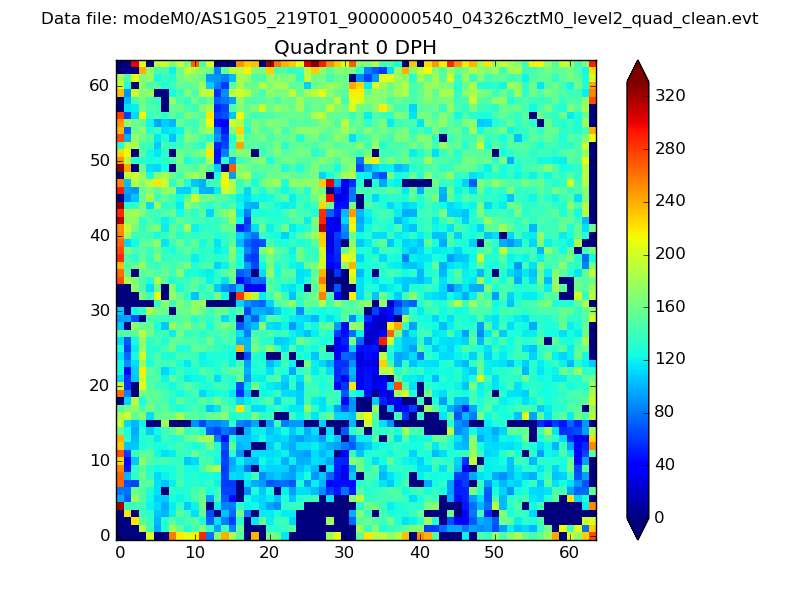 |
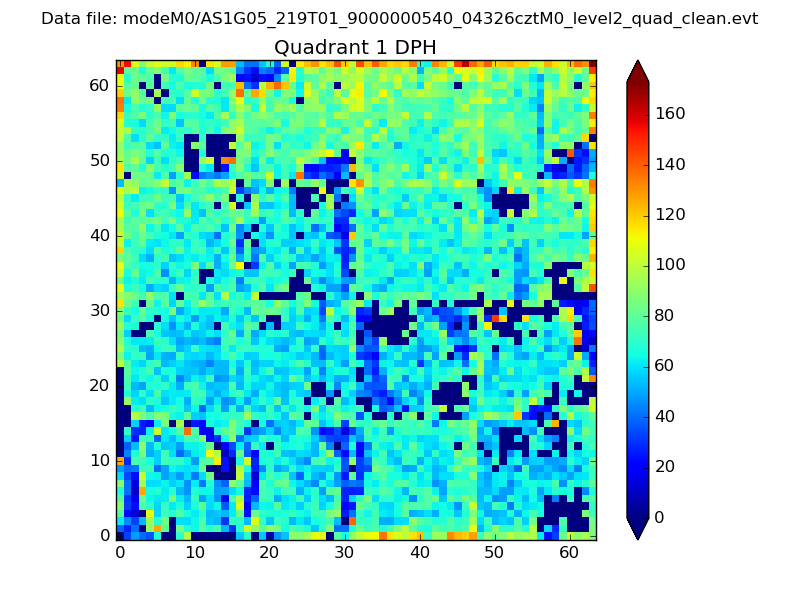 |
Quadrant B |
|---|---|---|---|
| Quadrant D | 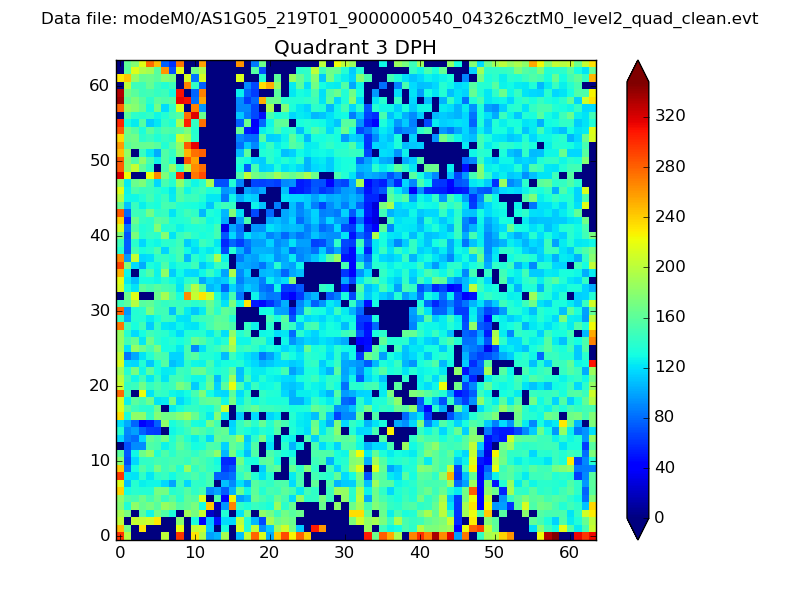 |
 |
Quadrant C |
| Plot type | Count rate plots | Images |
|---|---|---|
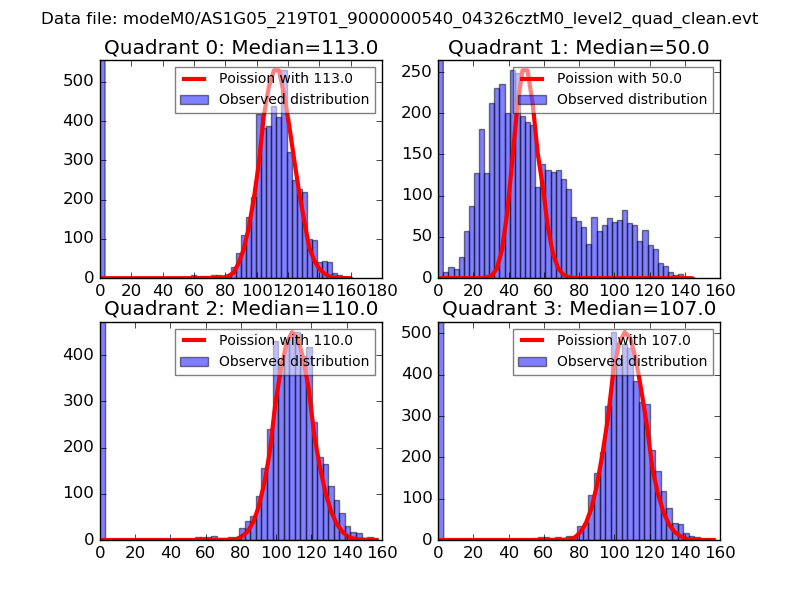
| Comparison with Poisson distribution Blue bars denote a histogram of data divided into 1 sec bins. Red curve is a Poisson curve with rate = median count rate of data. |
 |
 |
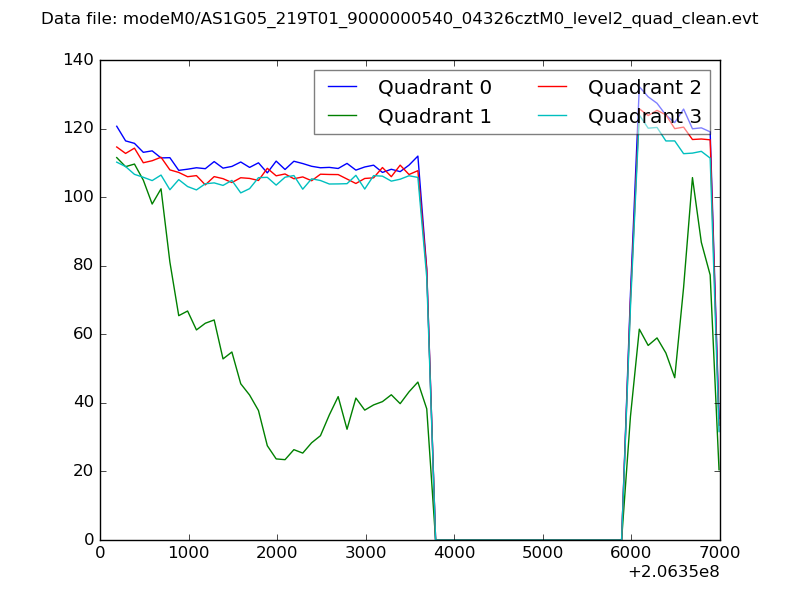
| Quadrant-wise count rates Data is divided into 100 sec bins |
 |
|
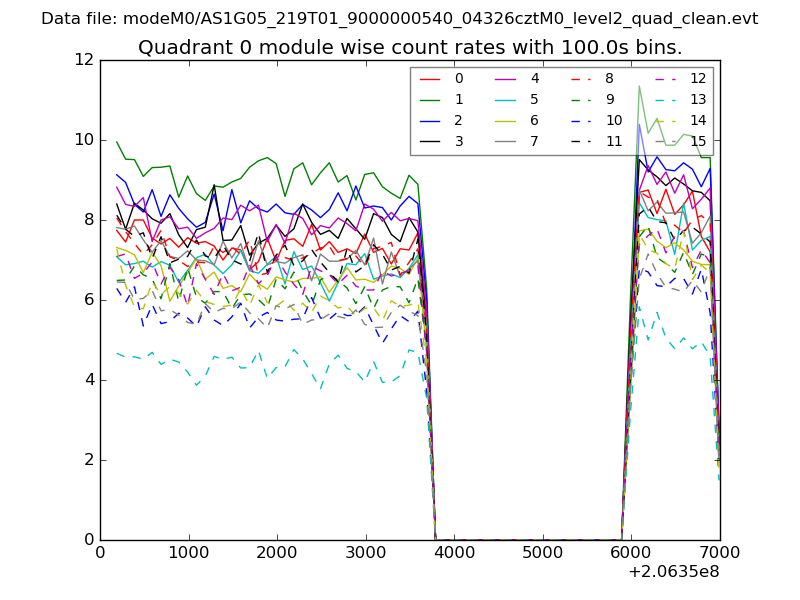
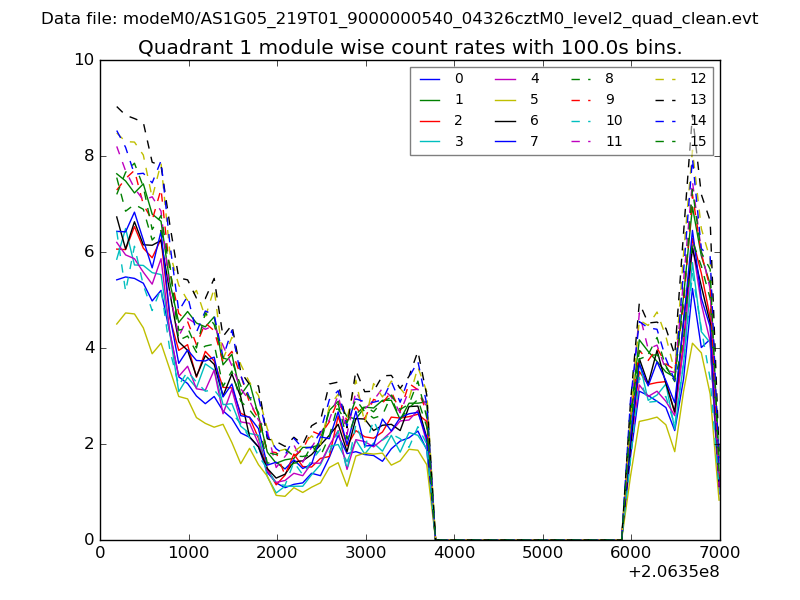
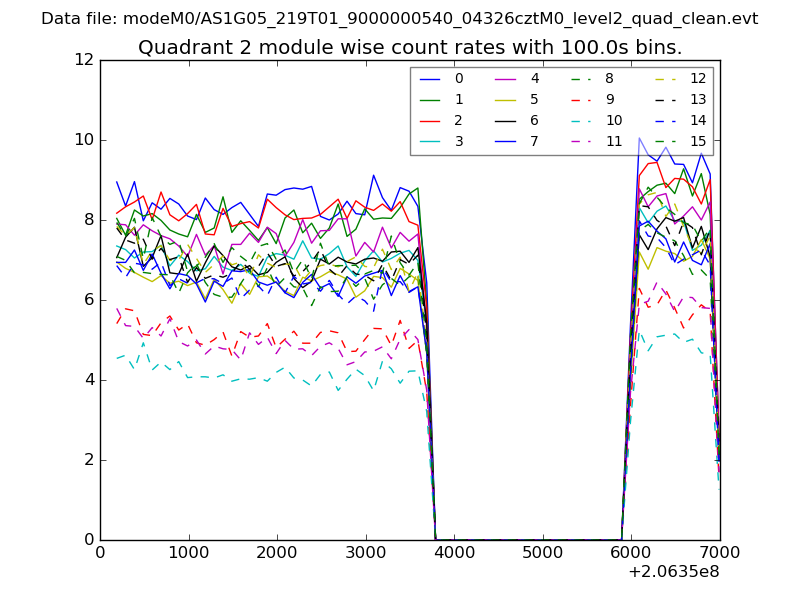
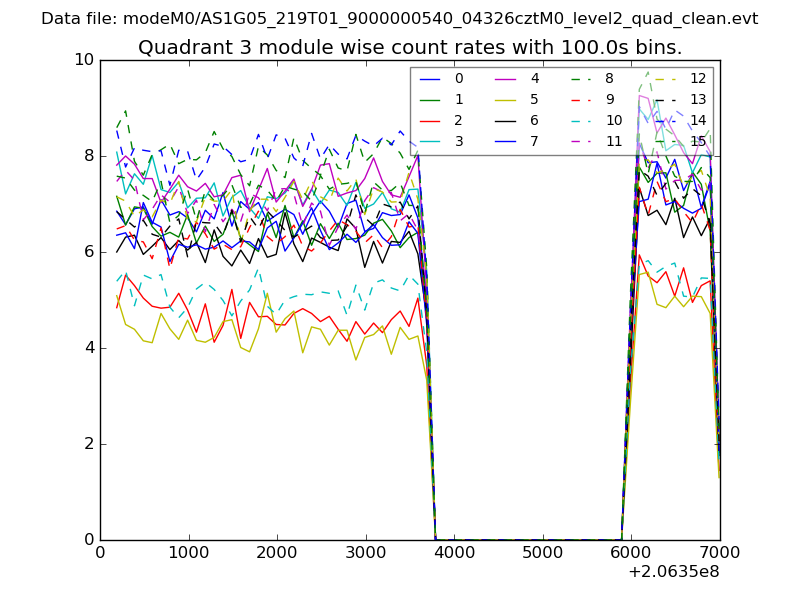
| Module-wise count rates for Quadrant A Data is divided into 100 sec bins |
 |
 |
| Module-wise count rates for Quadrant B Data is divided into 100 sec bins |
 |
 |
| Module-wise count rates for Quadrant C Data is divided into 100 sec bins |
 |
 |
| Module-wise count rates for Quadrant D Data is divided into 100 sec bins |
 |
 |
| Parameter | Plot |
|---|---|
| CZT HV Monitor | 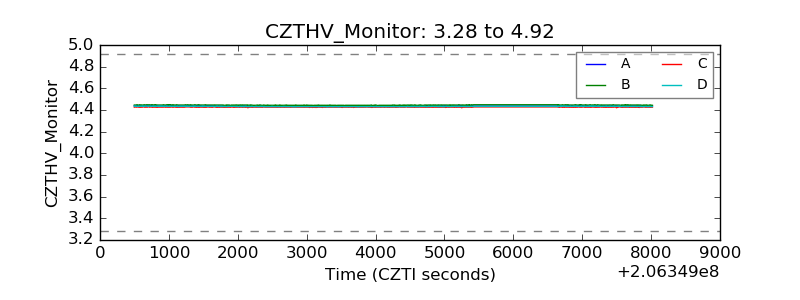 |
| D_VDD | 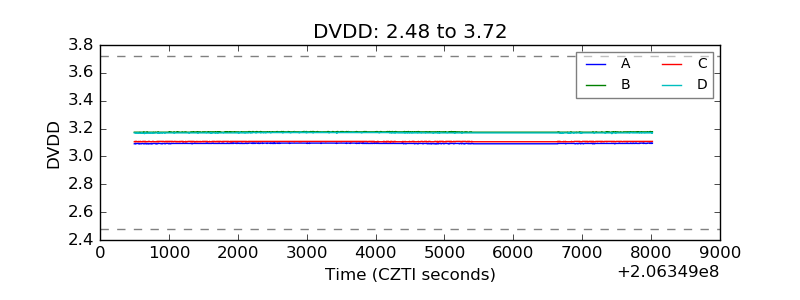 |
| Temperature 1 | 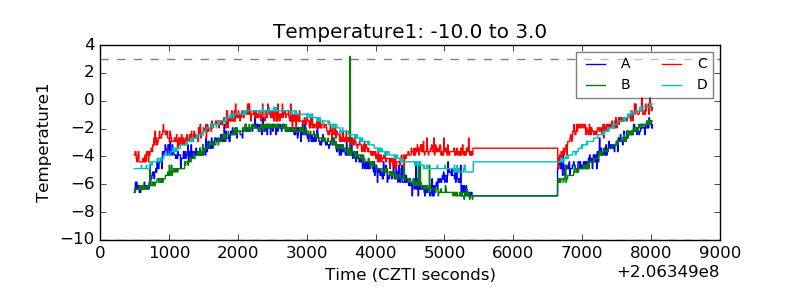 |
| Veto HV Monitor | 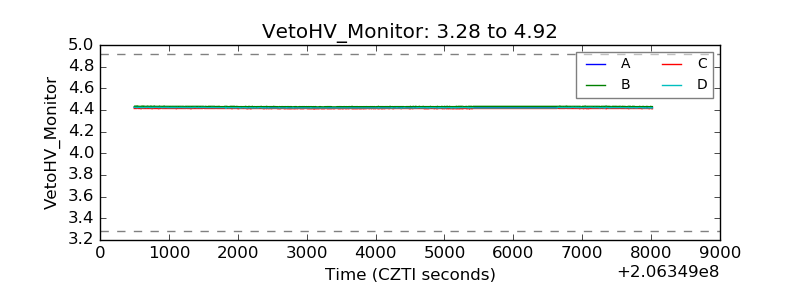 |
| Veto LLD | 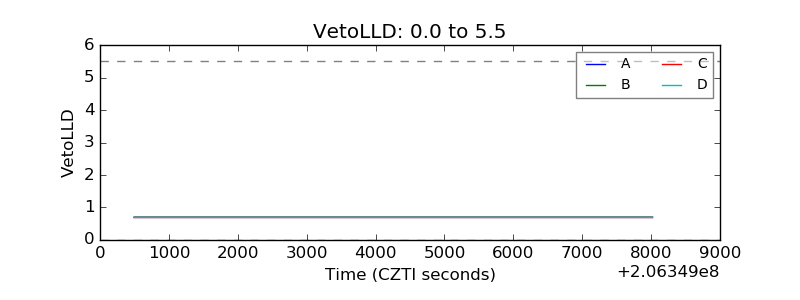 |
| Alpha Counter | 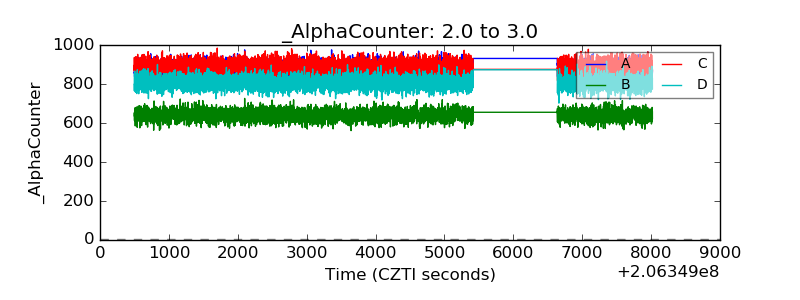 |
| _CPM_Rate | 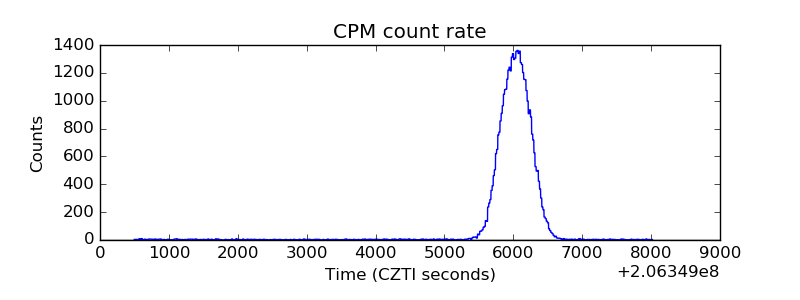 |
| CZT Counter | 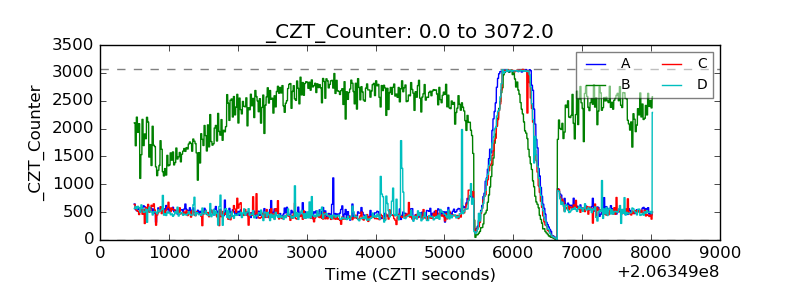 |
| +2.5 Volts monitor |  |
| +5 Volts monitor | 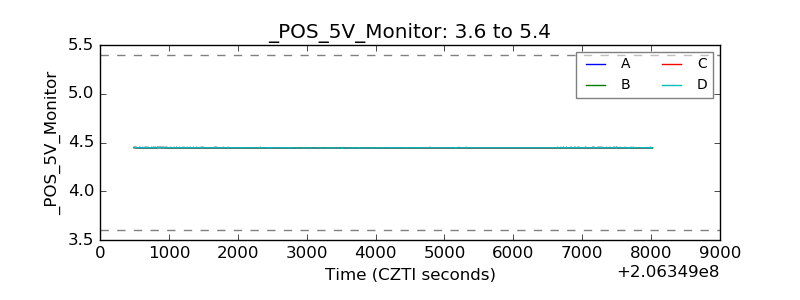 |
| _ROLL_ROT | 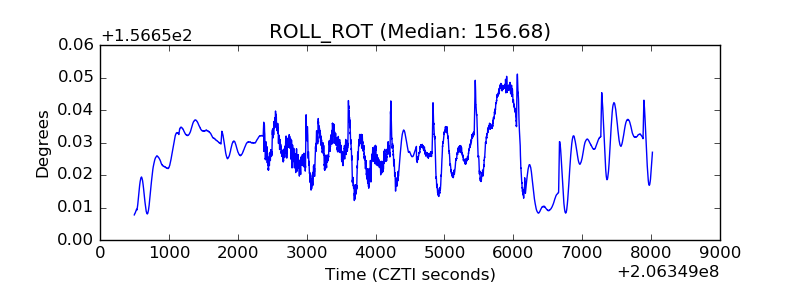 |
| _Roll_DEC | 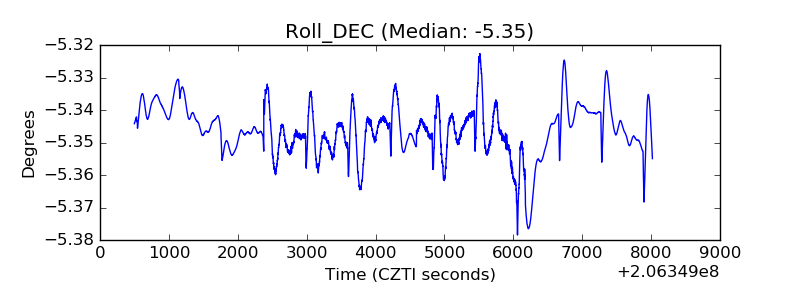 |
| _Roll_RA | 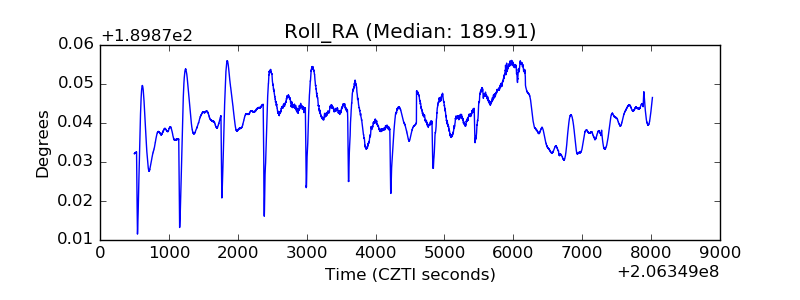 |
| Veto Counter | 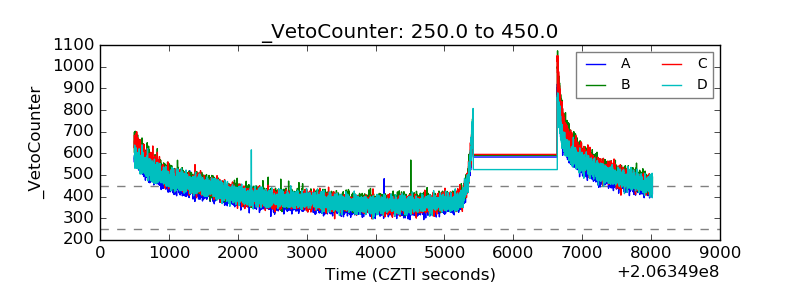 |