| Param | Original file | Final file |
|---|---|---|
| Filename | modeM0/AS1G05_219T01_9000000540_04327cztM0_level2.evt | modeM0/AS1G05_219T01_9000000540_04327cztM0_level2_quad_clean.evt |
| Size (bytes) | 810,489,600 | 87,226,560 |
| Size | 772.9 MB | 83.2 MB |
| Events in quadrant A | 3,367,732 | 627,752 |
| Events in quadrant B | 14,216,949 | 367,199 |
| Events in quadrant C | 3,077,111 | 605,748 |
| Events in quadrant D | 3,448,507 | 590,287 |
| Mode SS | |||
|---|---|---|---|
| Quadrant | BADHDUFLAG | Total packets | Discarded packets |
| A | 0 | 132 | 0 |
| B | 0 | 132 | 0 |
| C | 0 | 132 | 0 |
| D | 0 | 132 | 0 |
| Mode M9 | |||
|---|---|---|---|
| Quadrant | BADHDUFLAG | Total packets | Discarded packets |
| A | 0 | 12 | 0 |
| B | 0 | 12 | 0 |
| C | 0 | 12 | 0 |
| D | 0 | 12 | 0 |
| Mode M0 | |||
|---|---|---|---|
| Quadrant | BADHDUFLAG | Total packets | Discarded packets |
| A | 0 | 14032 | 2 |
| B | 0 | 46542 | 1 |
| C | 0 | 13368 | 1 |
| D | 0 | 14525 | 1 |
| Quadrant | Total seconds | Saturated seconds | Saturation percentage |
|---|---|---|---|
| A | 6423 | 122 | 1.899424% |
| B | 6423 | 5197 | 80.912346% |
| C | 6423 | 55 | 0.856298% |
| D | 6423 | 132 | 2.055114% |
Noise dominated data is calculated using 1-second bins in cleaned event files. If a bin has >2000 counts, and if more than 50% of those come from <1% of pixels, then it is considered to be noise-dominated and hence unusable.
| Quadrant | # 1 sec bins | Bins with >0 counts | Bins with >2000 counts | High rate bins dominated by noise | Noise dominated (total time) | Noise dominated (detector-on time) | Marked lightcurve |
|---|---|---|---|---|---|---|---|
| A | 7698 | 6423 | 29 | 29 | 0.38% | 0.45% | 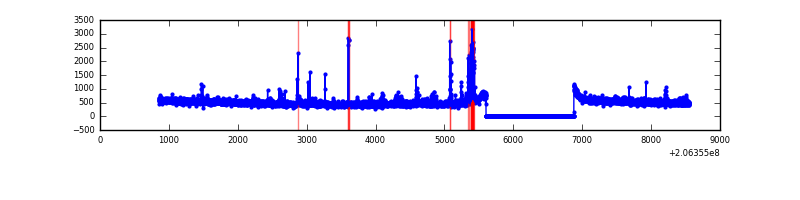 |
| B | 7697 | 6422 | 4768 | 4768 | 61.95% | 74.24% | 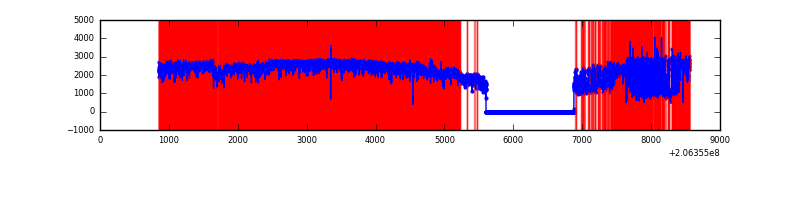 |
| C | 7698 | 6423 | 2 | 2 | 0.03% | 0.03% | 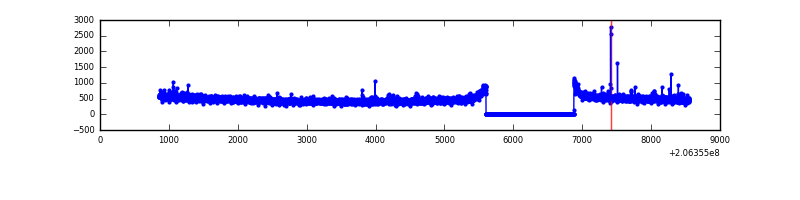 |
| D | 7698 | 6423 | 77 | 77 | 1.00% | 1.20% | 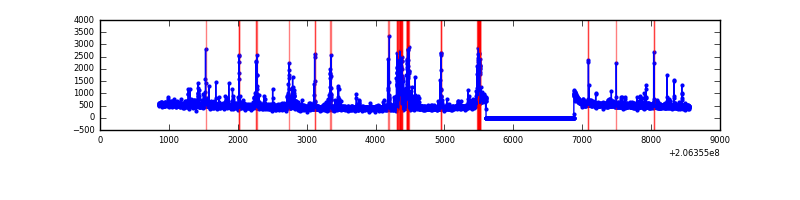 |
Top three noisy pixels from each quadrant. If the there are fewer than three noisy pixels in the level2.evt file, extra rows are filled as -1
| Pixel properties | Quadrant properties | ||||||
|---|---|---|---|---|---|---|---|
| Quadrant | DetID | PixID | Counts | Sigma | Mean | Median | Sigma |
| A | 13 | 251 | 139696 | 833.57 | 817 | 797 | 166.6 |
| A | 14 | 111 | 39196 | 230.44 | 817 | 797 | 166.6 |
| A | 8 | 15 | 31363 | 183.43 | 817 | 797 | 166.6 |
| B | 3 | 0 | 11734679 | 109447.0 | 569 | 557 | 107.2 |
| B | 14 | 167 | 92082 | 853.68 | 569 | 557 | 107.2 |
| B | 8 | 3 | 76293 | 706.41 | 569 | 557 | 107.2 |
| C | 10 | 65 | 19989 | 106.5 | 778 | 783 | 180.3 |
| C | 9 | 247 | 17440 | 92.37 | 778 | 783 | 180.3 |
| C | 13 | 61 | 6574 | 32.11 | 778 | 783 | 180.3 |
| D | 14 | 34 | 152912 | 809.73 | 782 | 761 | 187.9 |
| D | 2 | 136 | 86376 | 455.63 | 782 | 761 | 187.9 |
| D | 13 | 223 | 69932 | 368.12 | 782 | 761 | 187.9 |
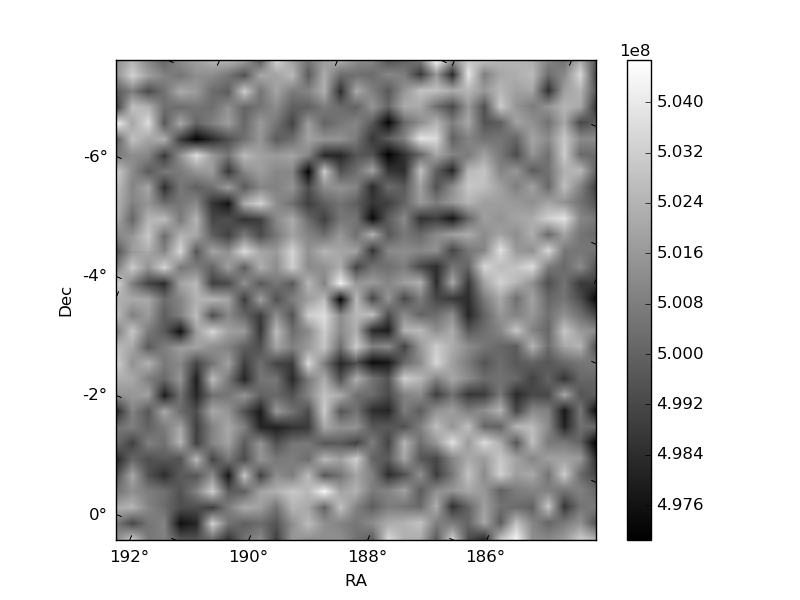
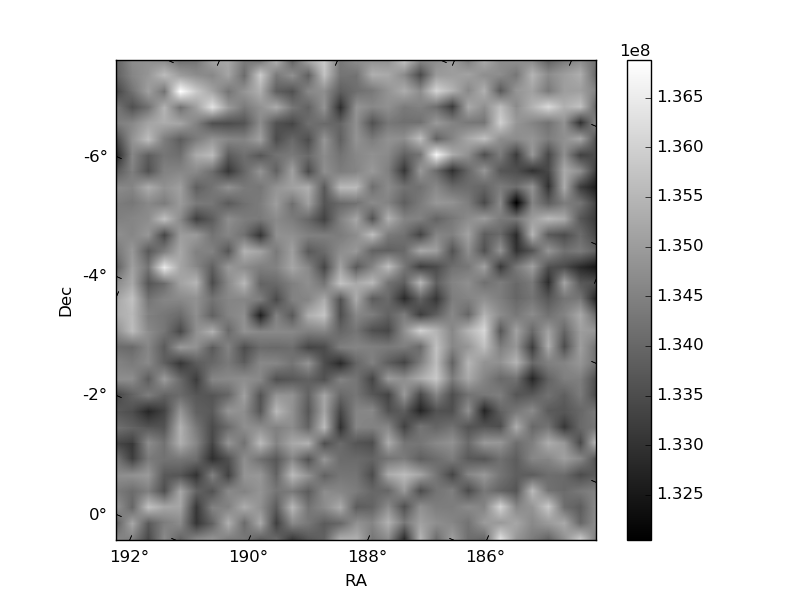
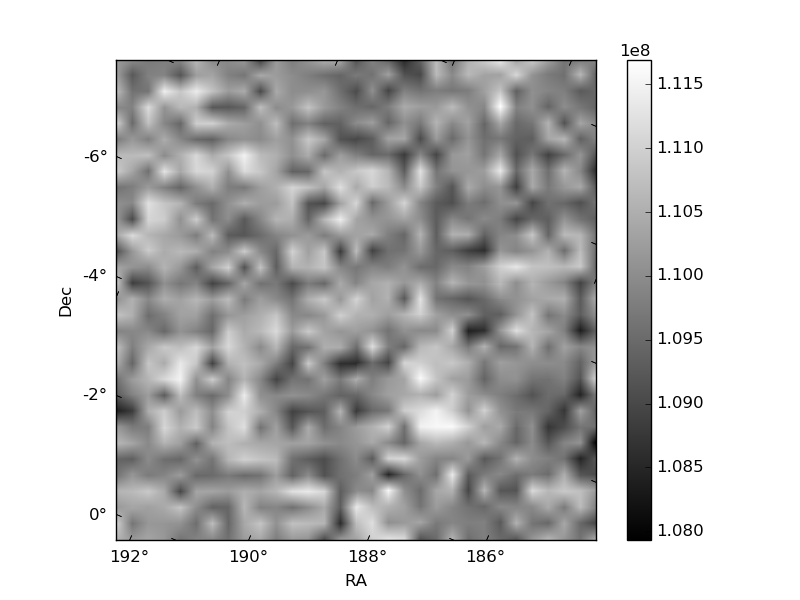
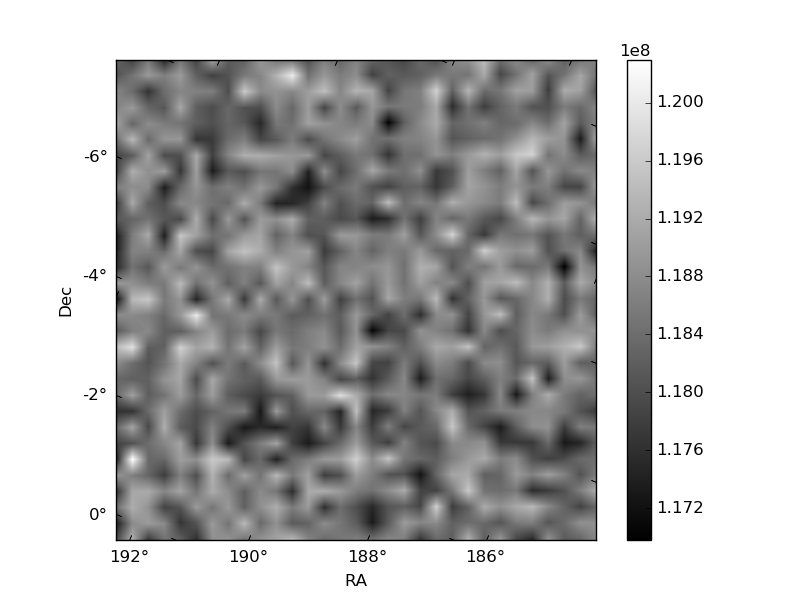
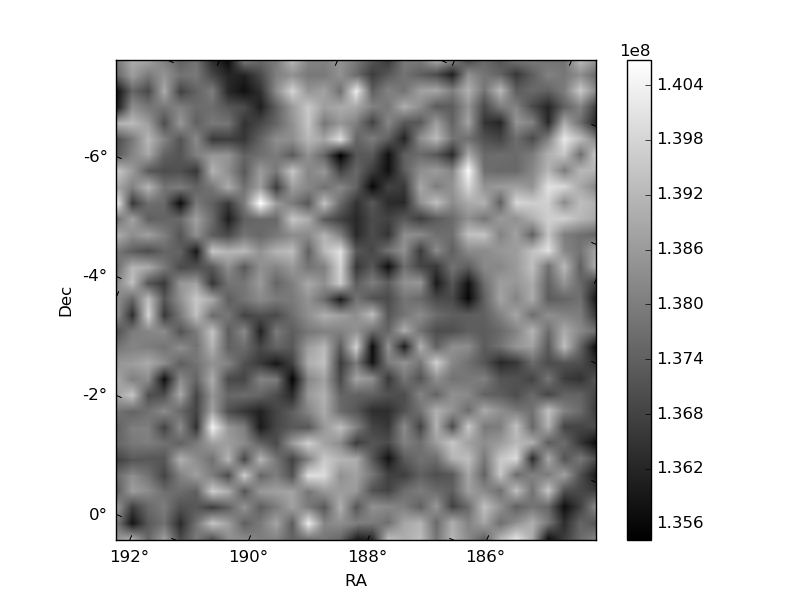
Histogram calculated using DETX and DETY for each event in the final _common_clean file
| Quadrant A | 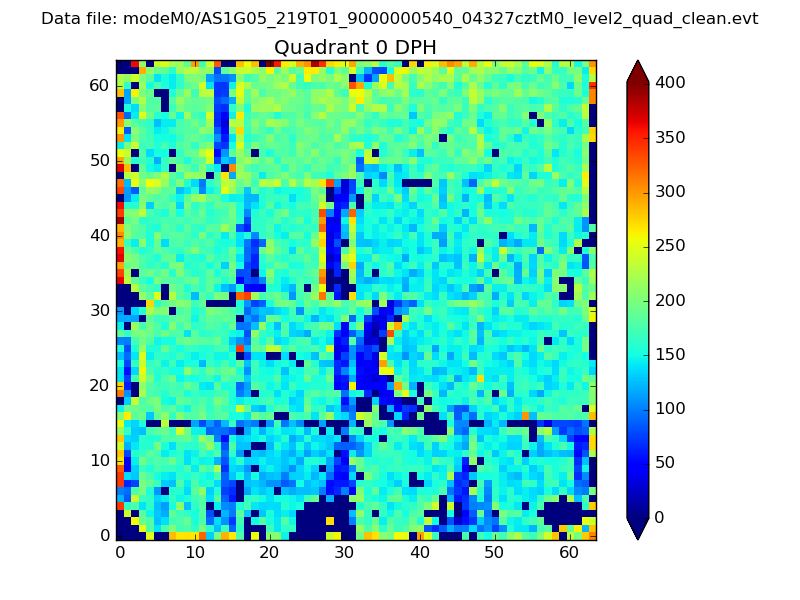 |
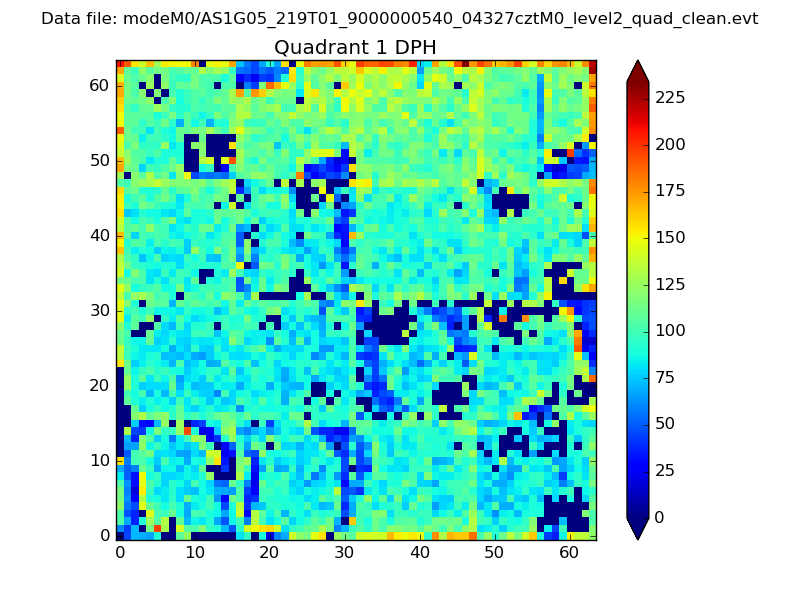 |
Quadrant B |
|---|---|---|---|
| Quadrant D | 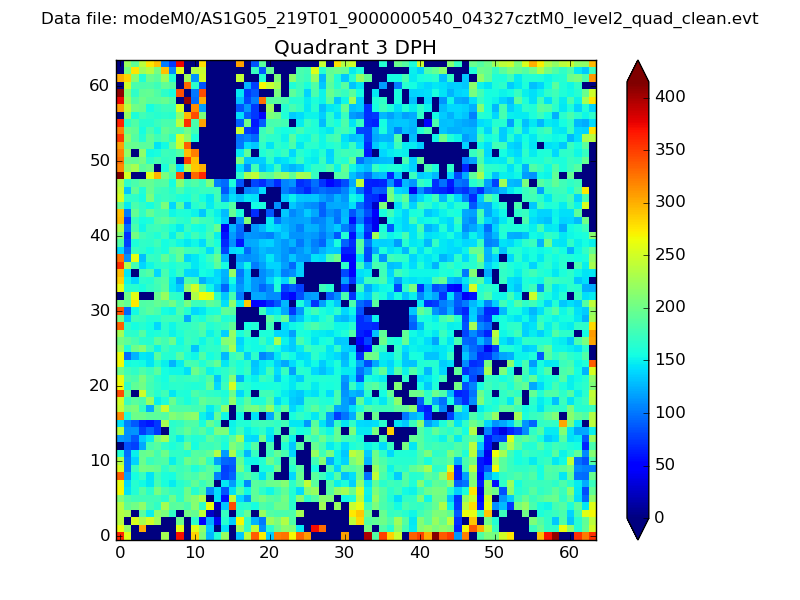 |
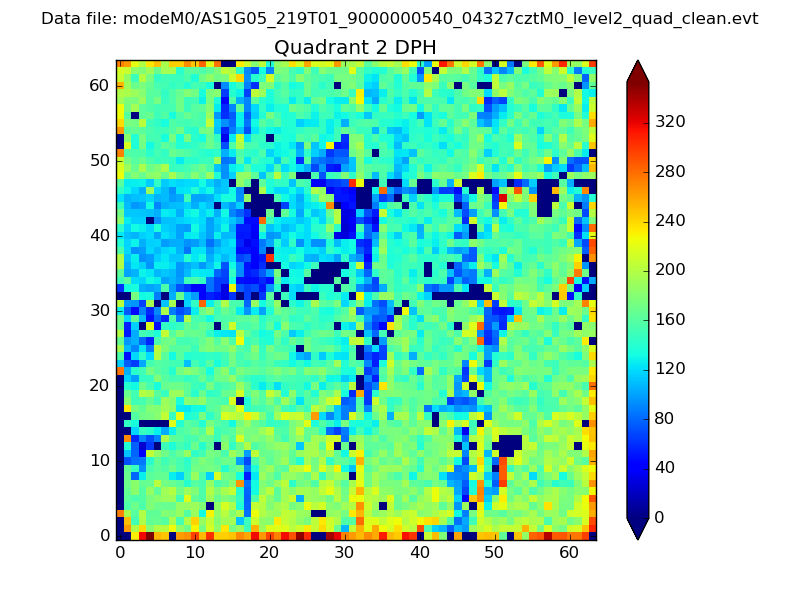 |
Quadrant C |
| Plot type | Count rate plots | Images |
|---|---|---|
| Comparison with Poisson distribution Blue bars denote a histogram of data divided into 1 sec bins. Red curve is a Poisson curve with rate = median count rate of data. |
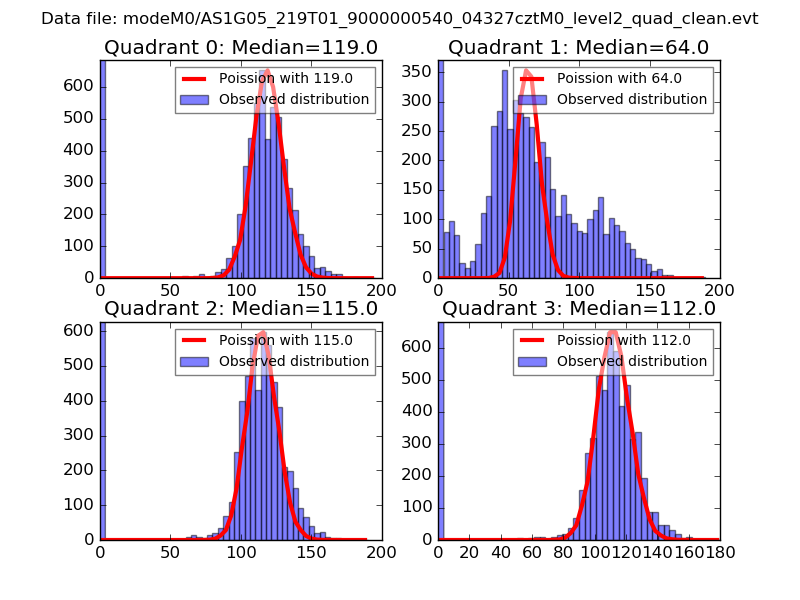 |
 |
| Quadrant-wise count rates Data is divided into 100 sec bins |
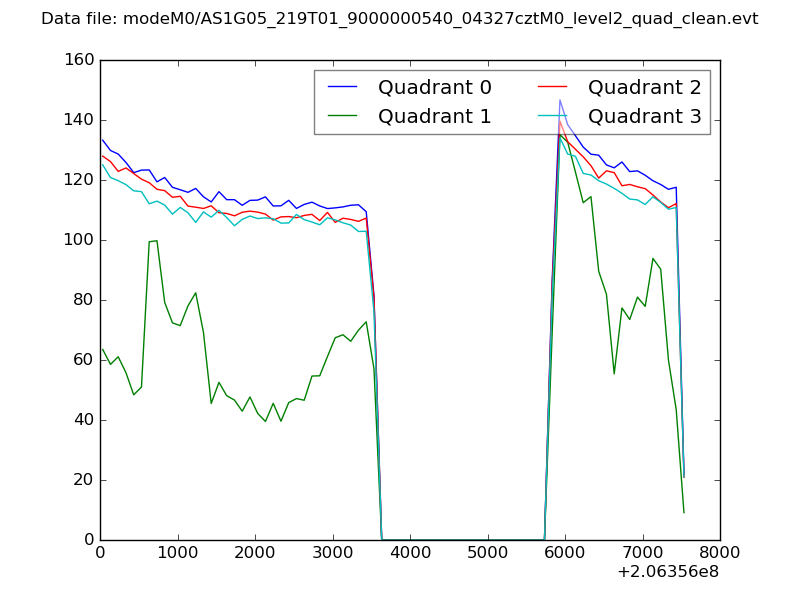 |
|
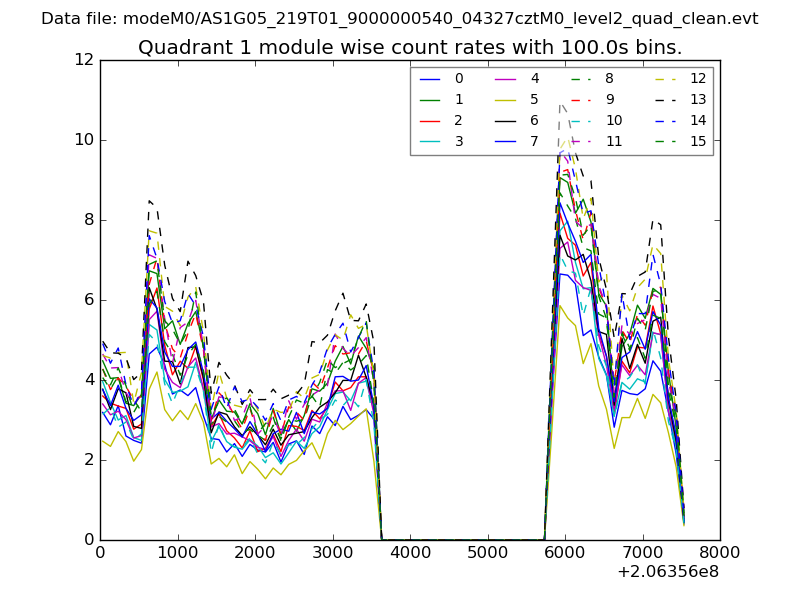
| Module-wise count rates for Quadrant A Data is divided into 100 sec bins |
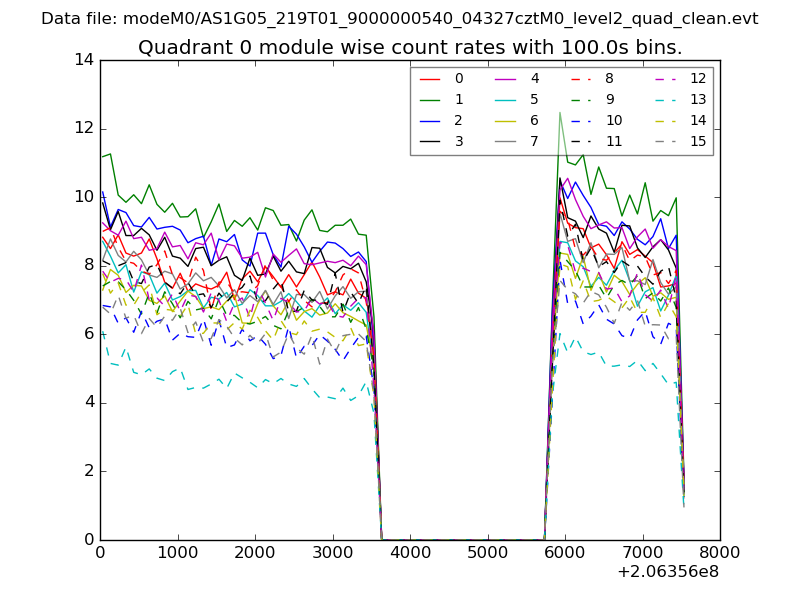 |
 |
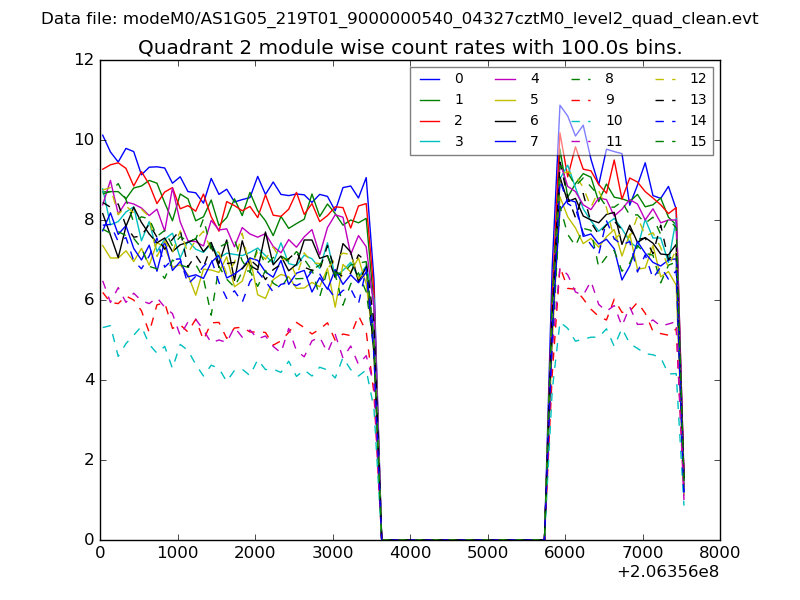
| Module-wise count rates for Quadrant B Data is divided into 100 sec bins |
 |
 |
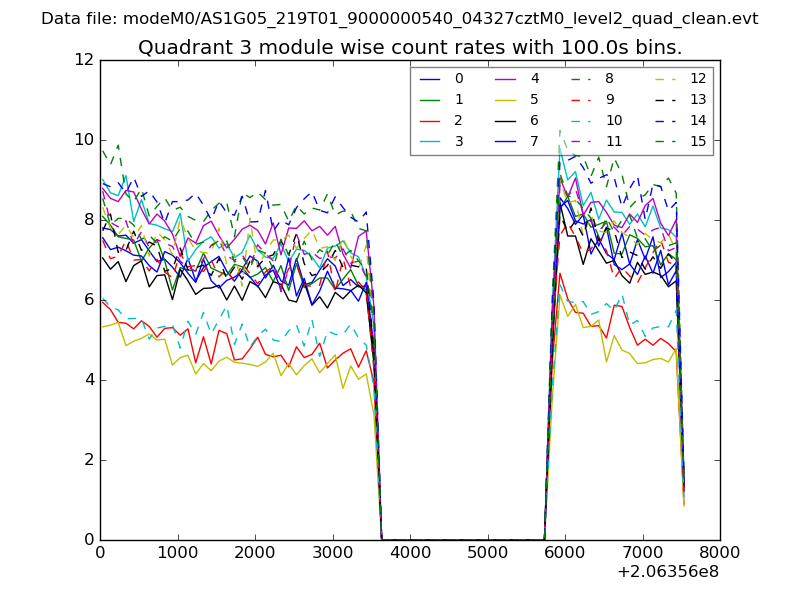
| Module-wise count rates for Quadrant C Data is divided into 100 sec bins |
 |
 |
| Module-wise count rates for Quadrant D Data is divided into 100 sec bins |
 |
 |
| Parameter | Plot |
|---|---|
| CZT HV Monitor | 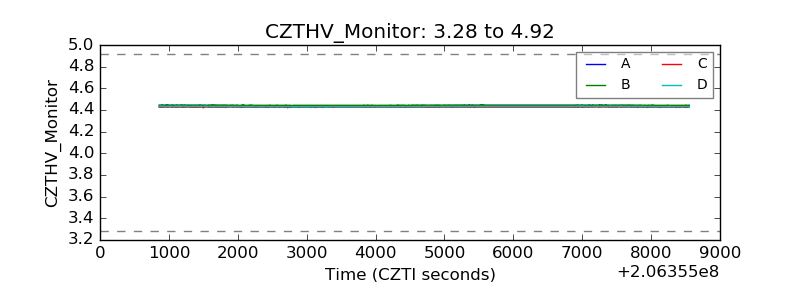 |
| D_VDD | 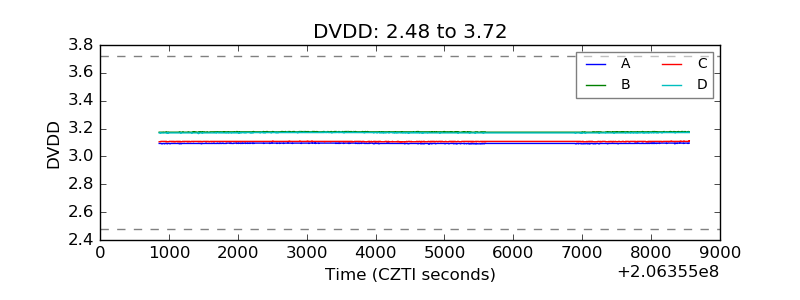 |
| Temperature 1 | 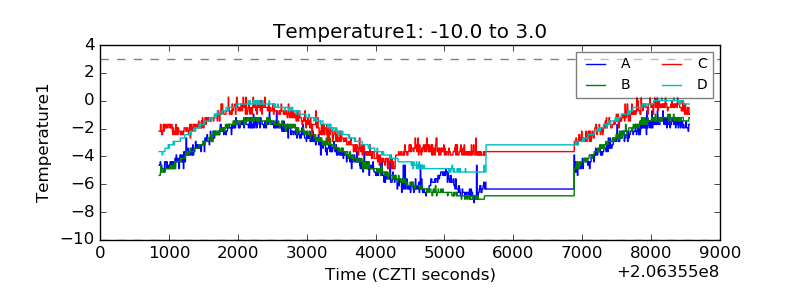 |
| Veto HV Monitor | 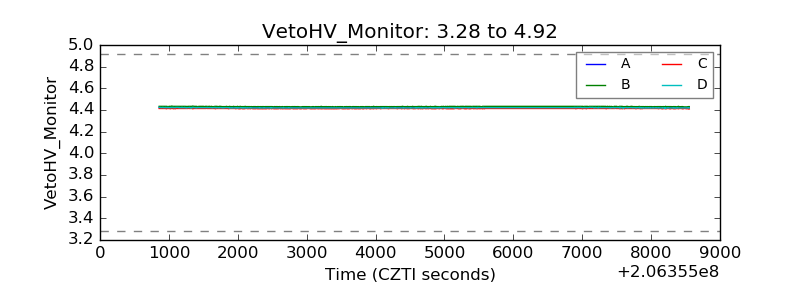 |
| Veto LLD | 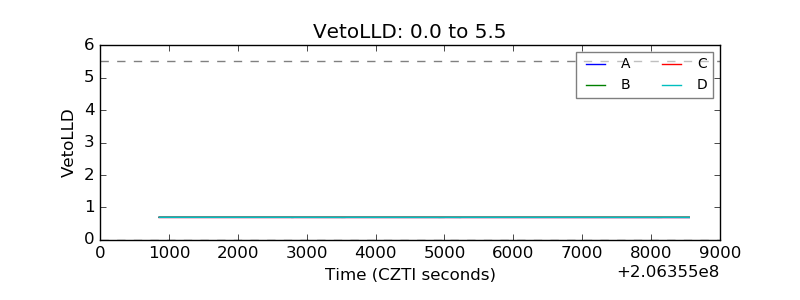 |
| Alpha Counter | 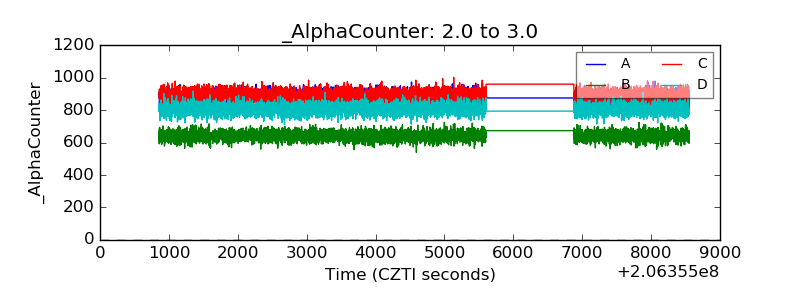 |
| _CPM_Rate | 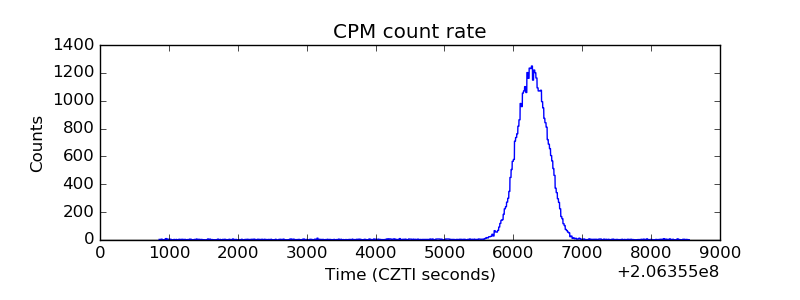 |
| CZT Counter | 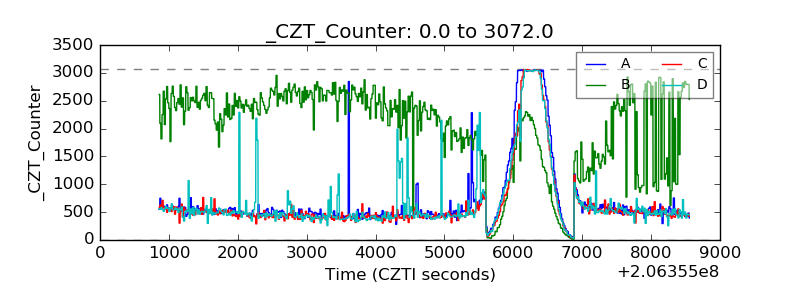 |
| +2.5 Volts monitor |  |
| +5 Volts monitor |  |
| _ROLL_ROT | 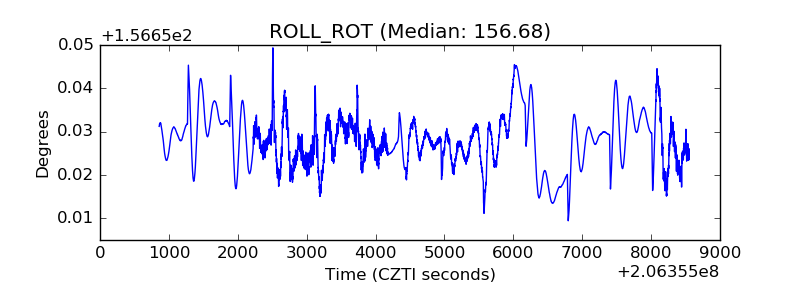 |
| _Roll_DEC | 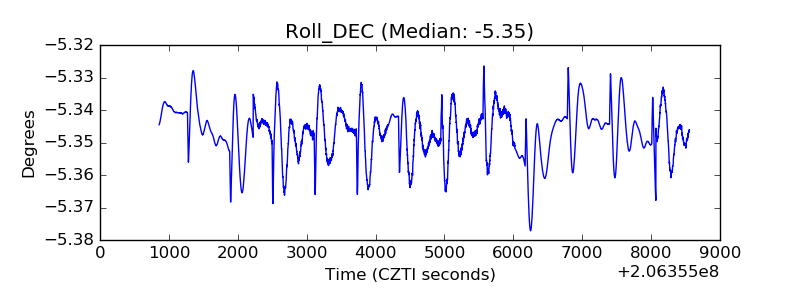 |
| _Roll_RA | 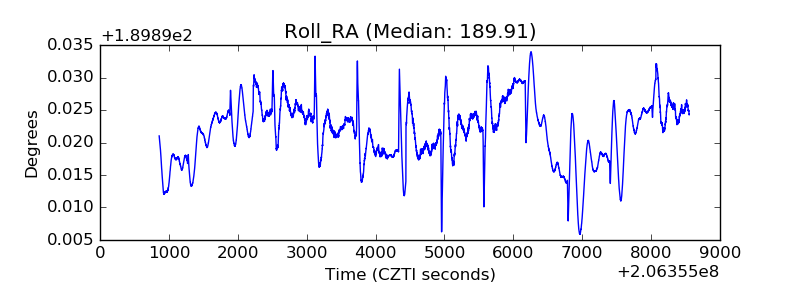 |
| Veto Counter | 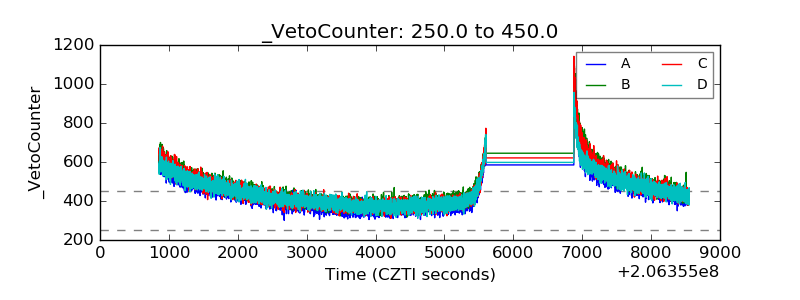 |