| Param | Original file | Final file |
|---|---|---|
| Filename | modeM0/AS1G05_219T01_9000000540_04329cztM0_level2.evt | modeM0/AS1G05_219T01_9000000540_04329cztM0_level2_quad_clean.evt |
| Size (bytes) | 619,165,440 | 78,710,400 |
| Size | 590.5 MB | 75.1 MB |
| Events in quadrant A | 3,226,343 | 507,721 |
| Events in quadrant B | 8,706,052 | 445,519 |
| Events in quadrant C | 3,124,406 | 492,987 |
| Events in quadrant D | 3,253,617 | 482,321 |
| Mode SS | |||
|---|---|---|---|
| Quadrant | BADHDUFLAG | Total packets | Discarded packets |
| A | 0 | 132 | 0 |
| B | 0 | 132 | 0 |
| C | 0 | 132 | 0 |
| D | 0 | 132 | 0 |
| Mode M9 | |||
|---|---|---|---|
| Quadrant | BADHDUFLAG | Total packets | Discarded packets |
| A | 0 | 11 | 0 |
| B | 0 | 11 | 0 |
| C | 0 | 11 | 0 |
| D | 0 | 11 | 0 |
| Mode M0 | |||
|---|---|---|---|
| Quadrant | BADHDUFLAG | Total packets | Discarded packets |
| A | 0 | 13917 | 2 |
| B | 0 | 30587 | 1 |
| C | 0 | 13901 | 1 |
| D | 0 | 14247 | 1 |
| Quadrant | Total seconds | Saturated seconds | Saturation percentage |
|---|---|---|---|
| A | 6518 | 136 | 2.086530% |
| B | 6518 | 1079 | 16.554158% |
| C | 6518 | 126 | 1.933108% |
| D | 6518 | 121 | 1.856398% |
Noise dominated data is calculated using 1-second bins in cleaned event files. If a bin has >2000 counts, and if more than 50% of those come from <1% of pixels, then it is considered to be noise-dominated and hence unusable.
| Quadrant | # 1 sec bins | Bins with >0 counts | Bins with >2000 counts | High rate bins dominated by noise | Noise dominated (total time) | Noise dominated (detector-on time) | Marked lightcurve |
|---|---|---|---|---|---|---|---|
| A | 7638 | 6518 | 7 | 7 | 0.09% | 0.11% | 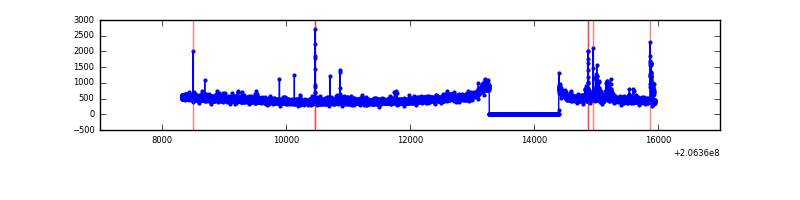 |
| B | 7638 | 6518 | 788 | 788 | 10.32% | 12.09% | 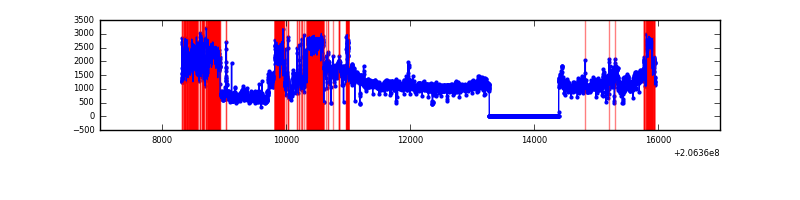 |
| C | 7638 | 6518 | 23 | 23 | 0.30% | 0.35% | 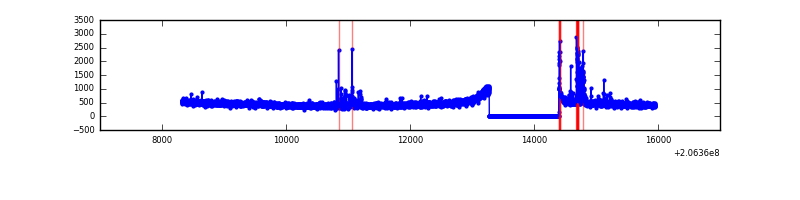 |
| D | 7638 | 6518 | 22 | 22 | 0.29% | 0.34% | 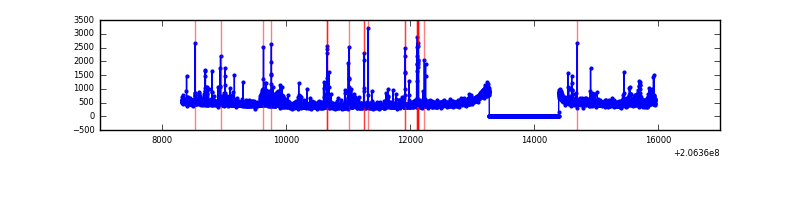 |
Top three noisy pixels from each quadrant. If the there are fewer than three noisy pixels in the level2.evt file, extra rows are filled as -1
| Pixel properties | Quadrant properties | ||||||
|---|---|---|---|---|---|---|---|
| Quadrant | DetID | PixID | Counts | Sigma | Mean | Median | Sigma |
| A | 13 | 251 | 78519 | 478.74 | 793 | 776 | 162.4 |
| A | 15 | 234 | 48150 | 291.73 | 793 | 776 | 162.4 |
| A | 0 | 247 | 18355 | 108.25 | 793 | 776 | 162.4 |
| B | 3 | 0 | 5318028 | 37012.75 | 750 | 733 | 143.7 |
| B | 15 | 204 | 216123 | 1499.29 | 750 | 733 | 143.7 |
| B | 8 | 3 | 102223 | 706.45 | 750 | 733 | 143.7 |
| C | 9 | 247 | 136762 | 760.03 | 759 | 764 | 178.9 |
| C | 9 | 16 | 19671 | 105.66 | 759 | 764 | 178.9 |
| C | 13 | 61 | 6335 | 31.13 | 759 | 764 | 178.9 |
| D | 2 | 136 | 84733 | 453.37 | 769 | 750 | 185.2 |
| D | 13 | 53 | 72817 | 389.05 | 769 | 750 | 185.2 |
| D | 10 | 172 | 60561 | 322.88 | 769 | 750 | 185.2 |
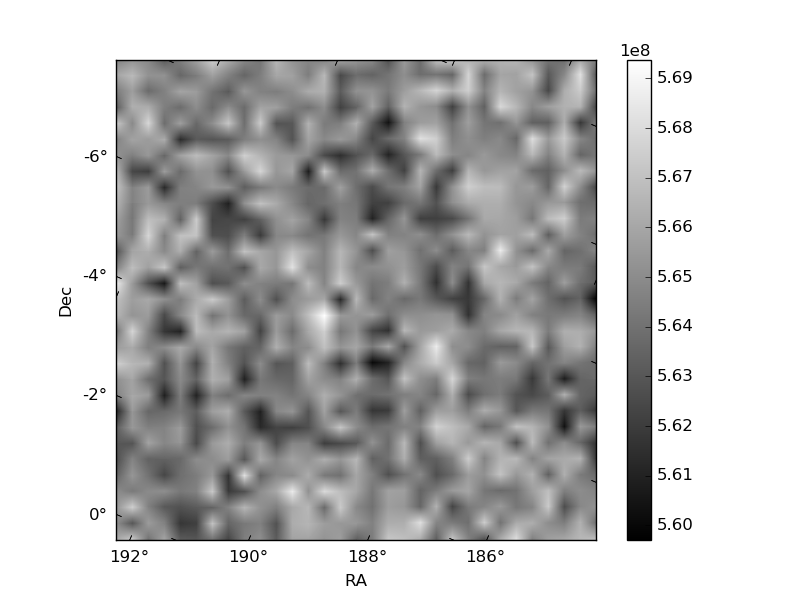
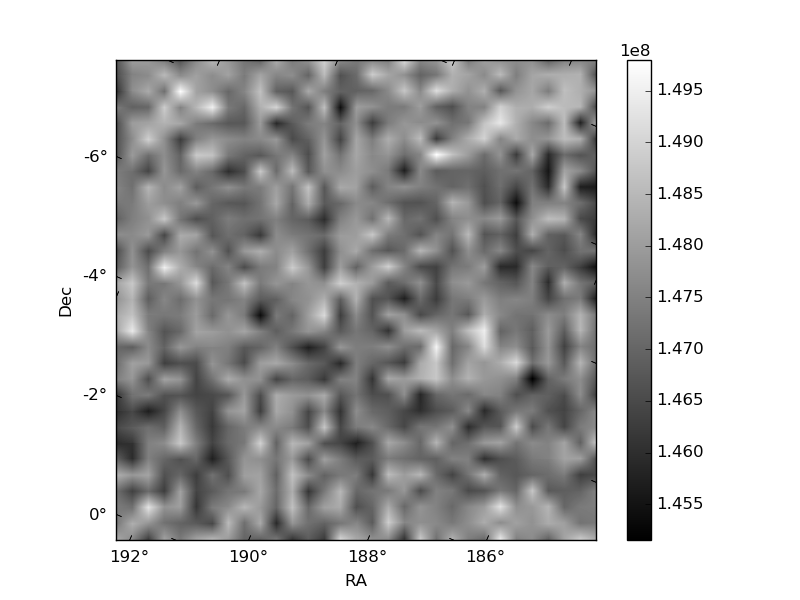
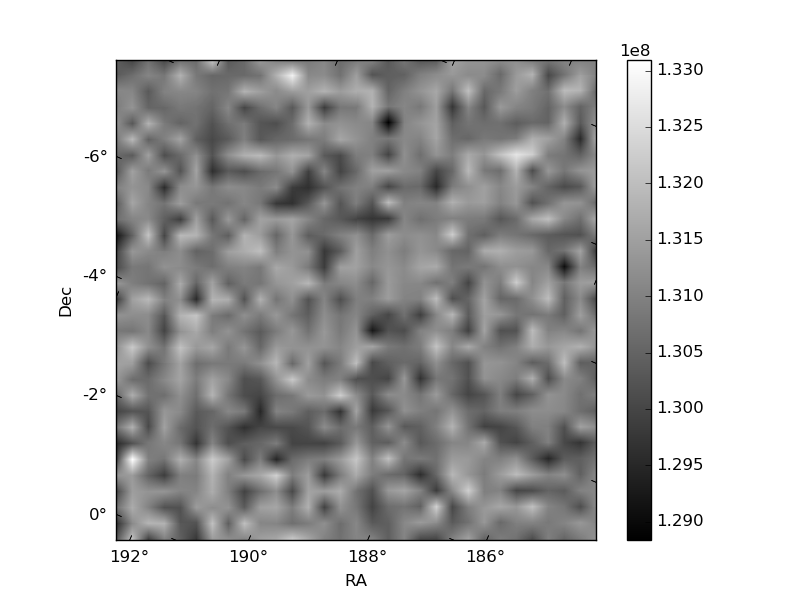
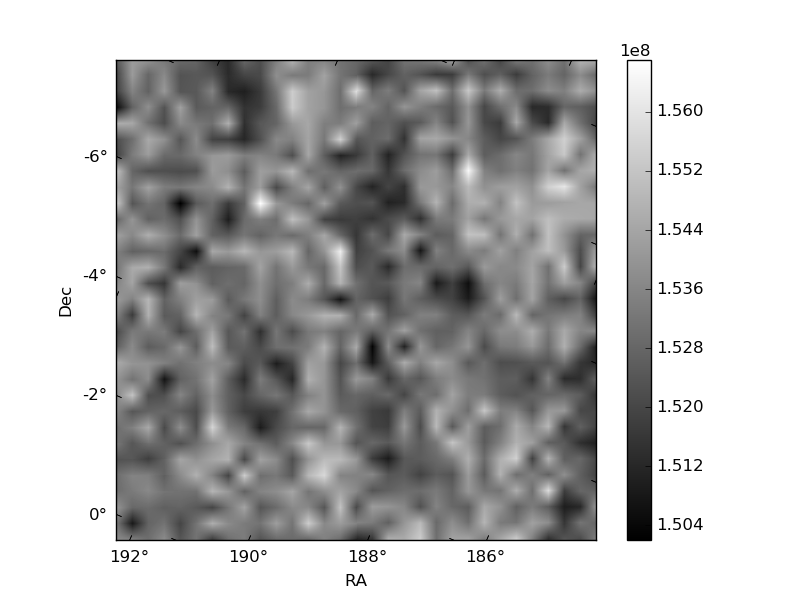
Histogram calculated using DETX and DETY for each event in the final _common_clean file
| Quadrant A | 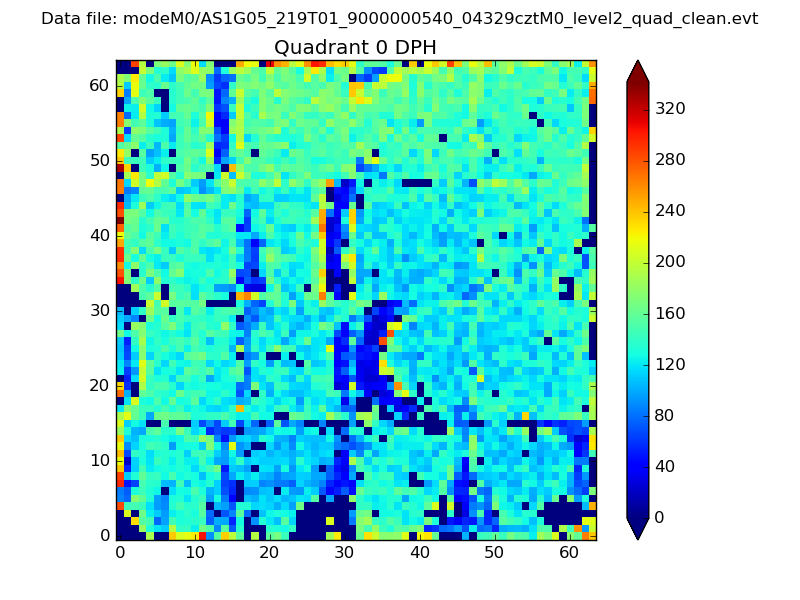 |
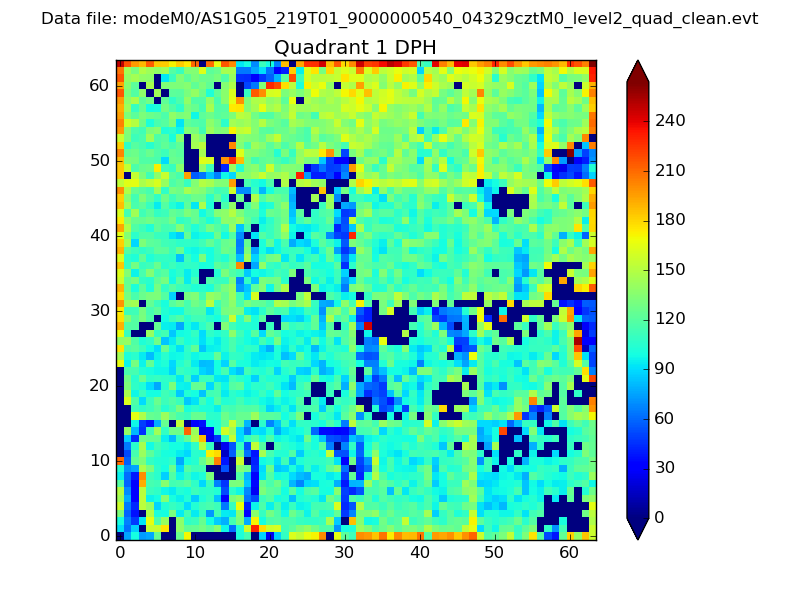 |
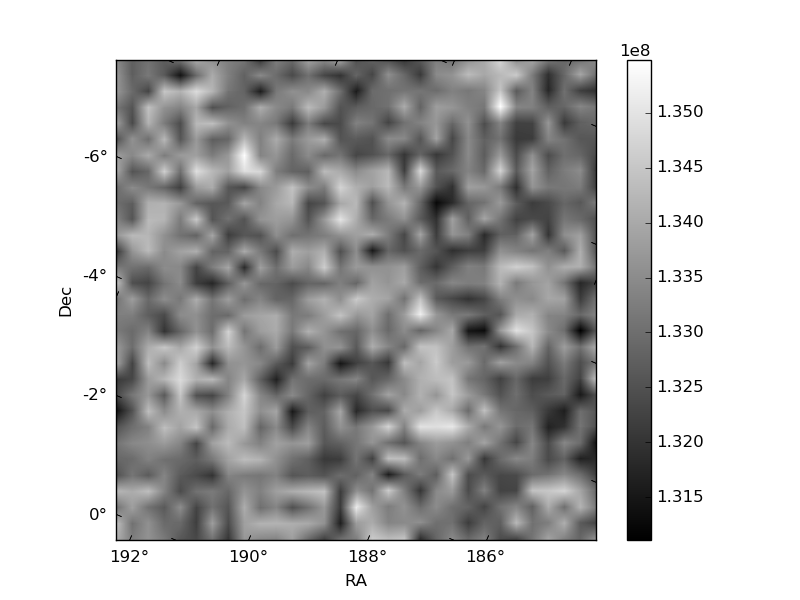
Quadrant B |
|---|---|---|---|
| Quadrant D | 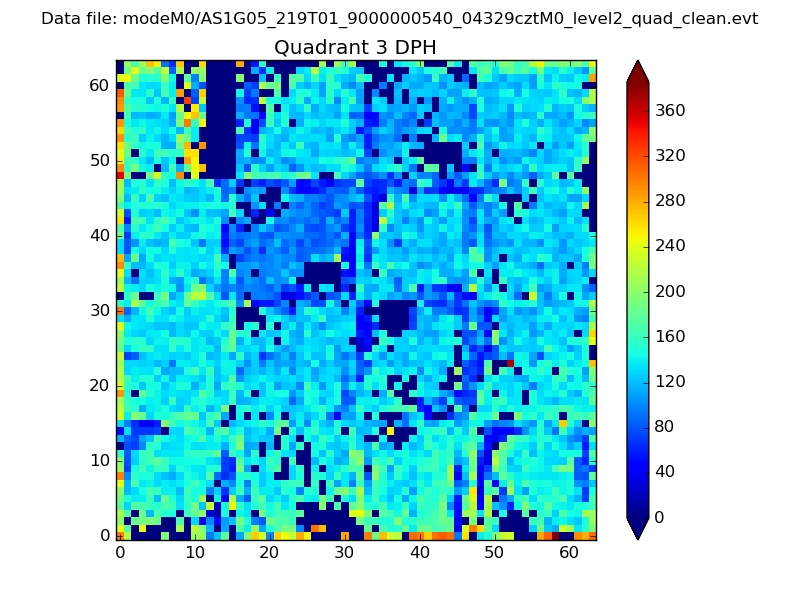 |
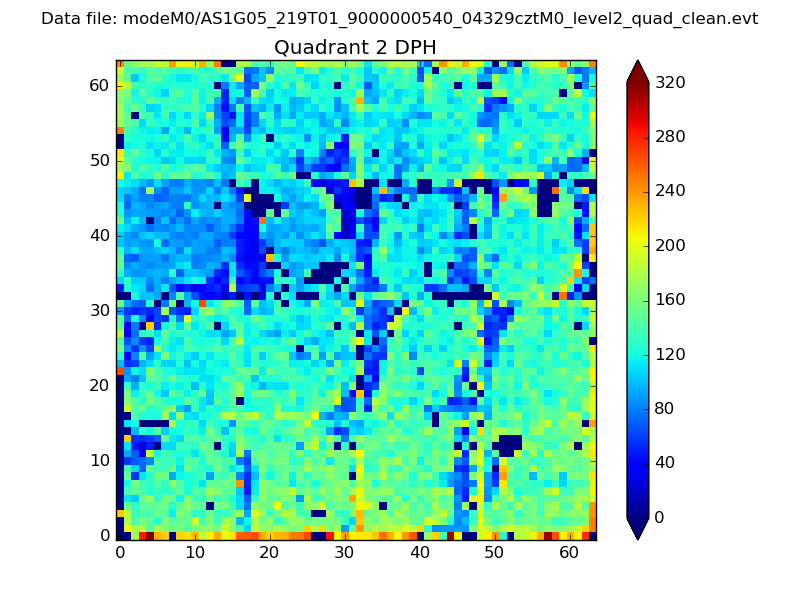 |
Quadrant C |
| Plot type | Count rate plots | Images |
|---|---|---|
| Comparison with Poisson distribution Blue bars denote a histogram of data divided into 1 sec bins. Red curve is a Poisson curve with rate = median count rate of data. |
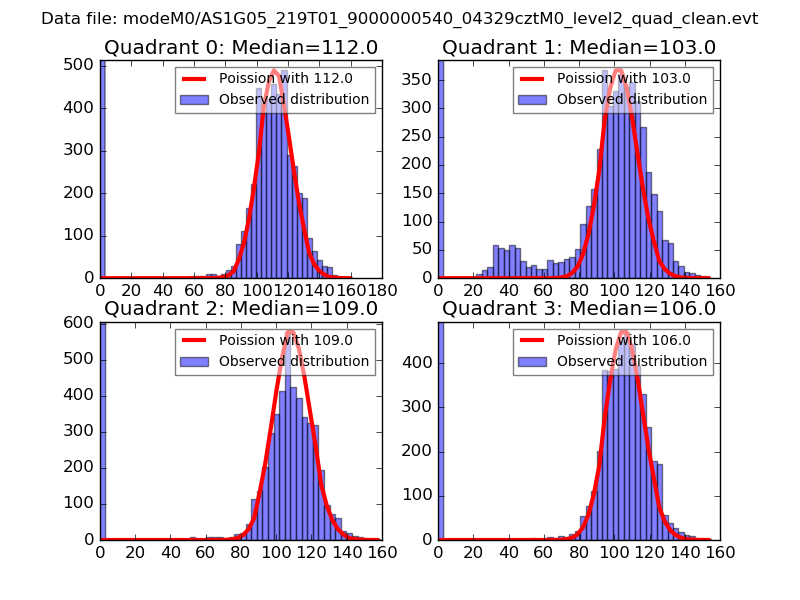 |
 |
| Quadrant-wise count rates Data is divided into 100 sec bins |
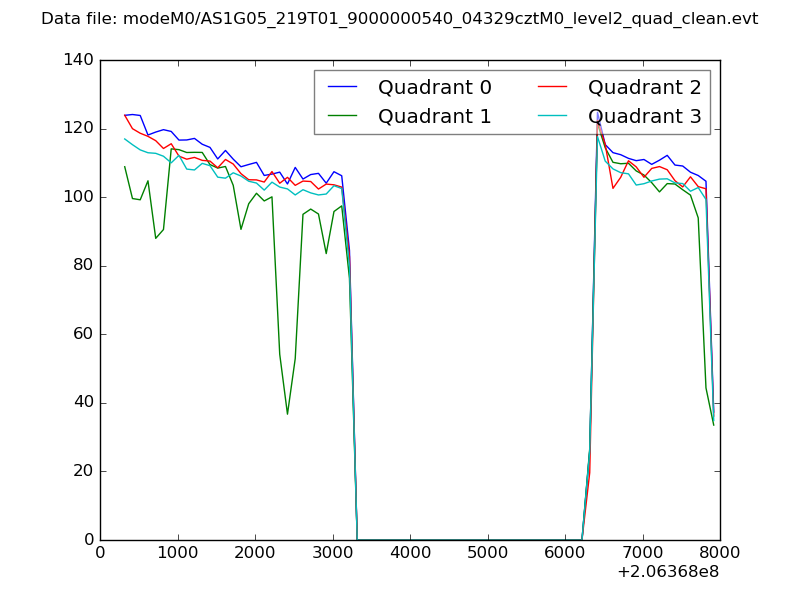 |
|
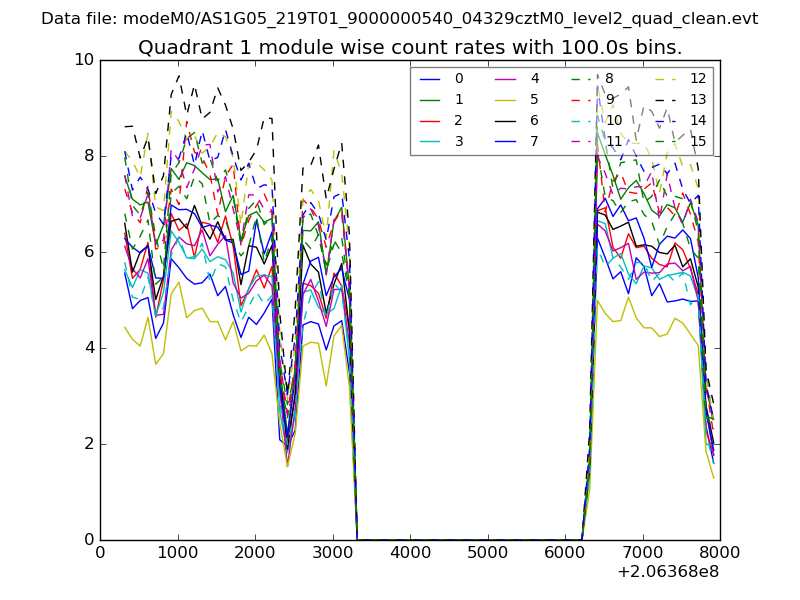
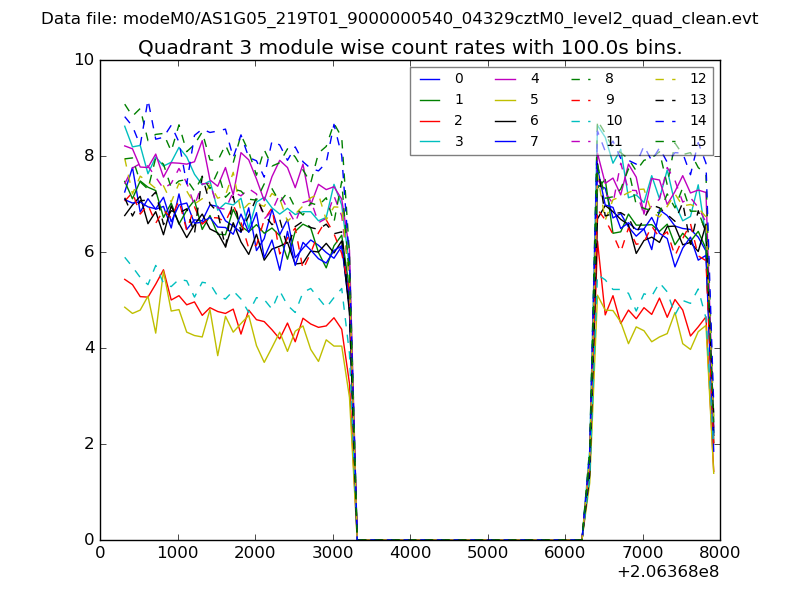
| Module-wise count rates for Quadrant A Data is divided into 100 sec bins |
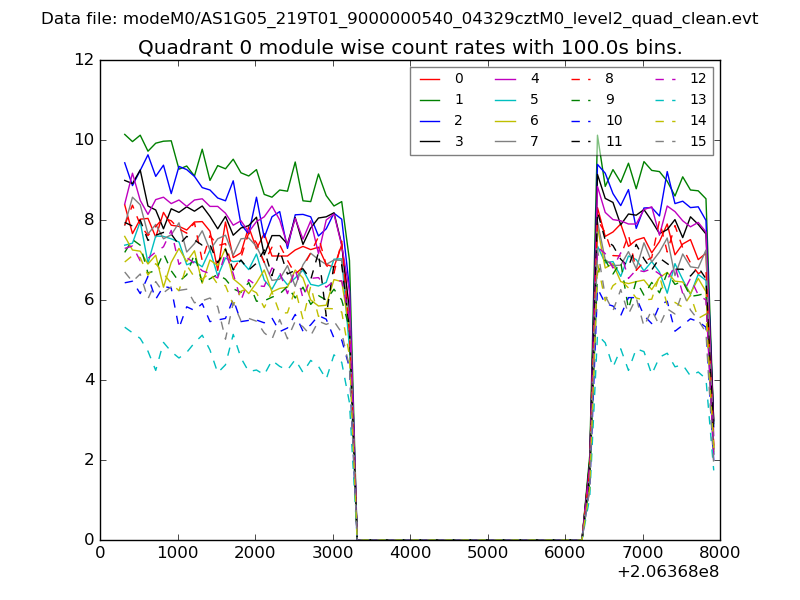 |
 |
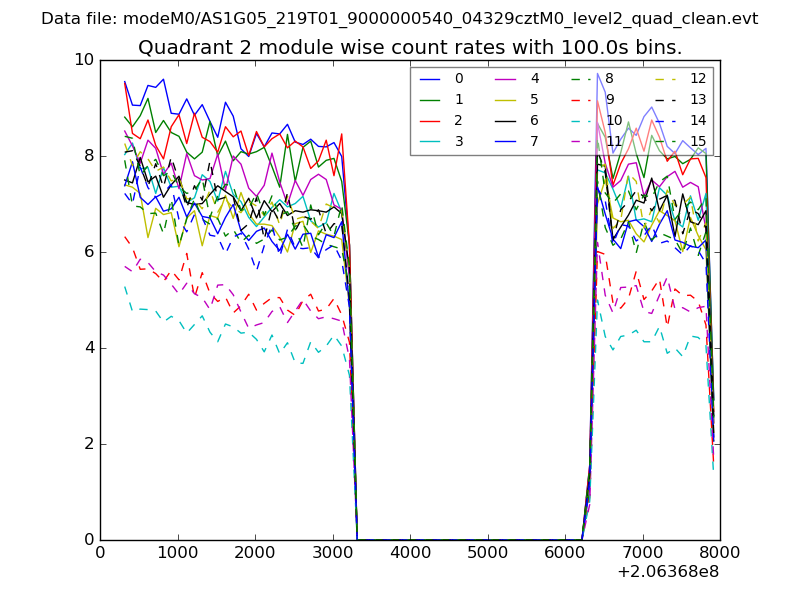
| Module-wise count rates for Quadrant B Data is divided into 100 sec bins |
 |
 |
| Module-wise count rates for Quadrant C Data is divided into 100 sec bins |
 |
 |
| Module-wise count rates for Quadrant D Data is divided into 100 sec bins |
 |
 |
| Parameter | Plot |
|---|---|
| CZT HV Monitor | 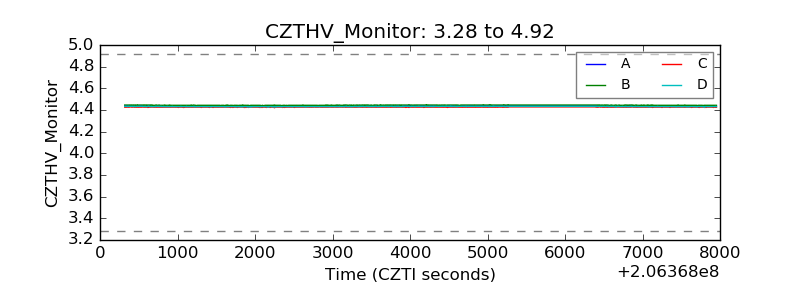 |
| D_VDD |  |
| Temperature 1 | 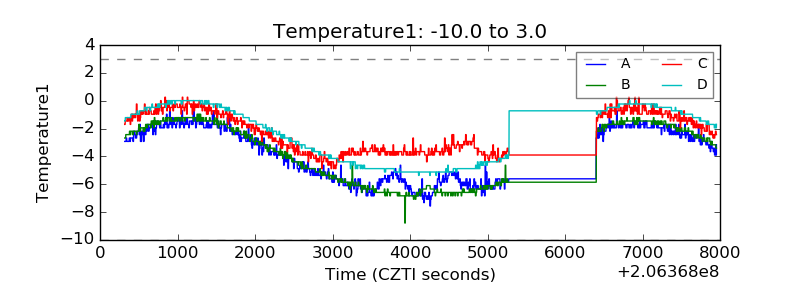 |
| Veto HV Monitor | 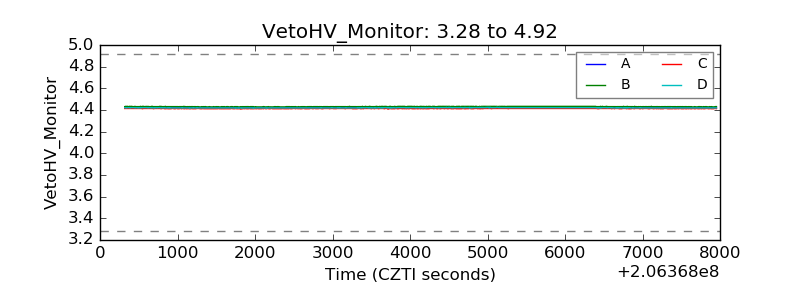 |
| Veto LLD | 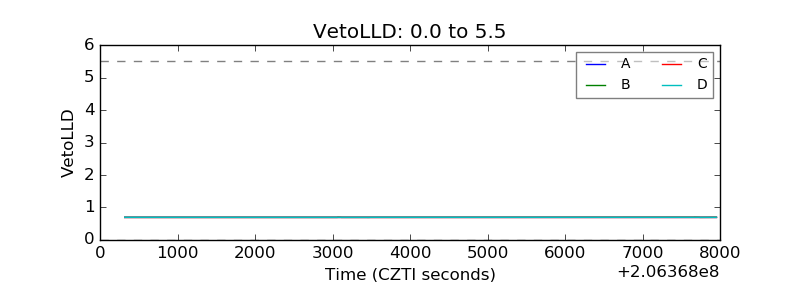 |
| Alpha Counter | 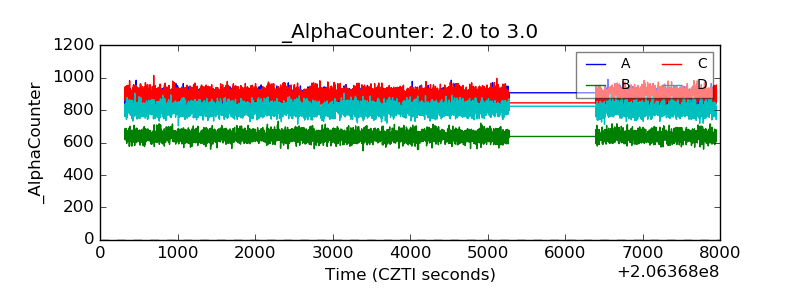 |
| _CPM_Rate | 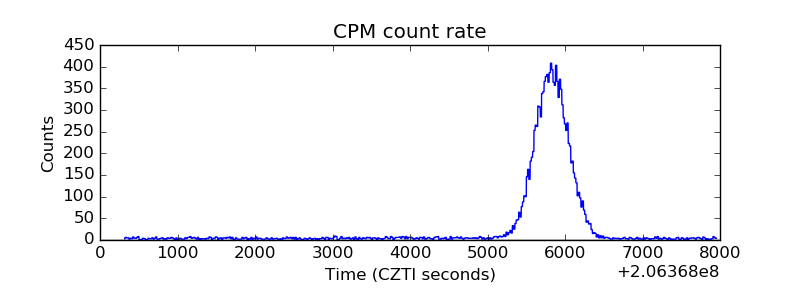 |
| CZT Counter | 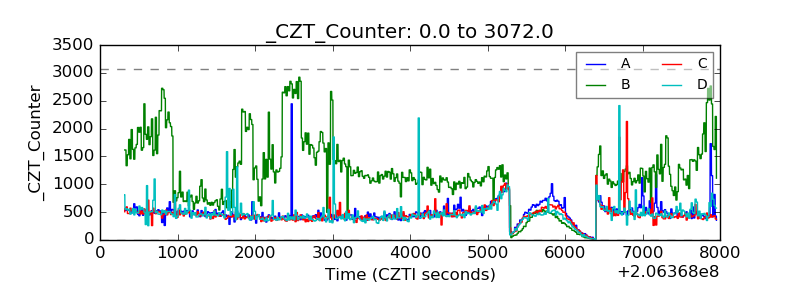 |
| +2.5 Volts monitor |  |
| +5 Volts monitor |  |
| _ROLL_ROT | 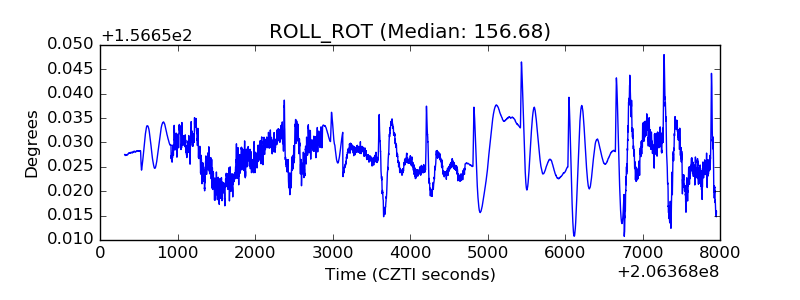 |
| _Roll_DEC | 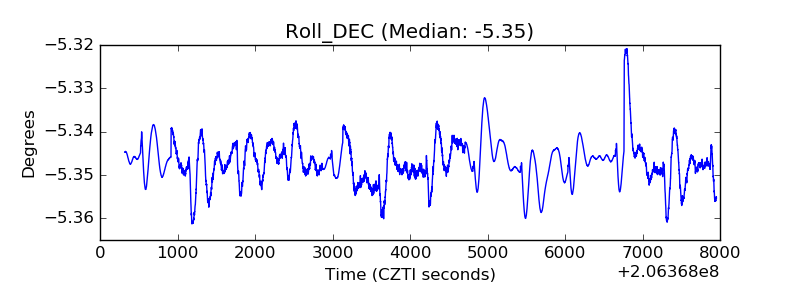 |
| _Roll_RA | 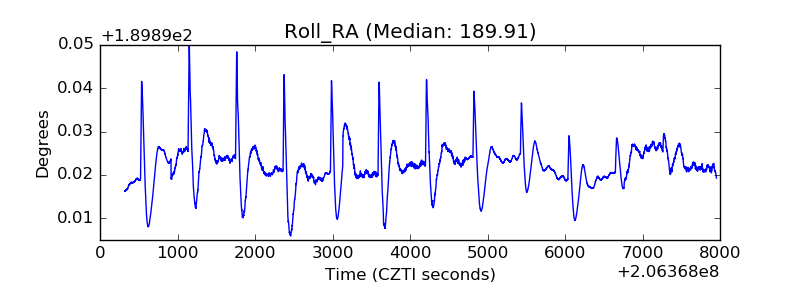 |
| Veto Counter | 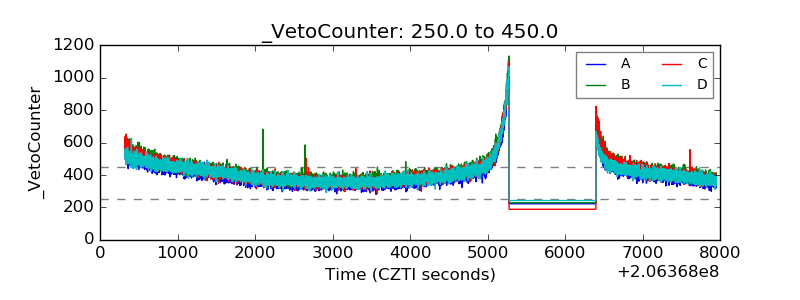 |