| Param | Original file | Final file |
|---|---|---|
| Filename | modeM0/AS1G05_219T01_9000000540_04330cztM0_level2.evt | modeM0/AS1G05_219T01_9000000540_04330cztM0_level2_quad_clean.evt |
| Size (bytes) | 798,252,480 | 65,692,800 |
| Size | 761.3 MB | 62.6 MB |
| Events in quadrant A | 3,163,685 | 446,152 |
| Events in quadrant B | 13,944,527 | 242,047 |
| Events in quadrant C | 2,956,766 | 432,335 |
| Events in quadrant D | 3,677,438 | 421,060 |
| Mode SS | |||
|---|---|---|---|
| Quadrant | BADHDUFLAG | Total packets | Discarded packets |
| A | 0 | 132 | 0 |
| B | 0 | 132 | 0 |
| C | 0 | 132 | 0 |
| D | 0 | 132 | 0 |
| Mode M9 | |||
|---|---|---|---|
| Quadrant | BADHDUFLAG | Total packets | Discarded packets |
| A | 0 | 9 | 0 |
| B | 0 | 9 | 0 |
| C | 0 | 9 | 0 |
| D | 0 | 9 | 0 |
| Mode M0 | |||
|---|---|---|---|
| Quadrant | BADHDUFLAG | Total packets | Discarded packets |
| A | 0 | 13900 | 2 |
| B | 0 | 45747 | 1 |
| C | 0 | 13473 | 1 |
| D | 0 | 15364 | 1 |
| Quadrant | Total seconds | Saturated seconds | Saturation percentage |
|---|---|---|---|
| A | 6393 | 90 | 1.407790% |
| B | 6393 | 4771 | 74.628500% |
| C | 6393 | 67 | 1.048021% |
| D | 6393 | 96 | 1.501642% |
Noise dominated data is calculated using 1-second bins in cleaned event files. If a bin has >2000 counts, and if more than 50% of those come from <1% of pixels, then it is considered to be noise-dominated and hence unusable.
| Quadrant | # 1 sec bins | Bins with >0 counts | Bins with >2000 counts | High rate bins dominated by noise | Noise dominated (total time) | Noise dominated (detector-on time) | Marked lightcurve |
|---|---|---|---|---|---|---|---|
| A | 7288 | 6393 | 16 | 16 | 0.22% | 0.25% | 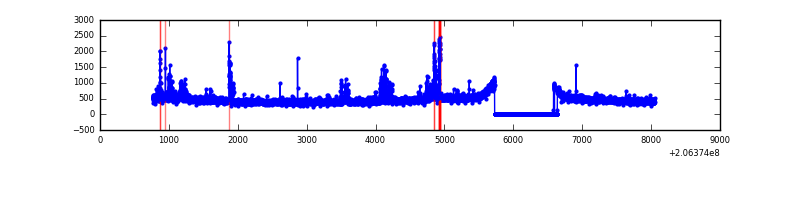 |
| B | 7287 | 6392 | 4618 | 4618 | 63.37% | 72.25% | 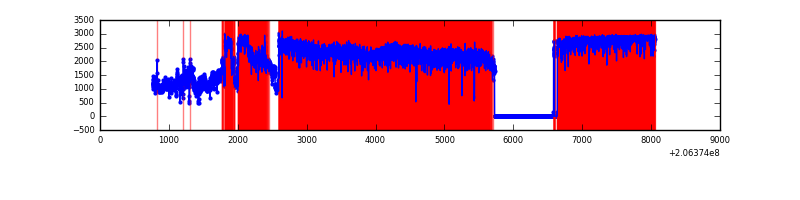 |
| C | 7288 | 6394 | 16 | 16 | 0.22% | 0.25% | 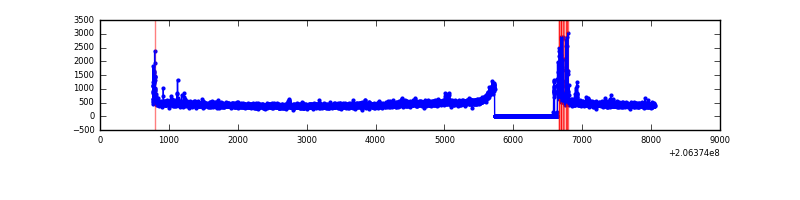 |
| D | 7287 | 6393 | 67 | 67 | 0.92% | 1.05% | 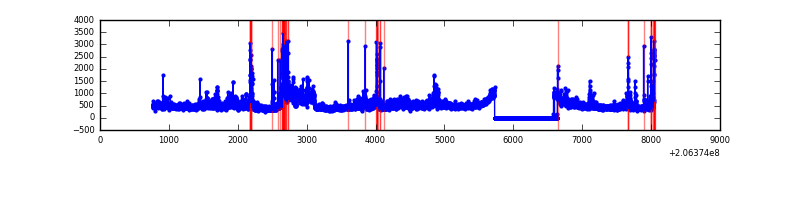 |
Top three noisy pixels from each quadrant. If the there are fewer than three noisy pixels in the level2.evt file, extra rows are filled as -1
| Pixel properties | Quadrant properties | ||||||
|---|---|---|---|---|---|---|---|
| Quadrant | DetID | PixID | Counts | Sigma | Mean | Median | Sigma |
| A | 13 | 251 | 161962 | 1044.18 | 750 | 734 | 154.4 |
| A | 0 | 13 | 74774 | 479.51 | 750 | 734 | 154.4 |
| A | 15 | 234 | 30260 | 191.22 | 750 | 734 | 154.4 |
| B | 3 | 0 | 11490408 | 118647.62 | 504 | 492 | 96.8 |
| B | 15 | 204 | 323181 | 3332.16 | 504 | 492 | 96.8 |
| B | 14 | 167 | 98705 | 1014.17 | 504 | 492 | 96.8 |
| C | 9 | 16 | 93925 | 549.05 | 719 | 723 | 169.8 |
| C | 9 | 247 | 42950 | 248.76 | 719 | 723 | 169.8 |
| C | 10 | 65 | 12672 | 70.39 | 719 | 723 | 169.8 |
| D | 12 | 79 | 465872 | 2677.5 | 718 | 697 | 173.7 |
| D | 2 | 136 | 133498 | 764.39 | 718 | 697 | 173.7 |
| D | 12 | 233 | 105642 | 604.05 | 718 | 697 | 173.7 |
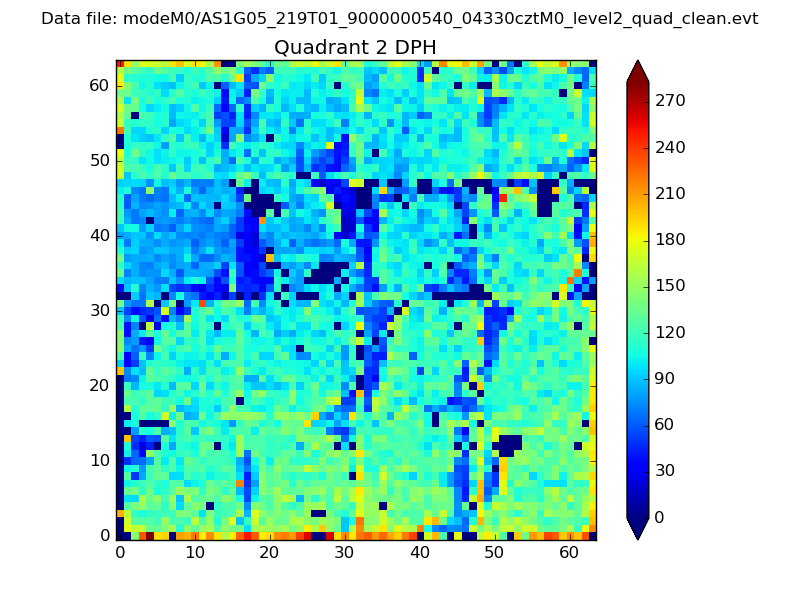
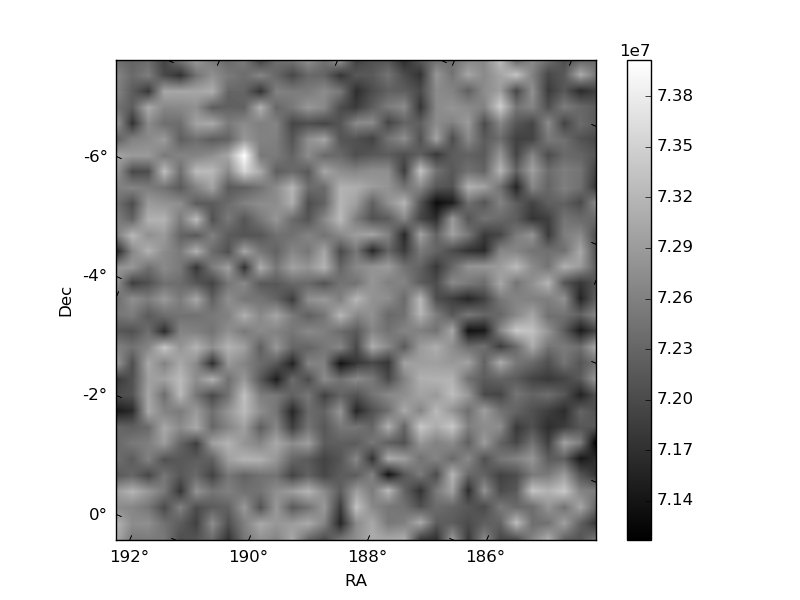
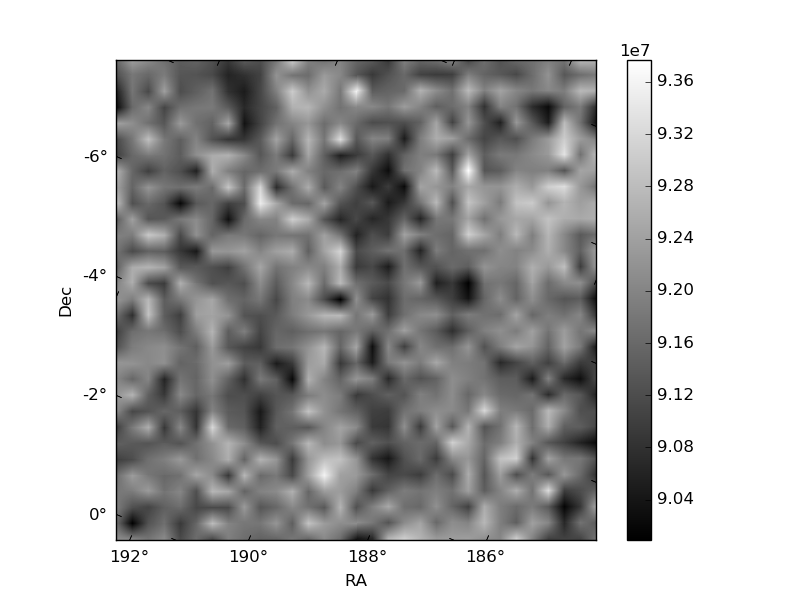
Histogram calculated using DETX and DETY for each event in the final _common_clean file
| Quadrant A | 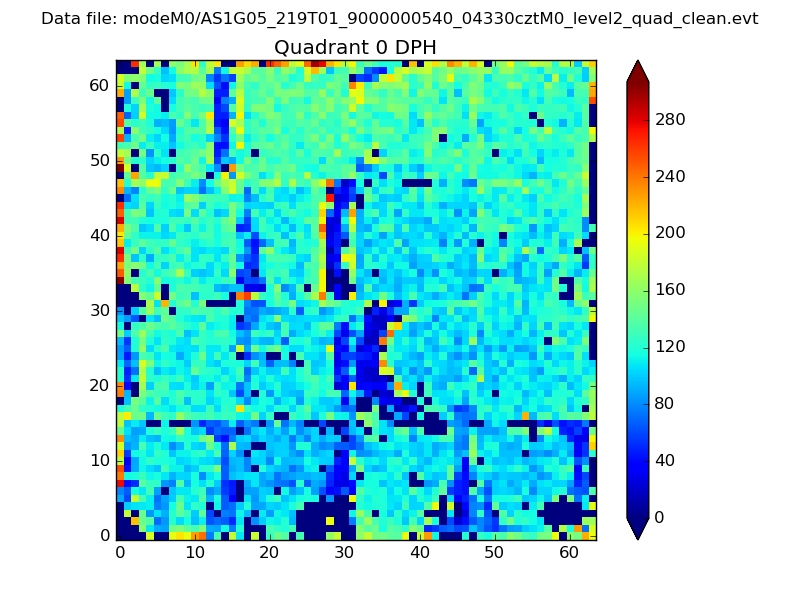 |
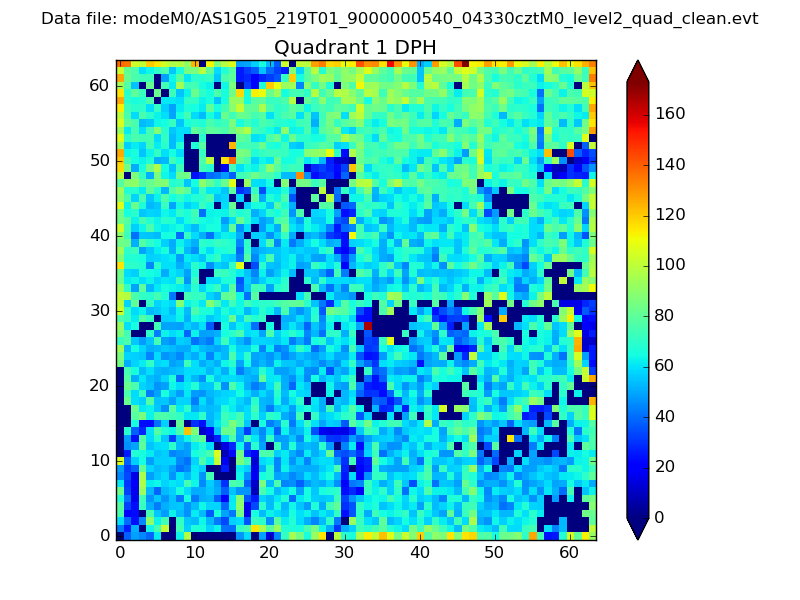 |
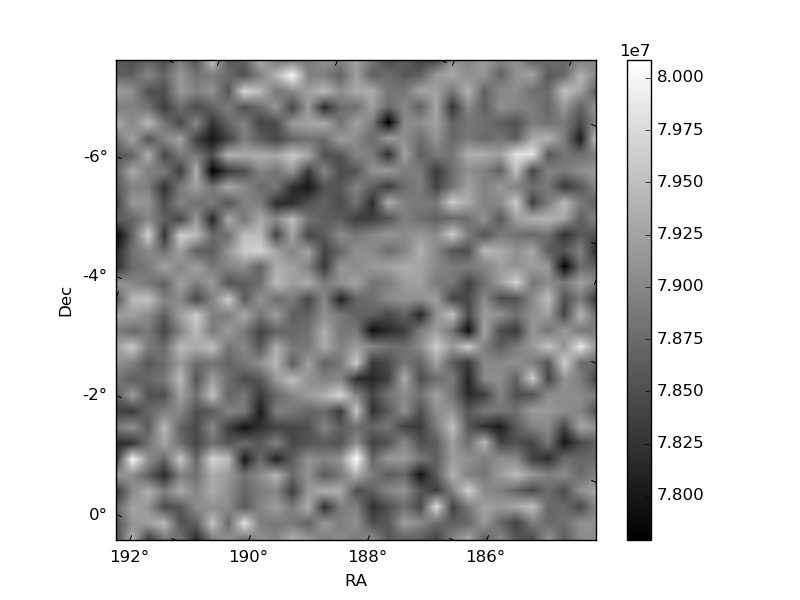
Quadrant B |
|---|---|---|---|
| Quadrant D | 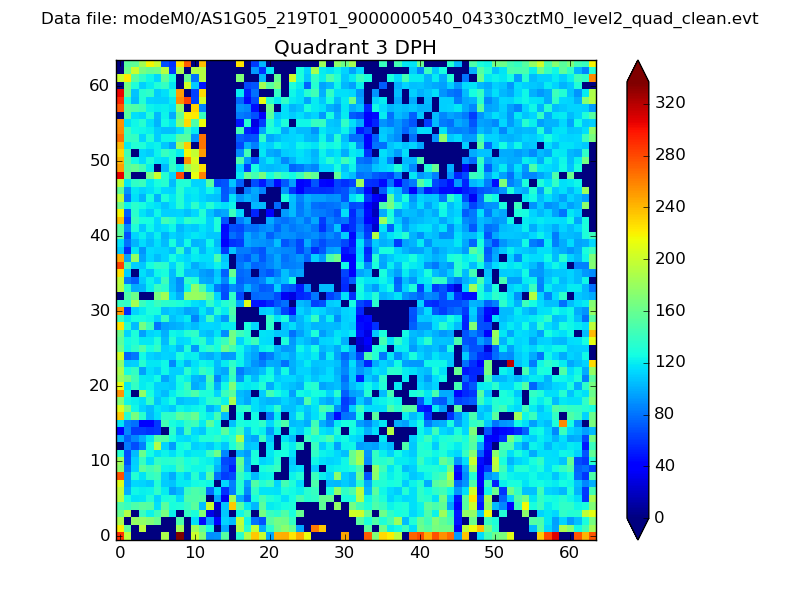 |
 |
Quadrant C |
| Plot type | Count rate plots | Images |
|---|---|---|
| Comparison with Poisson distribution Blue bars denote a histogram of data divided into 1 sec bins. Red curve is a Poisson curve with rate = median count rate of data. |
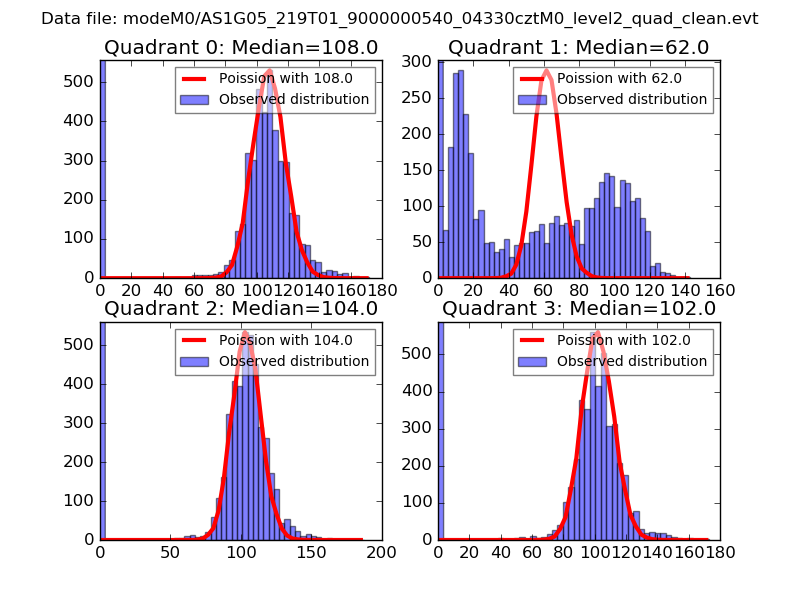 |
 |
| Quadrant-wise count rates Data is divided into 100 sec bins |
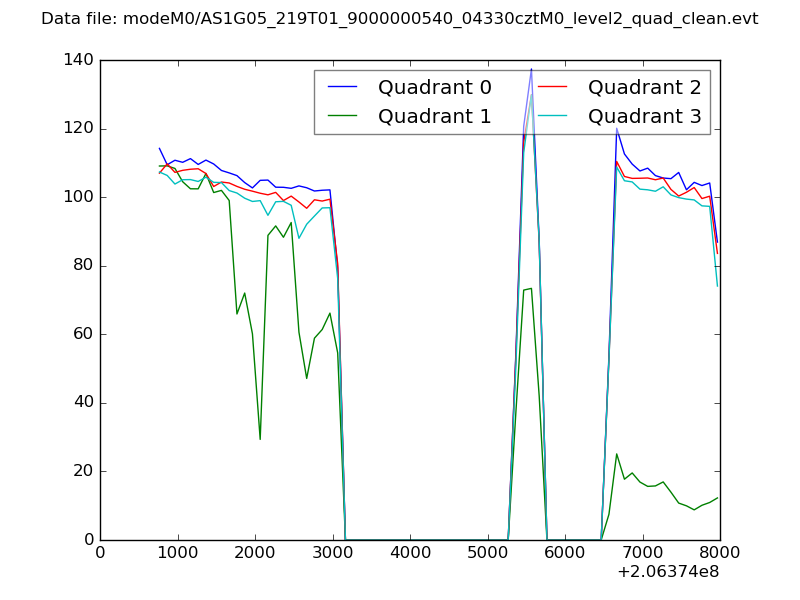 |
|
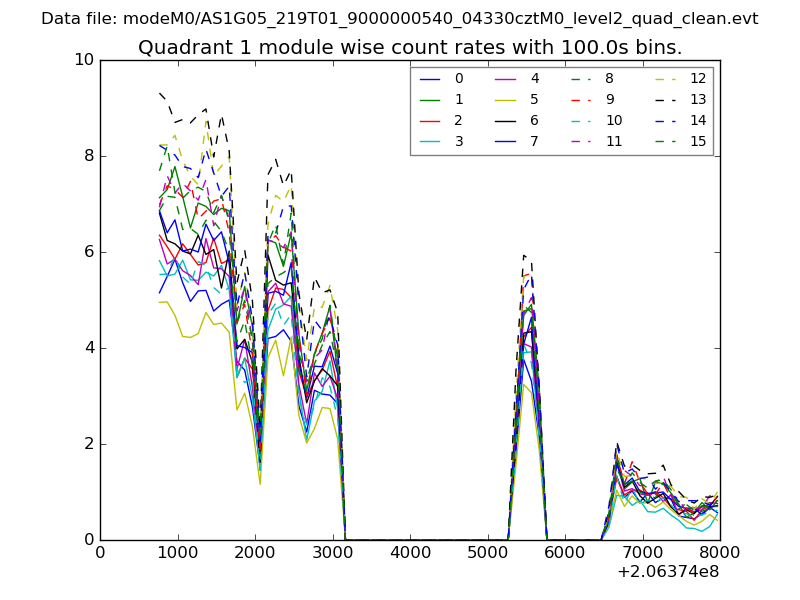
| Module-wise count rates for Quadrant A Data is divided into 100 sec bins |
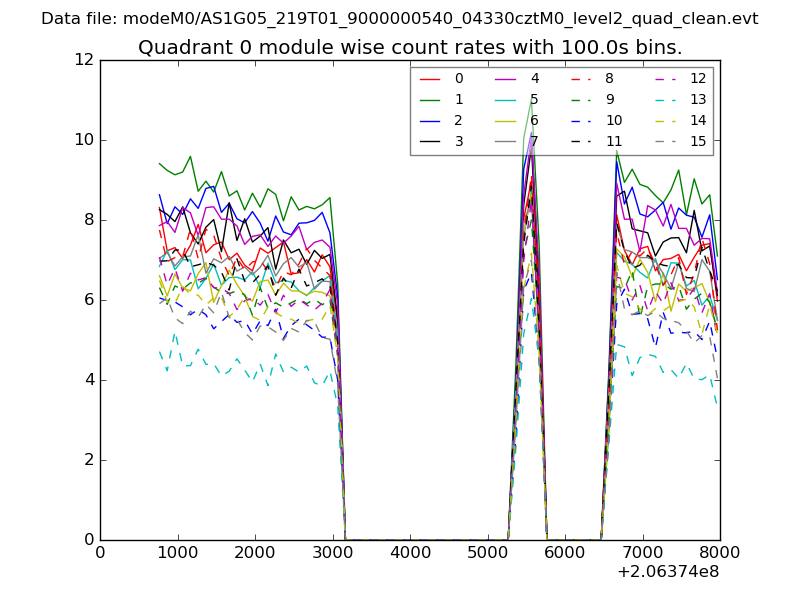 |
 |
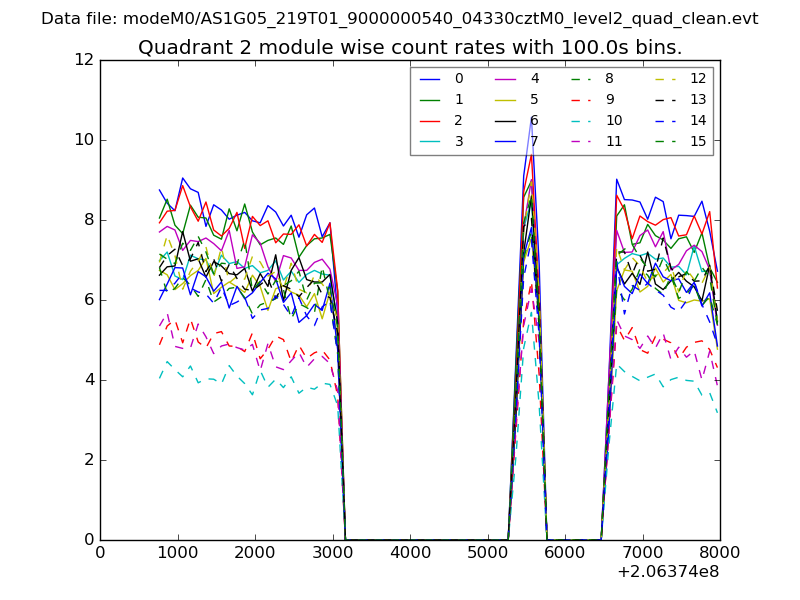
| Module-wise count rates for Quadrant B Data is divided into 100 sec bins |
 |
 |
| Module-wise count rates for Quadrant C Data is divided into 100 sec bins |
 |
 |
| Module-wise count rates for Quadrant D Data is divided into 100 sec bins |
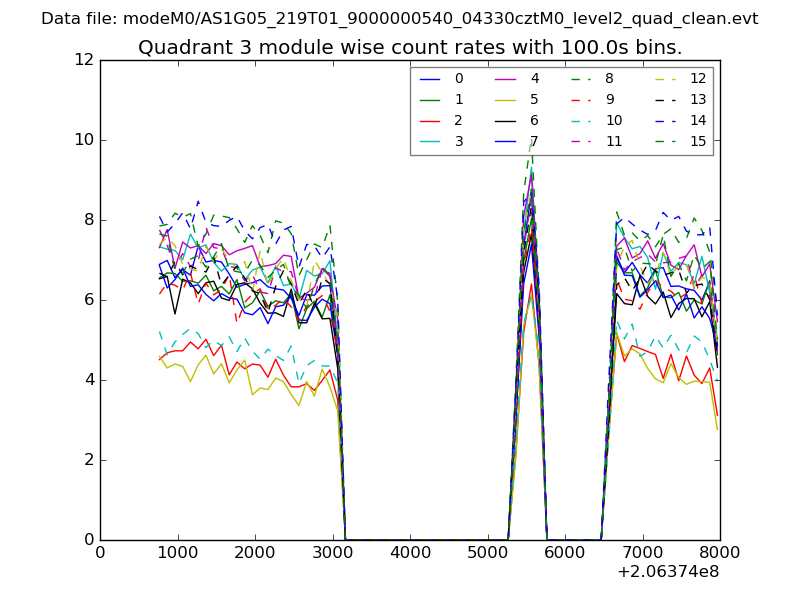 |
 |
| Parameter | Plot |
|---|---|
| CZT HV Monitor | 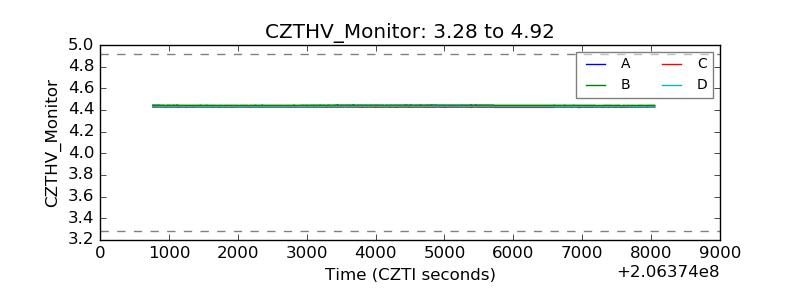 |
| D_VDD | 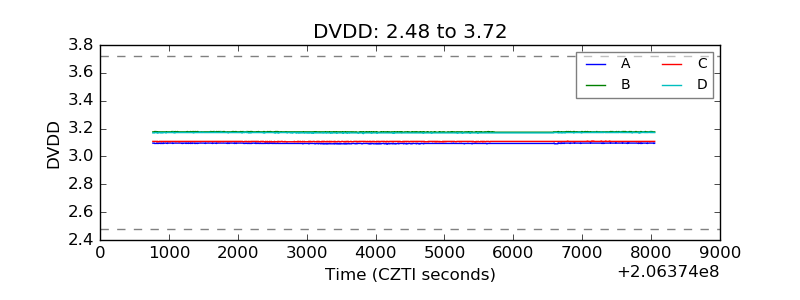 |
| Temperature 1 | 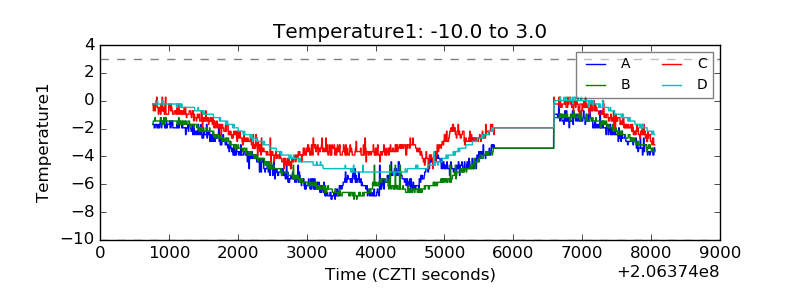 |
| Veto HV Monitor | 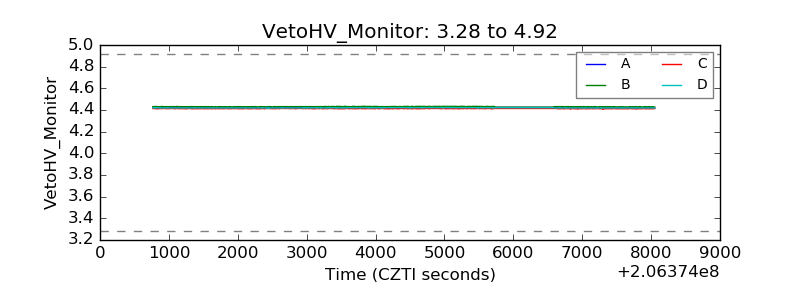 |
| Veto LLD | 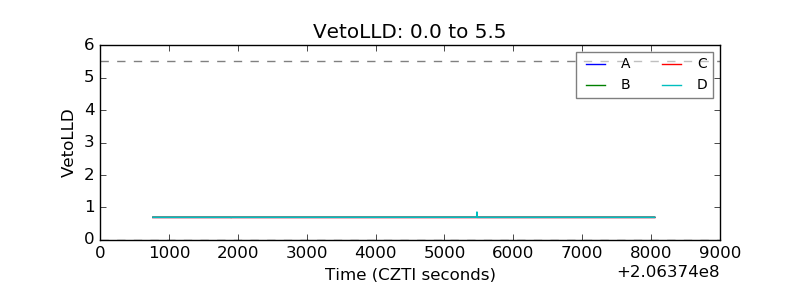 |
| Alpha Counter | 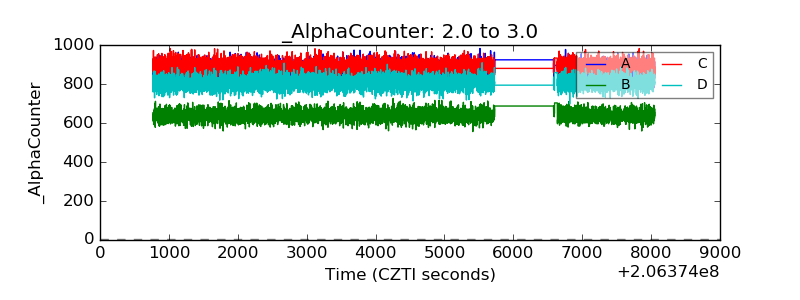 |
| _CPM_Rate | 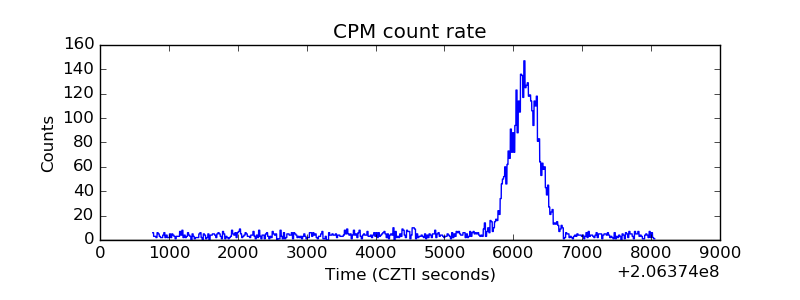 |
| CZT Counter | 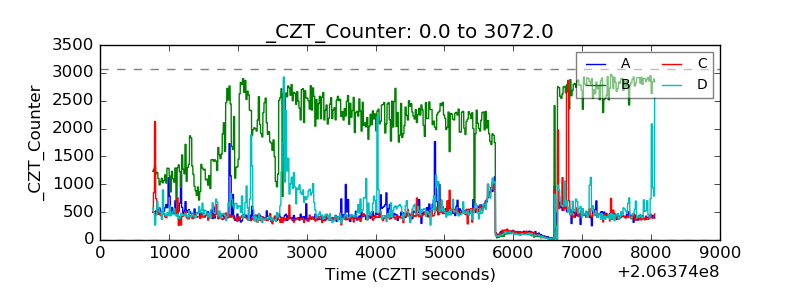 |
| +2.5 Volts monitor |  |
| +5 Volts monitor |  |
| _ROLL_ROT | 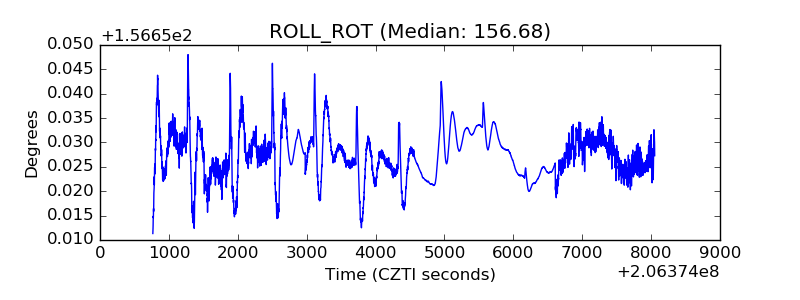 |
| _Roll_DEC | 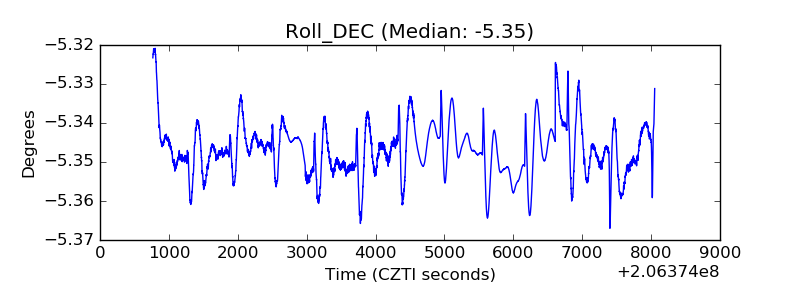 |
| _Roll_RA | 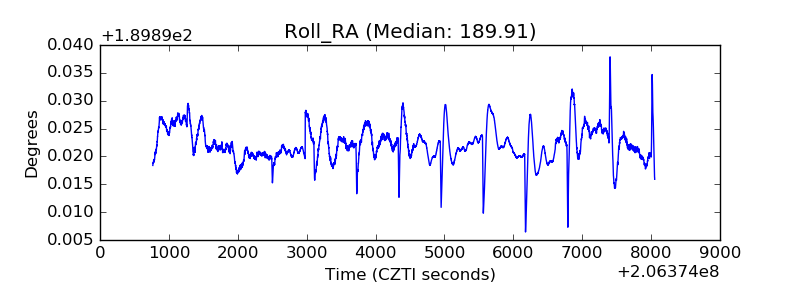 |
| Veto Counter | 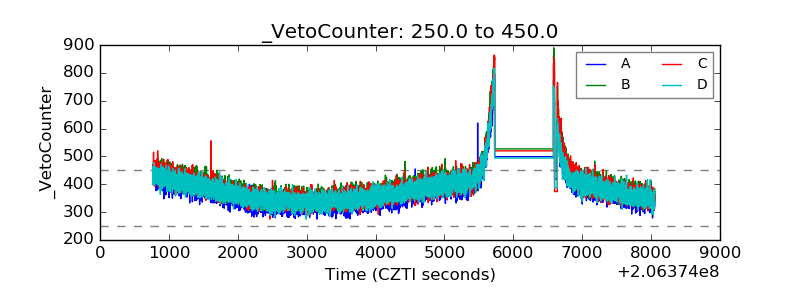 |