| Param | Original file | Final file |
|---|---|---|
| Filename | modeM0/AS1G05_219T01_9000000540_04332cztM0_level2.evt | modeM0/AS1G05_219T01_9000000540_04332cztM0_level2_quad_clean.evt |
| Size (bytes) | 690,638,400 | 65,920,320 |
| Size | 658.6 MB | 62.9 MB |
| Events in quadrant A | 2,920,404 | 471,247 |
| Events in quadrant B | 11,585,528 | 181,490 |
| Events in quadrant C | 2,861,453 | 462,665 |
| Events in quadrant D | 3,128,616 | 446,783 |
| Mode SS | |||
|---|---|---|---|
| Quadrant | BADHDUFLAG | Total packets | Discarded packets |
| A | 0 | 154 | 16 |
| B | 0 | 153 | 21 |
| C | 0 | 153 | 27 |
| D | 0 | 154 | 14 |
| Mode M9 | |||
|---|---|---|---|
| Quadrant | BADHDUFLAG | Total packets | Discarded packets |
| A | 0 | 3 | 0 |
| B | 0 | 3 | 1 |
| C | 0 | 3 | 1 |
| D | 0 | 4 | 1 |
| Mode M0 | |||
|---|---|---|---|
| Quadrant | BADHDUFLAG | Total packets | Discarded packets |
| A | 0 | 15472 | 2273 |
| B | 0 | 52434 | 14360 |
| C | 0 | 15414 | 2214 |
| D | 0 | 16360 | 2376 |
| Quadrant | Total seconds | Saturated seconds | Saturation percentage |
|---|---|---|---|
| A | 6396 | 28 | 0.437774% |
| B | 5393 | 3891 | 72.149082% |
| C | 6429 | 7 | 0.108882% |
| D | 6394 | 59 | 0.922740% |
Noise dominated data is calculated using 1-second bins in cleaned event files. If a bin has >2000 counts, and if more than 50% of those come from <1% of pixels, then it is considered to be noise-dominated and hence unusable.
| Quadrant | # 1 sec bins | Bins with >0 counts | Bins with >2000 counts | High rate bins dominated by noise | Noise dominated (total time) | Noise dominated (detector-on time) | Marked lightcurve |
|---|---|---|---|---|---|---|---|
| A | 7762 | 6969 | 5 | 5 | 0.06% | 0.07% | 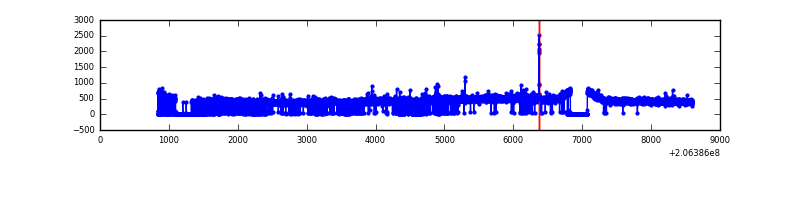 |
| B | 7745 | 5743 | 3679 | 3679 | 47.50% | 64.06% | 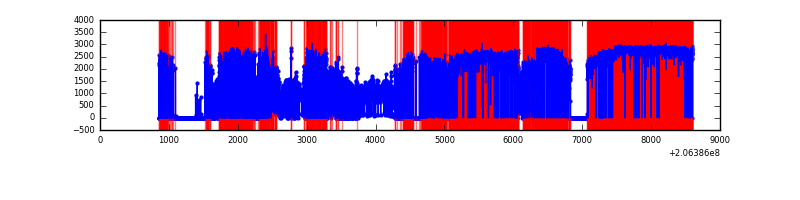 |
| C | 7762 | 6963 | 0 | 0 | 0.00% | 0.00% | 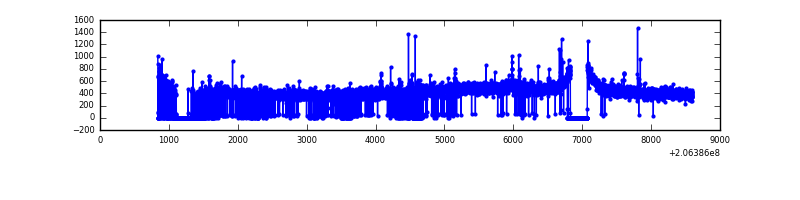 |
| D | 7763 | 6972 | 48 | 48 | 0.62% | 0.69% | 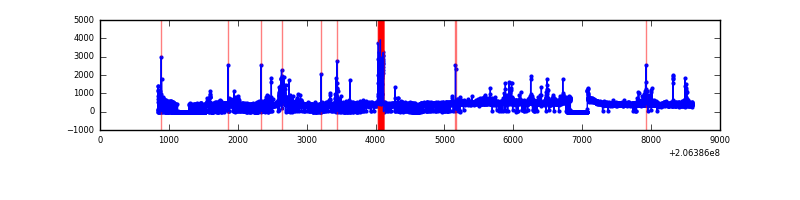 |
Top three noisy pixels from each quadrant. If the there are fewer than three noisy pixels in the level2.evt file, extra rows are filled as -1
| Pixel properties | Quadrant properties | ||||||
|---|---|---|---|---|---|---|---|
| Quadrant | DetID | PixID | Counts | Sigma | Mean | Median | Sigma |
| A | 13 | 251 | 44717 | 288.89 | 736 | 721 | 152.3 |
| A | 8 | 15 | 20816 | 131.95 | 736 | 721 | 152.3 |
| A | 15 | 234 | 18808 | 118.76 | 736 | 721 | 152.3 |
| B | 3 | 0 | 9936791 | 129248.49 | 394 | 385 | 76.9 |
| B | 14 | 167 | 28103 | 360.54 | 394 | 385 | 76.9 |
| B | 4 | 48 | 27331 | 350.5 | 394 | 385 | 76.9 |
| C | 9 | 247 | 31982 | 187.08 | 712 | 715 | 167.1 |
| C | 9 | 16 | 13728 | 77.86 | 712 | 715 | 167.1 |
| C | 8 | 128 | 11791 | 66.27 | 712 | 715 | 167.1 |
| D | 2 | 37 | 112987 | 650.28 | 706 | 683 | 172.7 |
| D | 2 | 136 | 104482 | 601.04 | 706 | 683 | 172.7 |
| D | 9 | 35 | 82670 | 474.74 | 706 | 683 | 172.7 |
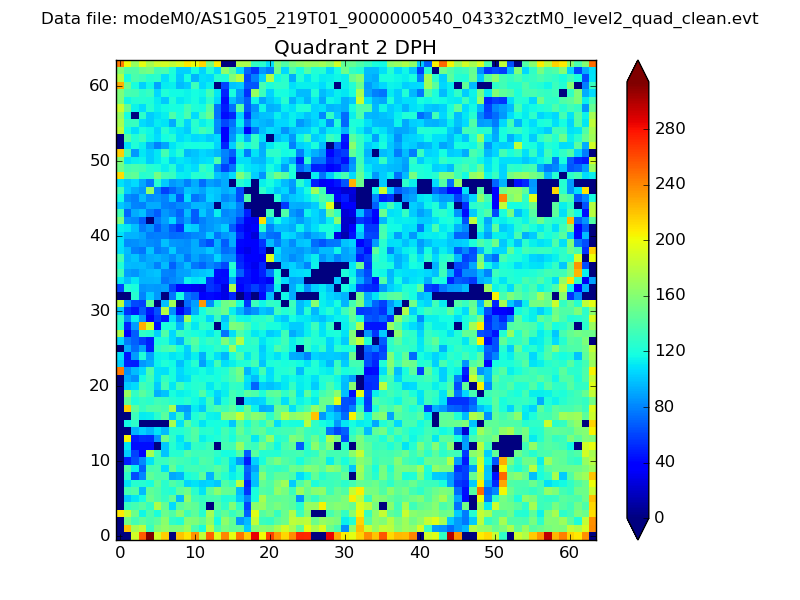
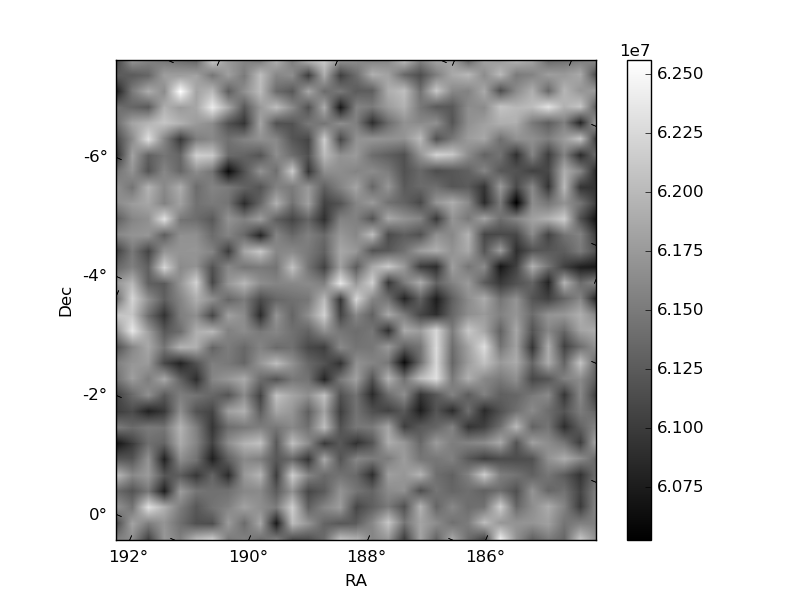
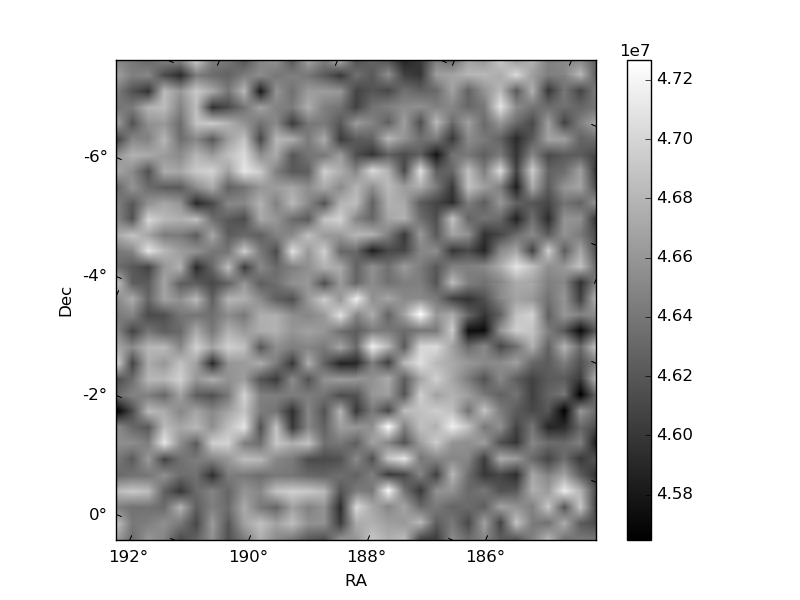
Histogram calculated using DETX and DETY for each event in the final _common_clean file
| Quadrant A | 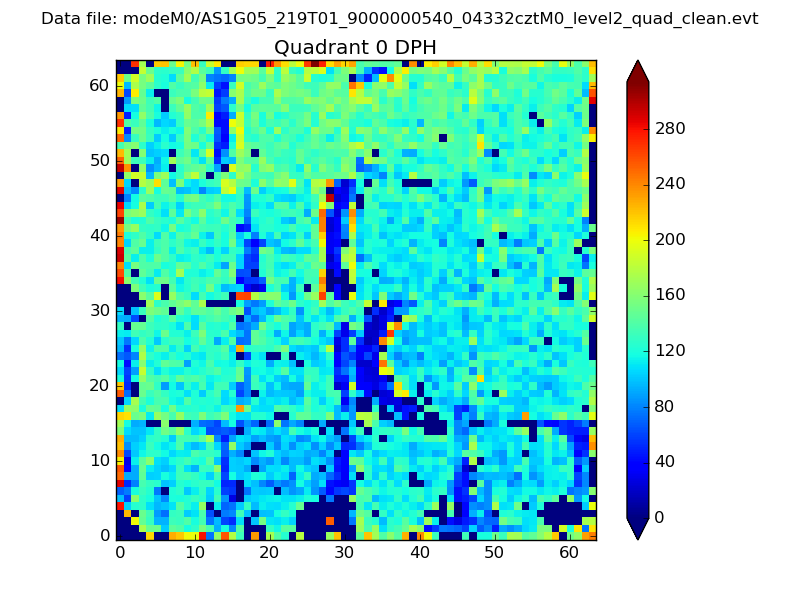 |
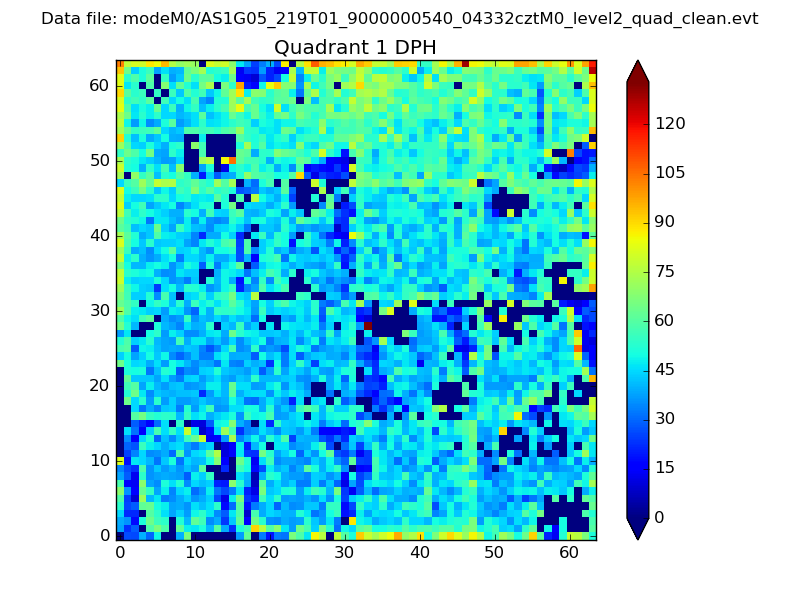 |
Quadrant B |
|---|---|---|---|
| Quadrant D | 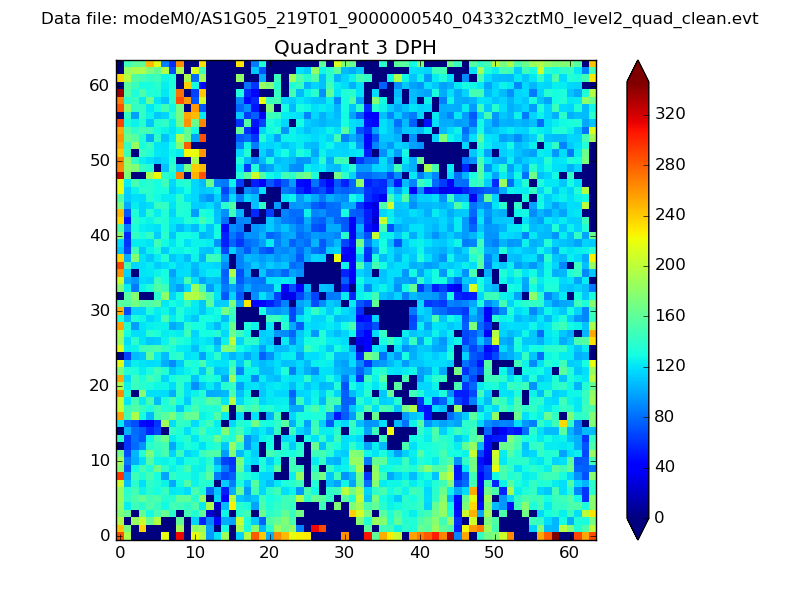 |
 |
Quadrant C |
| Plot type | Count rate plots | Images |
|---|---|---|
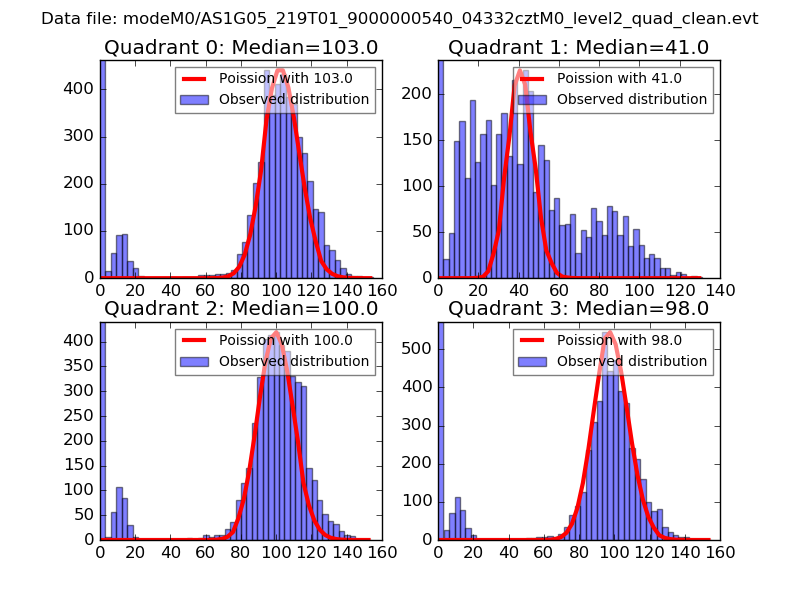
| Comparison with Poisson distribution Blue bars denote a histogram of data divided into 1 sec bins. Red curve is a Poisson curve with rate = median count rate of data. |
 |
 |
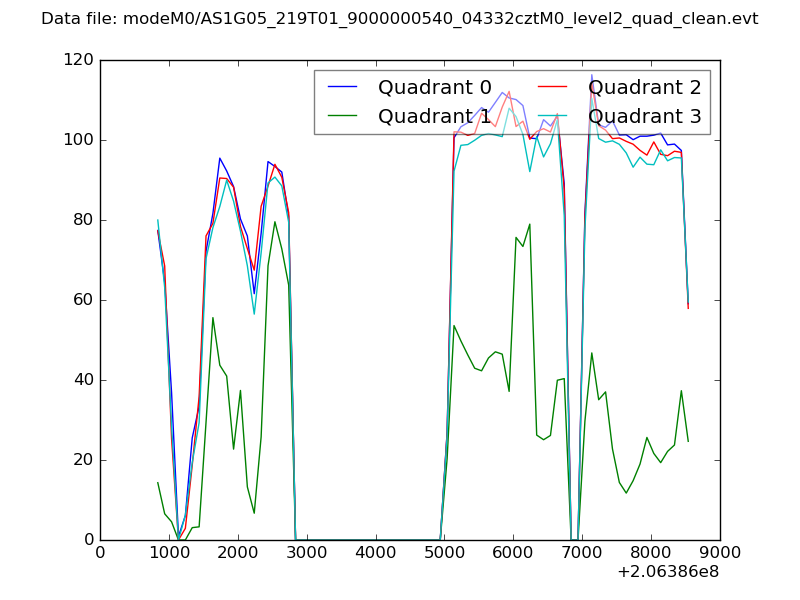
| Quadrant-wise count rates Data is divided into 100 sec bins |
 |
|
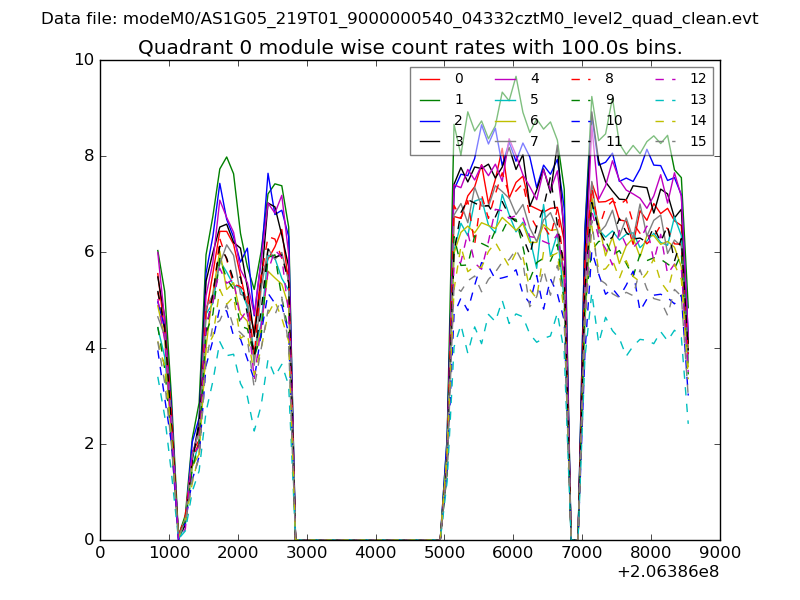
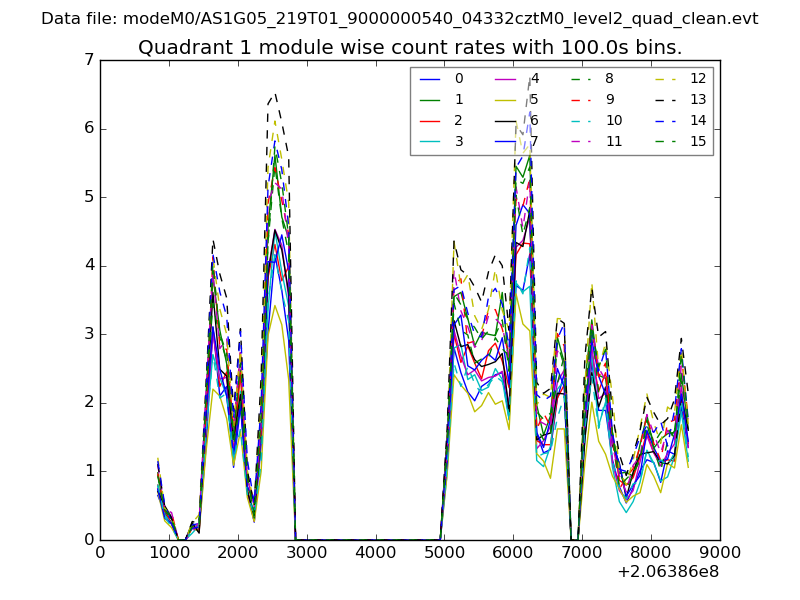
| Module-wise count rates for Quadrant A Data is divided into 100 sec bins |
 |
 |
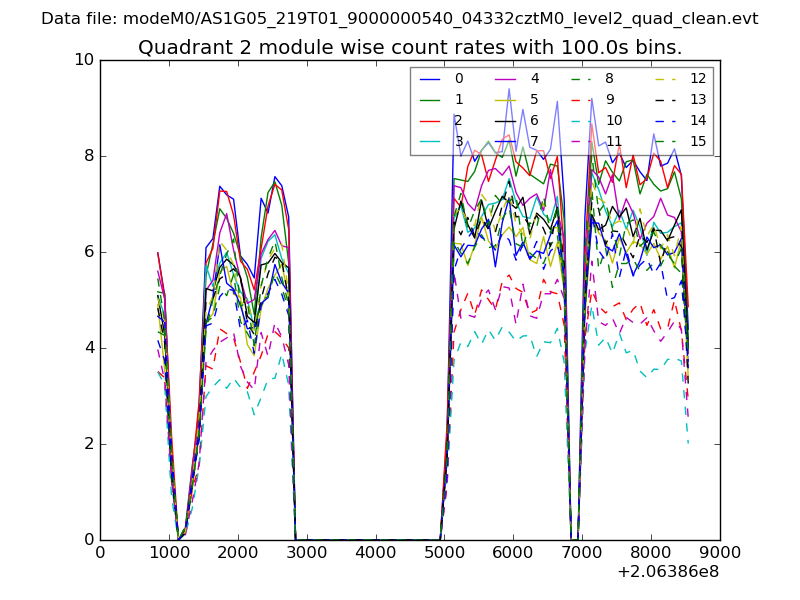
| Module-wise count rates for Quadrant B Data is divided into 100 sec bins |
 |
 |
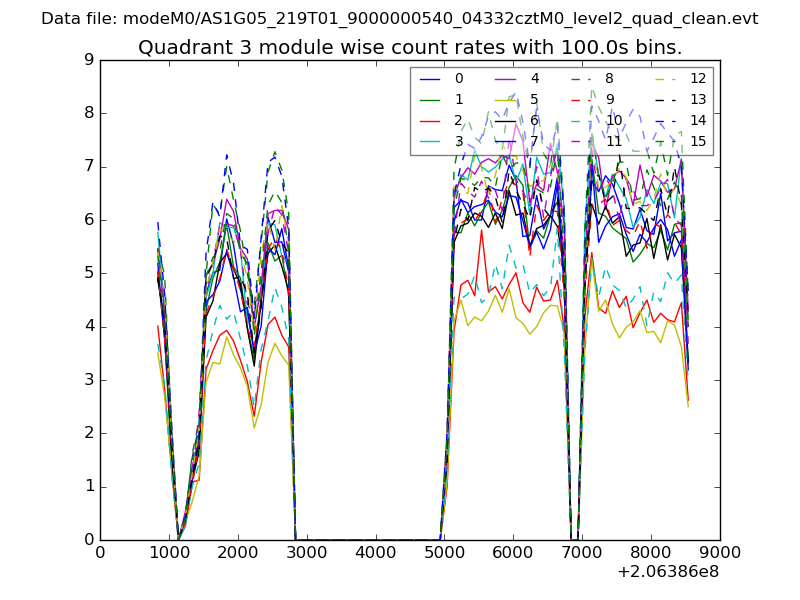
| Module-wise count rates for Quadrant C Data is divided into 100 sec bins |
 |
 |
| Module-wise count rates for Quadrant D Data is divided into 100 sec bins |
 |
 |
| Parameter | Plot |
|---|---|
| CZT HV Monitor | 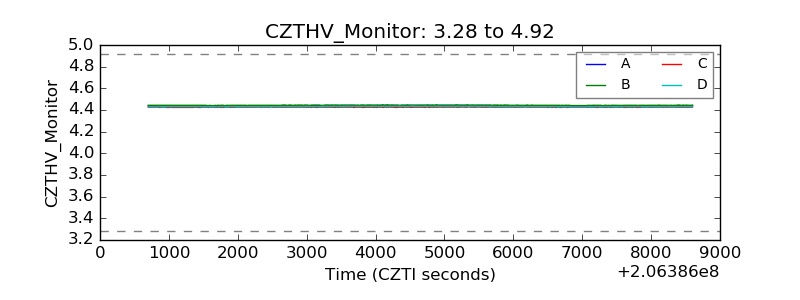 |
| D_VDD | 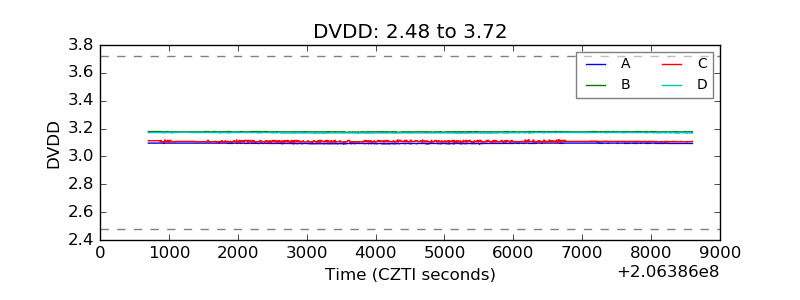 |
| Temperature 1 | 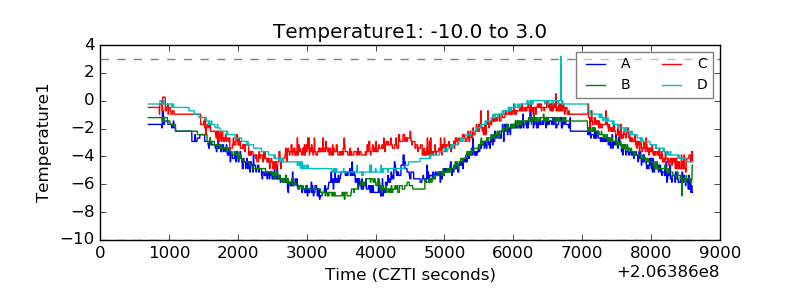 |
| Veto HV Monitor | 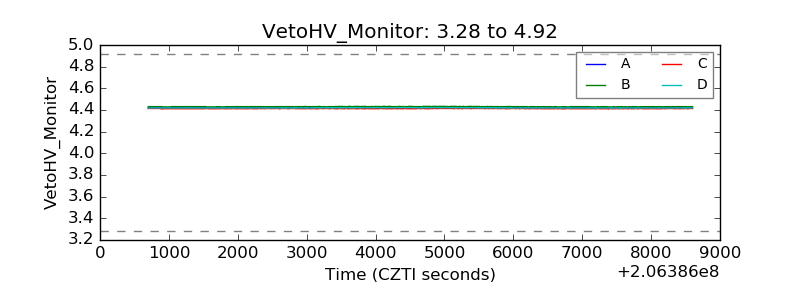 |
| Veto LLD | 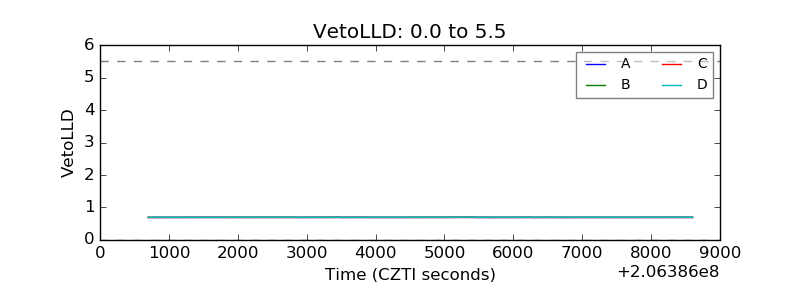 |
| Alpha Counter |  |
| _CPM_Rate |  |
| CZT Counter | 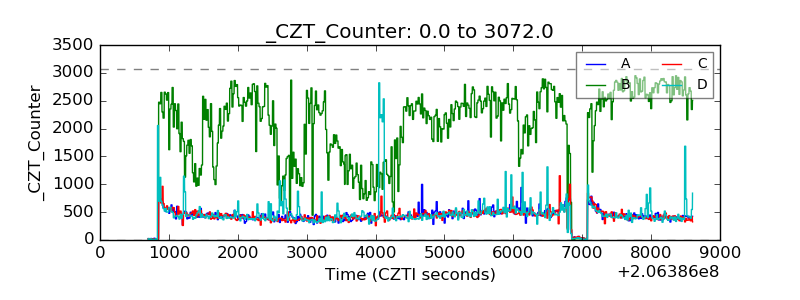 |
| +2.5 Volts monitor |  |
| +5 Volts monitor |  |
| _ROLL_ROT | 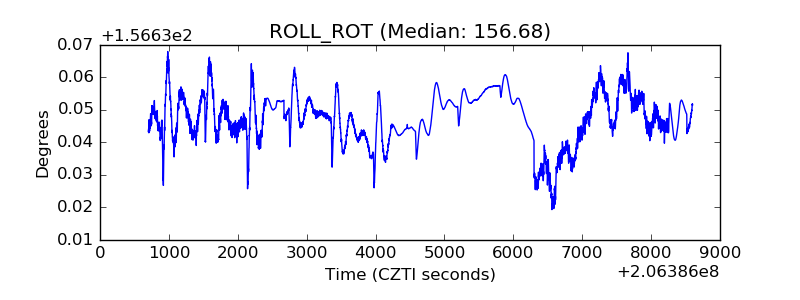 |
| _Roll_DEC | 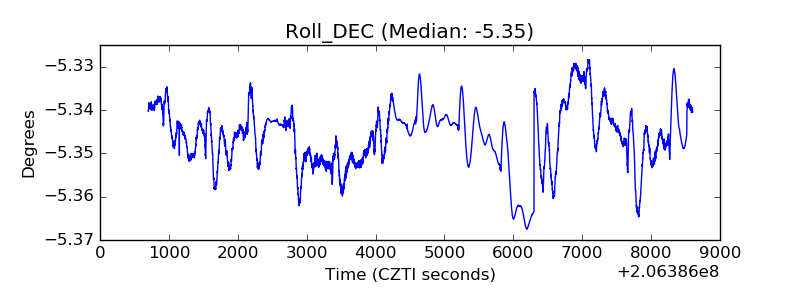 |
| _Roll_RA | 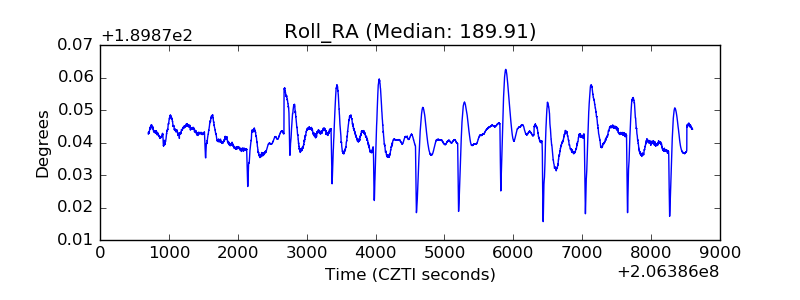 |
| Veto Counter | 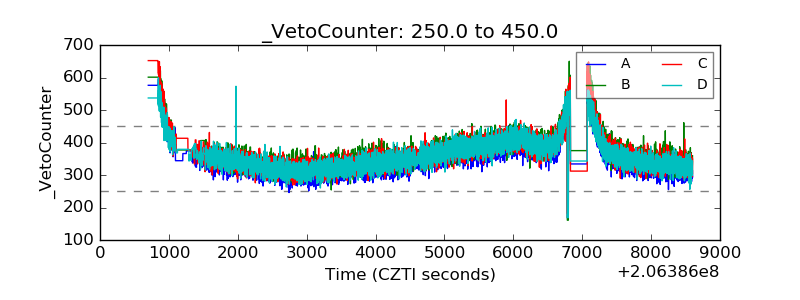 |