| Param | Original file | Final file |
|---|---|---|
| Filename | modeM0/AS1G05_219T01_9000000540_04333cztM0_level2.evt | modeM0/AS1G05_219T01_9000000540_04333cztM0_level2_quad_clean.evt |
| Size (bytes) | 1,379,448,000 | 120,058,560 |
| Size | 1.3 GB | 114.5 MB |
| Events in quadrant A | 5,719,391 | 794,344 |
| Events in quadrant B | 22,933,790 | 442,277 |
| Events in quadrant C | 5,560,053 | 776,628 |
| Events in quadrant D | 6,713,329 | 748,658 |
| Mode SS | |||
|---|---|---|---|
| Quadrant | BADHDUFLAG | Total packets | Discarded packets |
| A | 0 | 260 | 4 |
| B | 0 | 260 | 0 |
| C | 0 | 260 | 0 |
| D | 0 | 260 | 0 |
| Mode M9 | |||
|---|---|---|---|
| Quadrant | BADHDUFLAG | Total packets | Discarded packets |
| A | 0 | 4 | 0 |
| B | 0 | 4 | 0 |
| C | 0 | 4 | 0 |
| D | 0 | 4 | 0 |
| Mode M0 | |||
|---|---|---|---|
| Quadrant | BADHDUFLAG | Total packets | Discarded packets |
| A | 0 | 26075 | 95 |
| B | 0 | 77869 | 1030 |
| C | 0 | 25907 | 105 |
| D | 0 | 29603 | 186 |
| Quadrant | Total seconds | Saturated seconds | Saturation percentage |
|---|---|---|---|
| A | 12628 | 69 | 0.546405% |
| B | 12519 | 6534 | 52.192667% |
| C | 12624 | 20 | 0.158428% |
| D | 12601 | 112 | 0.888818% |
Noise dominated data is calculated using 1-second bins in cleaned event files. If a bin has >2000 counts, and if more than 50% of those come from <1% of pixels, then it is considered to be noise-dominated and hence unusable.
| Quadrant | # 1 sec bins | Bins with >0 counts | Bins with >2000 counts | High rate bins dominated by noise | Noise dominated (total time) | Noise dominated (detector-on time) | Marked lightcurve |
|---|---|---|---|---|---|---|---|
| A | 13203 | 12676 | 5 | 5 | 0.04% | 0.04% | 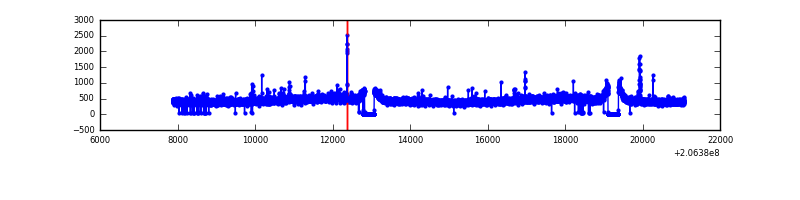 |
| B | 13203 | 12594 | 6079 | 6079 | 46.04% | 48.27% | 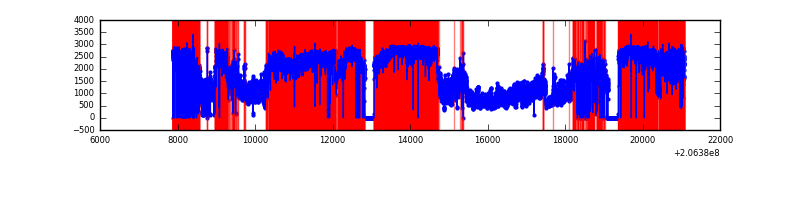 |
| C | 13203 | 12675 | 0 | 0 | 0.00% | 0.00% | 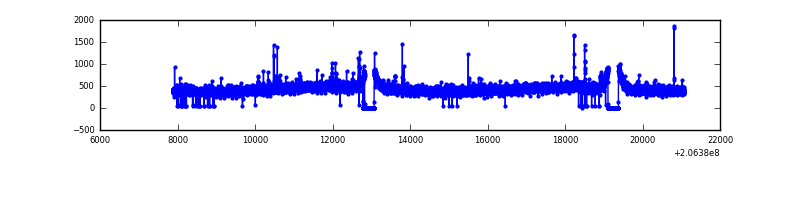 |
| D | 13203 | 12672 | 74 | 74 | 0.56% | 0.58% | 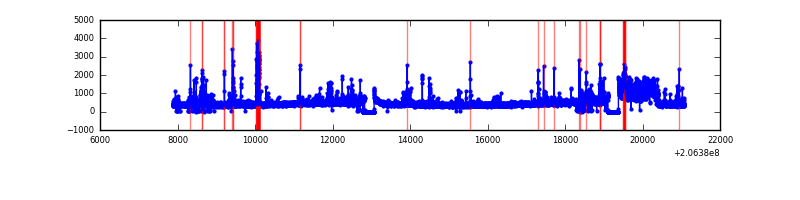 |
Top three noisy pixels from each quadrant. If the there are fewer than three noisy pixels in the level2.evt file, extra rows are filled as -1
| Pixel properties | Quadrant properties | ||||||
|---|---|---|---|---|---|---|---|
| Quadrant | DetID | PixID | Counts | Sigma | Mean | Median | Sigma |
| A | 13 | 251 | 90648 | 301.63 | 1444 | 1412 | 295.8 |
| A | 15 | 234 | 31594 | 102.02 | 1444 | 1412 | 295.8 |
| A | 8 | 15 | 31575 | 101.95 | 1444 | 1412 | 295.8 |
| B | 3 | 0 | 18372136 | 89171.97 | 1078 | 1054 | 206.0 |
| B | 14 | 167 | 127590 | 614.2 | 1078 | 1054 | 206.0 |
| B | 4 | 48 | 110473 | 531.11 | 1078 | 1054 | 206.0 |
| C | 9 | 247 | 47280 | 141.15 | 1391 | 1397 | 325.1 |
| C | 9 | 16 | 36426 | 107.76 | 1391 | 1397 | 325.1 |
| C | 8 | 128 | 17122 | 48.38 | 1391 | 1397 | 325.1 |
| D | 13 | 53 | 809751 | 2374.32 | 1384 | 1340 | 340.5 |
| D | 2 | 136 | 182589 | 532.33 | 1384 | 1340 | 340.5 |
| D | 2 | 37 | 121576 | 353.14 | 1384 | 1340 | 340.5 |
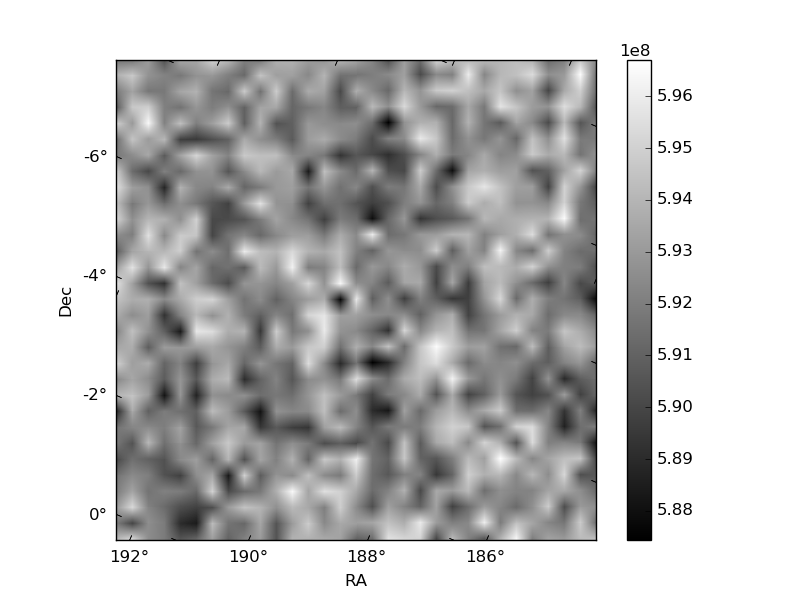
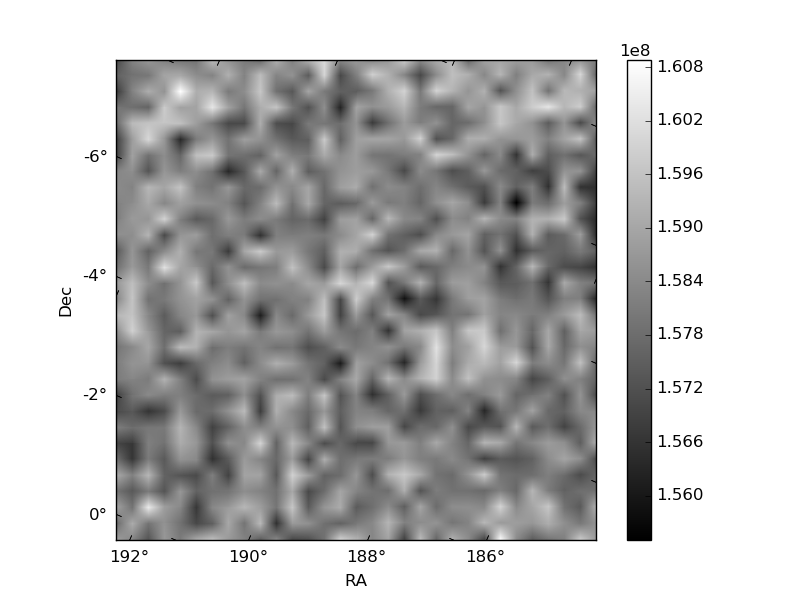
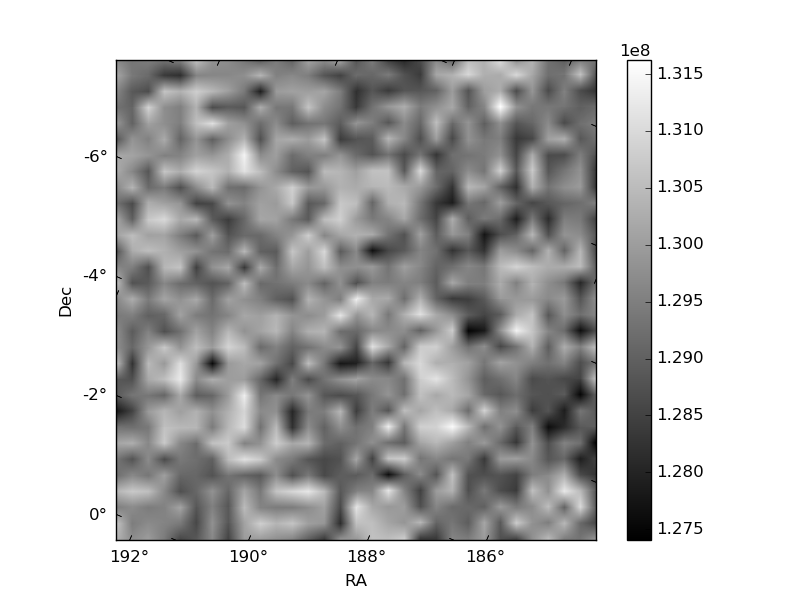
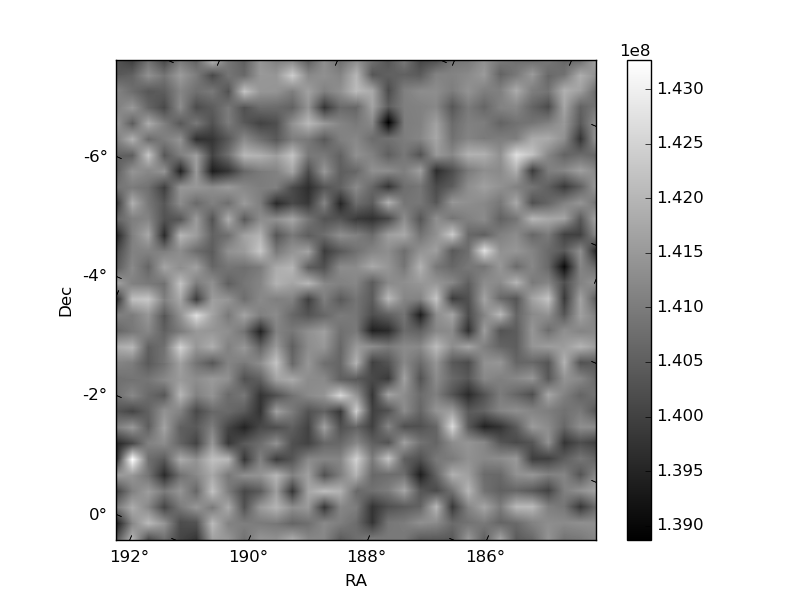
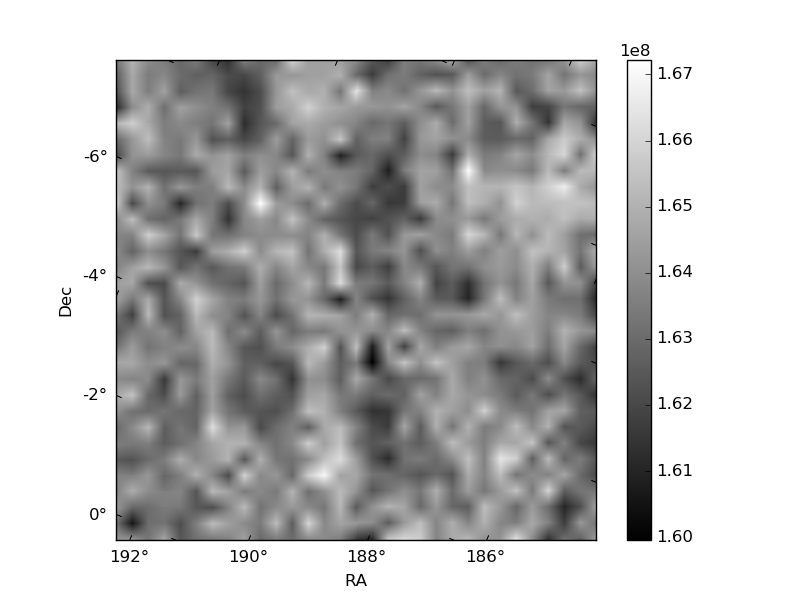
Histogram calculated using DETX and DETY for each event in the final _common_clean file
| Quadrant A | 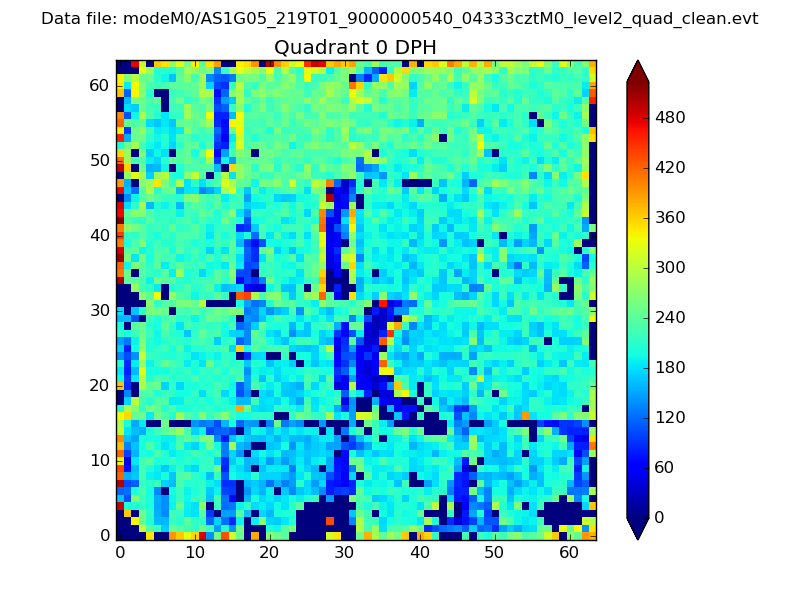 |
 |
Quadrant B |
|---|---|---|---|
| Quadrant D | 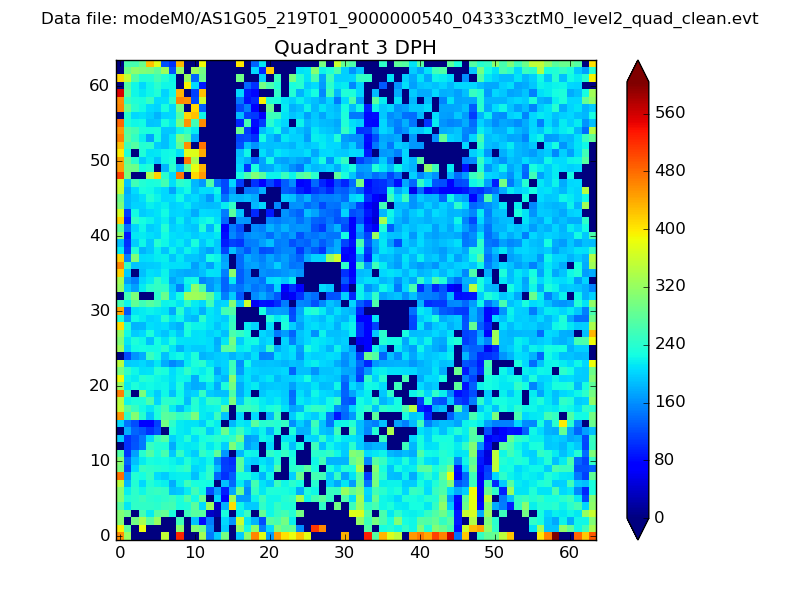 |
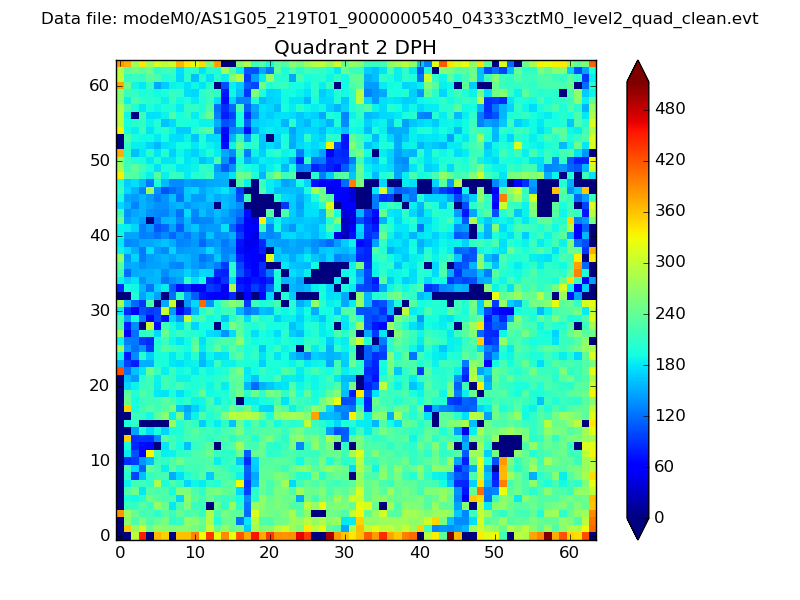 |
Quadrant C |
| Plot type | Count rate plots | Images |
|---|---|---|
| Comparison with Poisson distribution Blue bars denote a histogram of data divided into 1 sec bins. Red curve is a Poisson curve with rate = median count rate of data. |
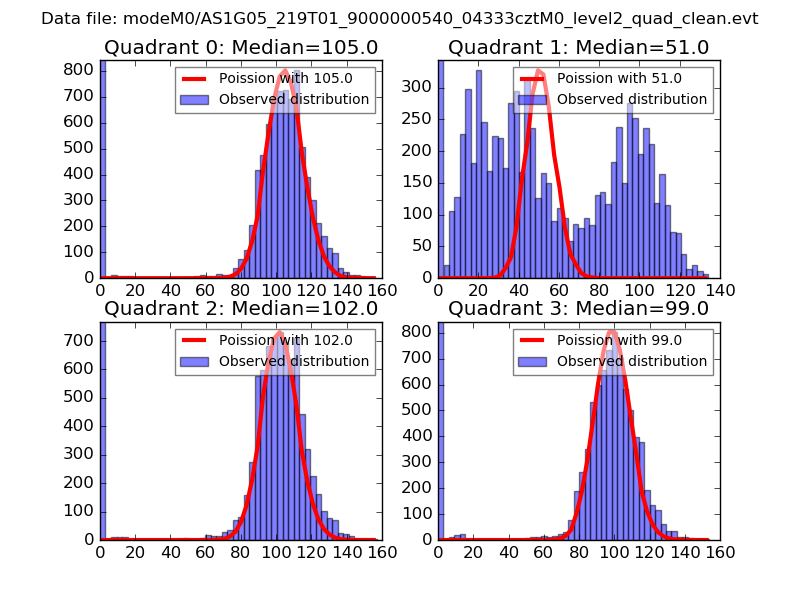 |
 |
| Quadrant-wise count rates Data is divided into 100 sec bins |
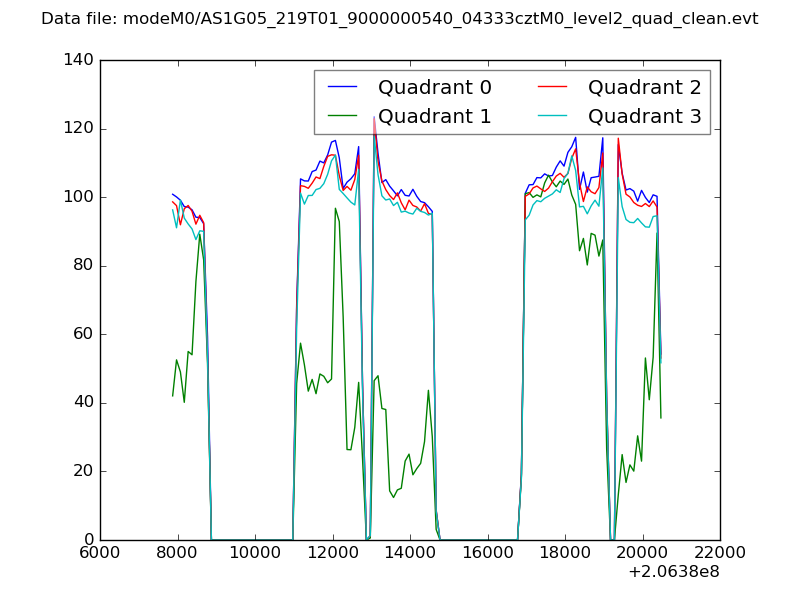 |
|
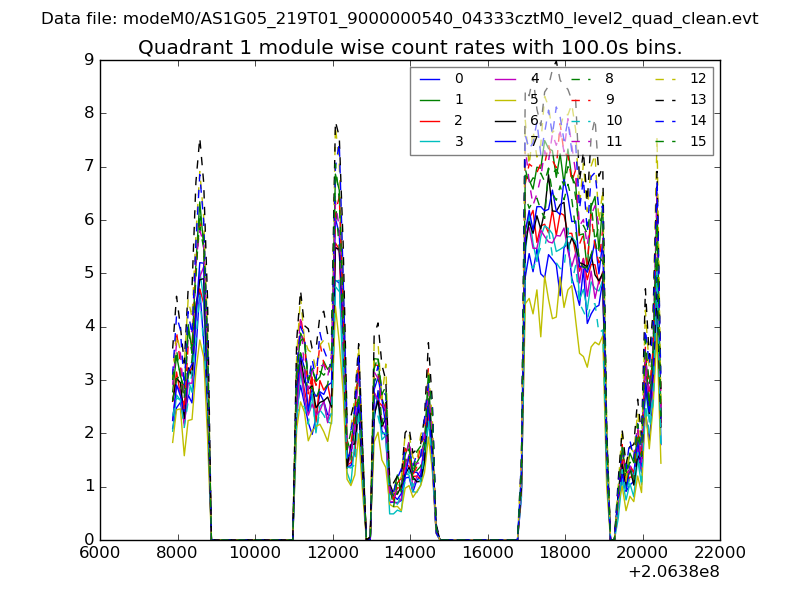
| Module-wise count rates for Quadrant A Data is divided into 100 sec bins |
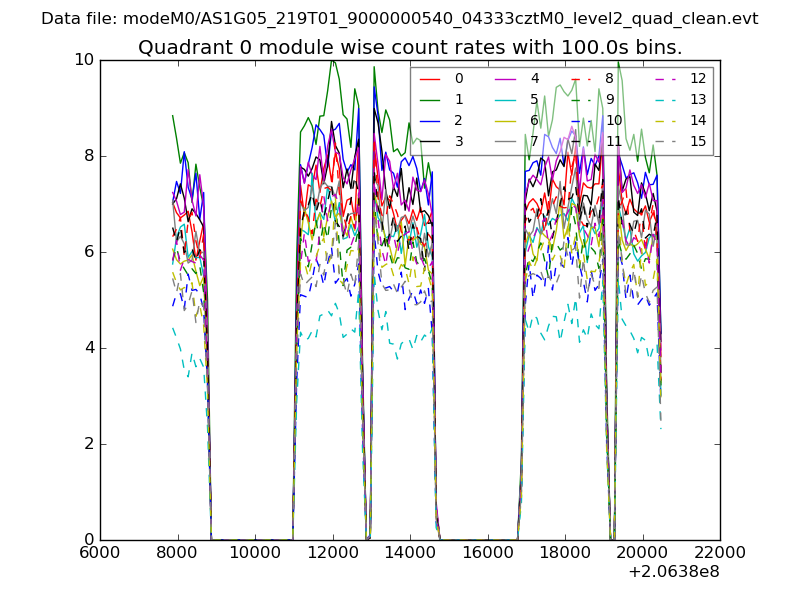 |
 |
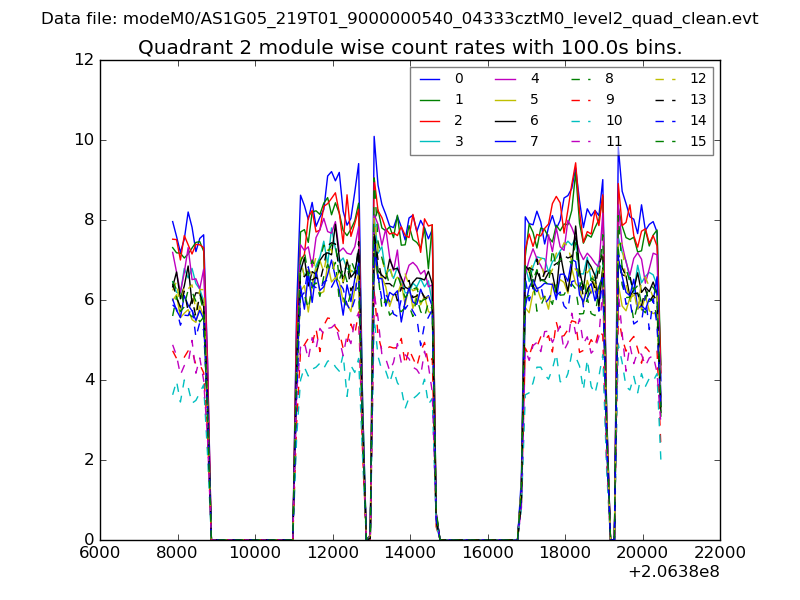
| Module-wise count rates for Quadrant B Data is divided into 100 sec bins |
 |
 |
| Module-wise count rates for Quadrant C Data is divided into 100 sec bins |
 |
 |
| Module-wise count rates for Quadrant D Data is divided into 100 sec bins |
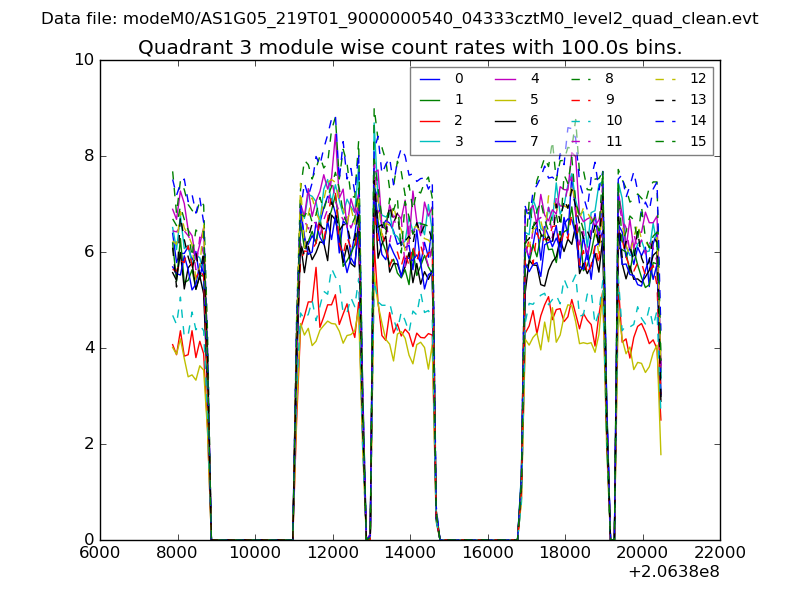 |
 |
| Parameter | Plot |
|---|---|
| CZT HV Monitor | 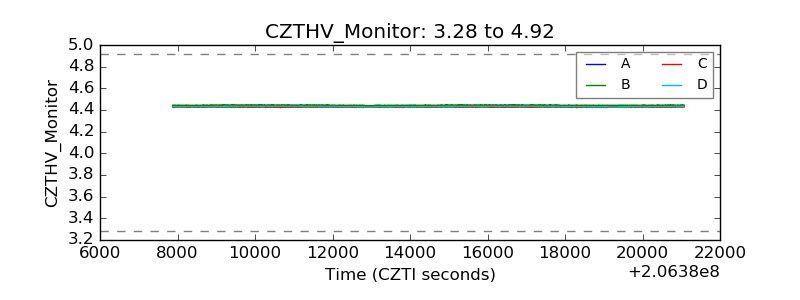 |
| D_VDD | 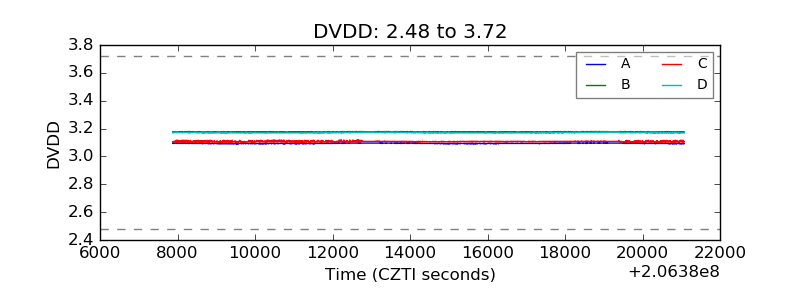 |
| Temperature 1 | 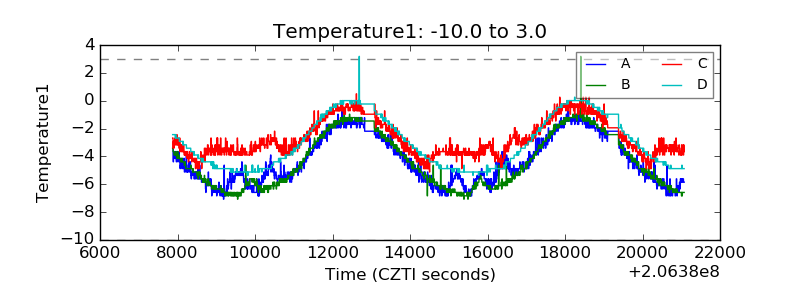 |
| Veto HV Monitor | 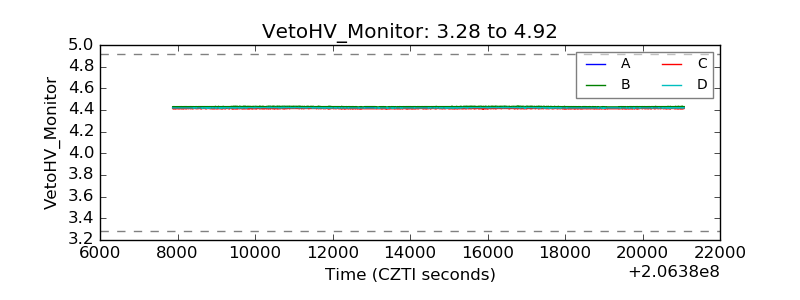 |
| Veto LLD | 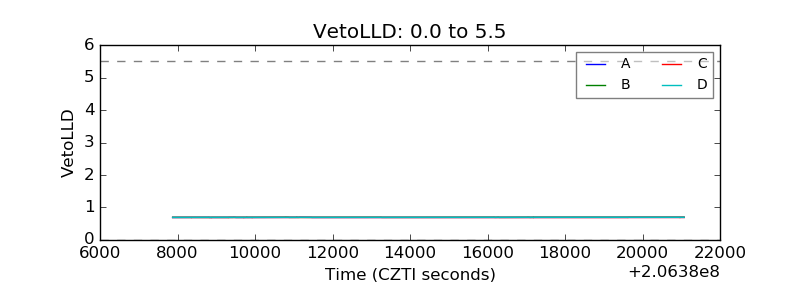 |
| Alpha Counter | 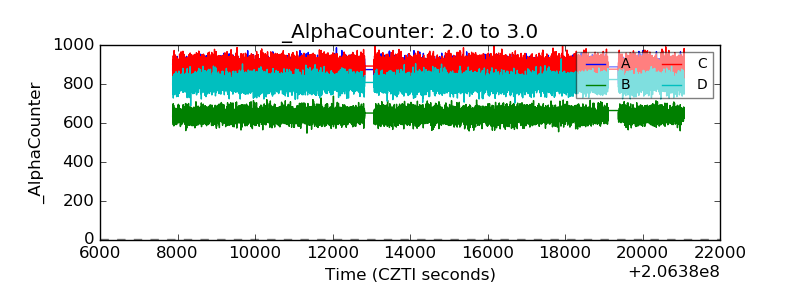 |
| _CPM_Rate | 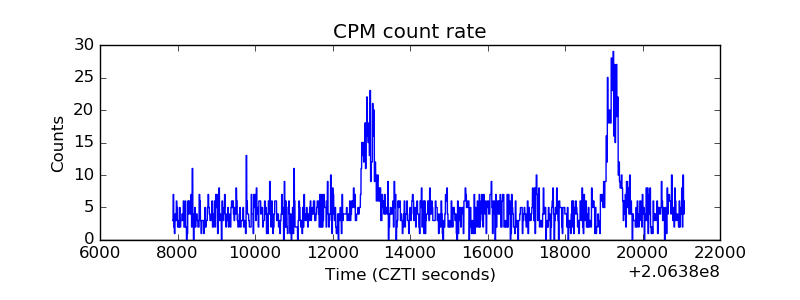 |
| CZT Counter | 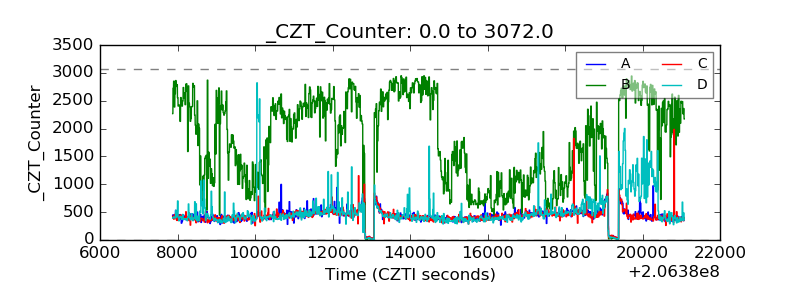 |
| +2.5 Volts monitor |  |
| +5 Volts monitor | 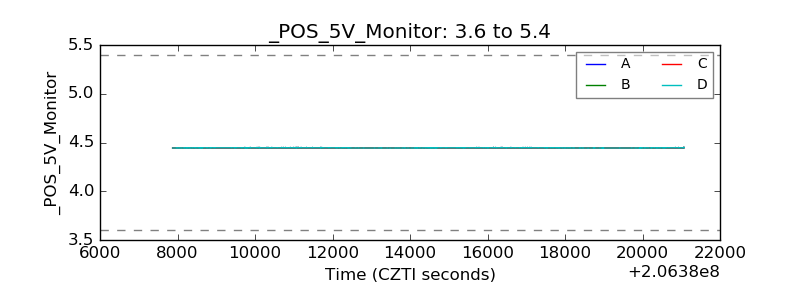 |
| _ROLL_ROT | 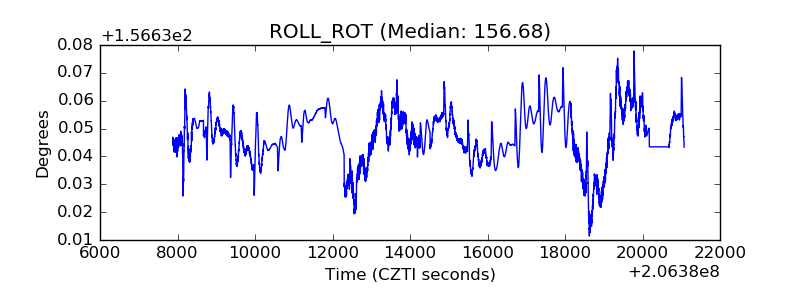 |
| _Roll_DEC | 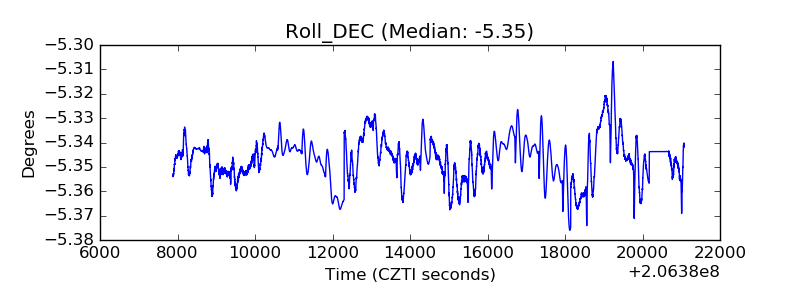 |
| _Roll_RA | 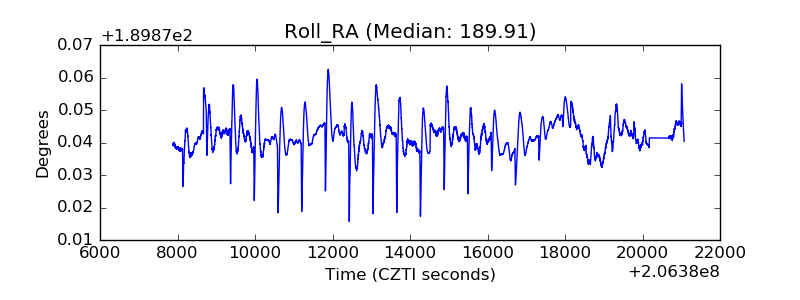 |
| Veto Counter | 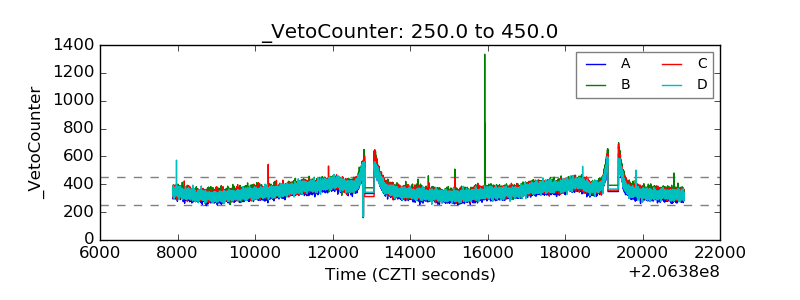 |