| Param | Original file | Final file |
|---|---|---|
| Filename | modeM0/AS1G05_219T01_9000000540_04336cztM0_level2.evt | modeM0/AS1G05_219T01_9000000540_04336cztM0_level2_quad_clean.evt |
| Size (bytes) | 2,297,779,200 | 160,182,720 |
| Size | 2.1 GB | 152.8 MB |
| Events in quadrant A | 8,341,916 | 1,064,389 |
| Events in quadrant B | 42,158,805 | 460,688 |
| Events in quadrant C | 8,106,169 | 1,045,839 |
| Events in quadrant D | 9,742,872 | 1,008,009 |
| Mode SS | |||
|---|---|---|---|
| Quadrant | BADHDUFLAG | Total packets | Discarded packets |
| A | 0 | 374 | 2 |
| B | 0 | 374 | 2 |
| C | 0 | 374 | 2 |
| D | 0 | 374 | 0 |
| Mode M9 | |||
|---|---|---|---|
| Quadrant | BADHDUFLAG | Total packets | Discarded packets |
| A | 0 | 21 | 0 |
| B | 0 | 21 | 0 |
| C | 0 | 21 | 1 |
| D | 0 | 21 | 0 |
| Mode M0 | |||
|---|---|---|---|
| Quadrant | BADHDUFLAG | Total packets | Discarded packets |
| A | 0 | 38062 | 157 |
| B | 0 | 140323 | 2797 |
| C | 0 | 37797 | 154 |
| D | 0 | 42840 | 198 |
| Quadrant | Total seconds | Saturated seconds | Saturation percentage |
|---|---|---|---|
| A | 18463 | 131 | 0.709527% |
| B | 18211 | 14764 | 81.071880% |
| C | 18460 | 92 | 0.498375% |
| D | 18449 | 230 | 1.246680% |
Noise dominated data is calculated using 1-second bins in cleaned event files. If a bin has >2000 counts, and if more than 50% of those come from <1% of pixels, then it is considered to be noise-dominated and hence unusable.
| Quadrant | # 1 sec bins | Bins with >0 counts | Bins with >2000 counts | High rate bins dominated by noise | Noise dominated (total time) | Noise dominated (detector-on time) | Marked lightcurve |
|---|---|---|---|---|---|---|---|
| A | 20420 | 18531 | 6 | 6 | 0.03% | 0.03% | 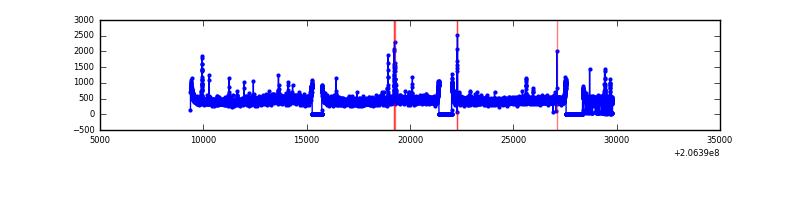 |
| B | 20418 | 18211 | 14267 | 14267 | 69.87% | 78.34% | 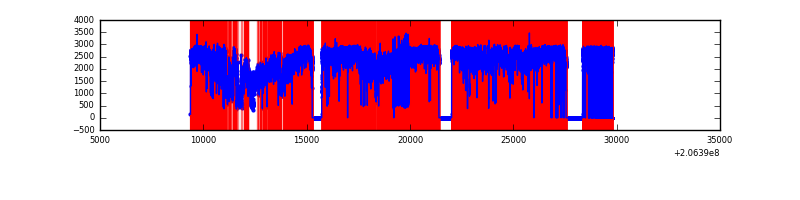 |
| C | 20420 | 18534 | 1 | 1 | 0.00% | 0.01% | 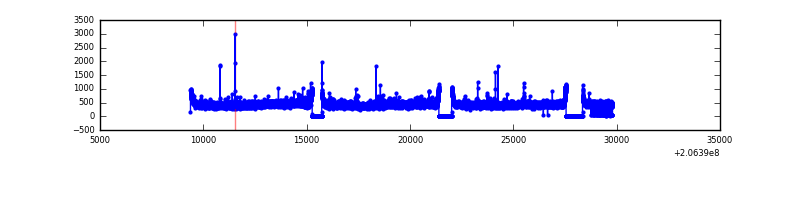 |
| D | 20420 | 18527 | 114 | 114 | 0.56% | 0.62% | 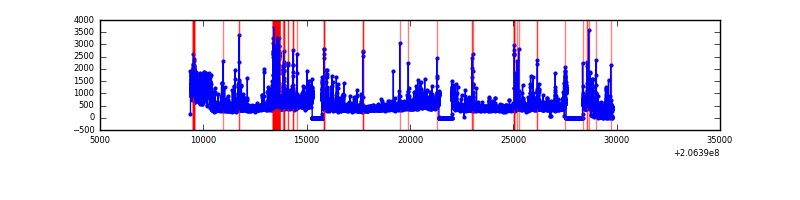 |
Top three noisy pixels from each quadrant. If the there are fewer than three noisy pixels in the level2.evt file, extra rows are filled as -1
| Pixel properties | Quadrant properties | ||||||
|---|---|---|---|---|---|---|---|
| Quadrant | DetID | PixID | Counts | Sigma | Mean | Median | Sigma |
| A | 0 | 50 | 62321 | 139.15 | 2116 | 2070 | 433.0 |
| A | 13 | 251 | 51997 | 115.31 | 2116 | 2070 | 433.0 |
| A | 15 | 234 | 37277 | 81.31 | 2116 | 2070 | 433.0 |
| B | 3 | 0 | 37180380 | 169994.29 | 1156 | 1131 | 218.7 |
| B | 15 | 204 | 176636 | 802.46 | 1156 | 1131 | 218.7 |
| B | 4 | 48 | 95294 | 430.54 | 1156 | 1131 | 218.7 |
| C | 9 | 16 | 75162 | 153.17 | 2044 | 2053 | 477.3 |
| C | 9 | 247 | 17249 | 31.84 | 2044 | 2053 | 477.3 |
| C | 13 | 61 | 16938 | 31.19 | 2044 | 2053 | 477.3 |
| D | 13 | 53 | 830264 | 1685.13 | 2026 | 1967 | 491.5 |
| D | 4 | 95 | 390459 | 790.37 | 2026 | 1967 | 491.5 |
| D | 2 | 136 | 198998 | 400.85 | 2026 | 1967 | 491.5 |
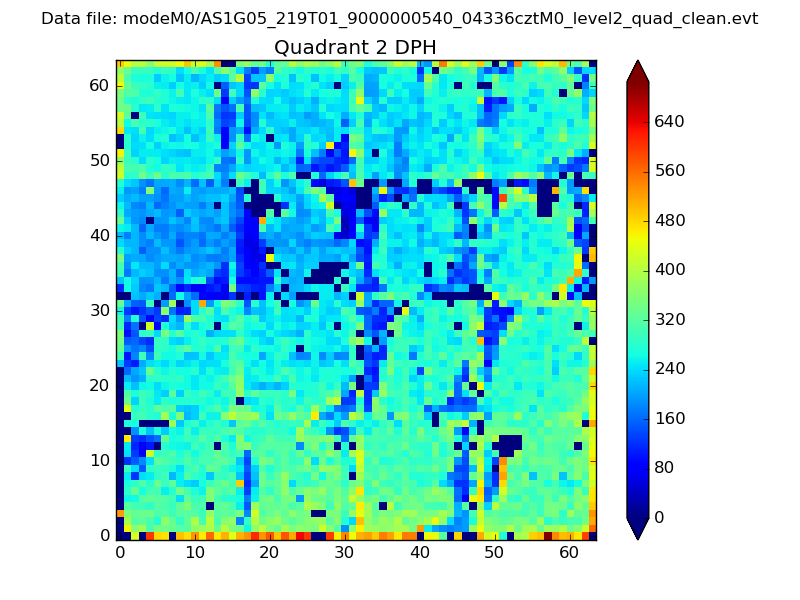
Histogram calculated using DETX and DETY for each event in the final _common_clean file
| Quadrant A | 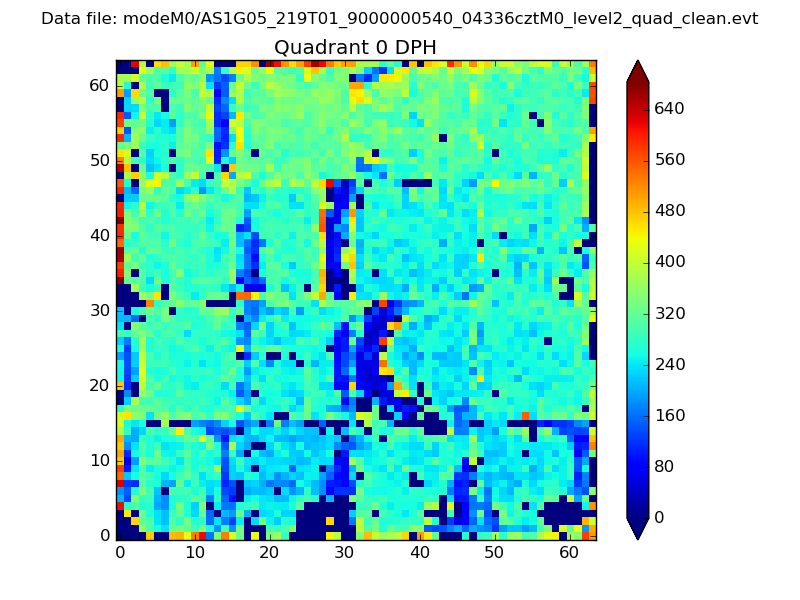 |
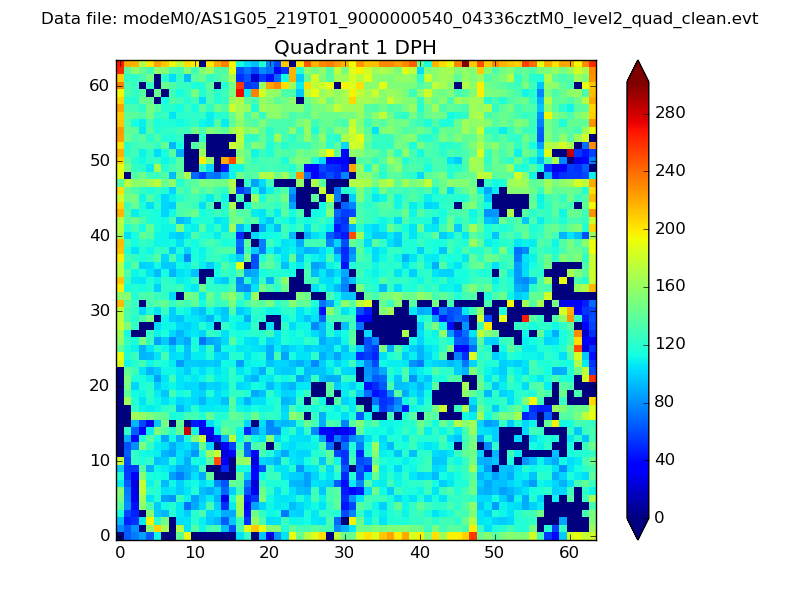 |
Quadrant B |
|---|---|---|---|
| Quadrant D | 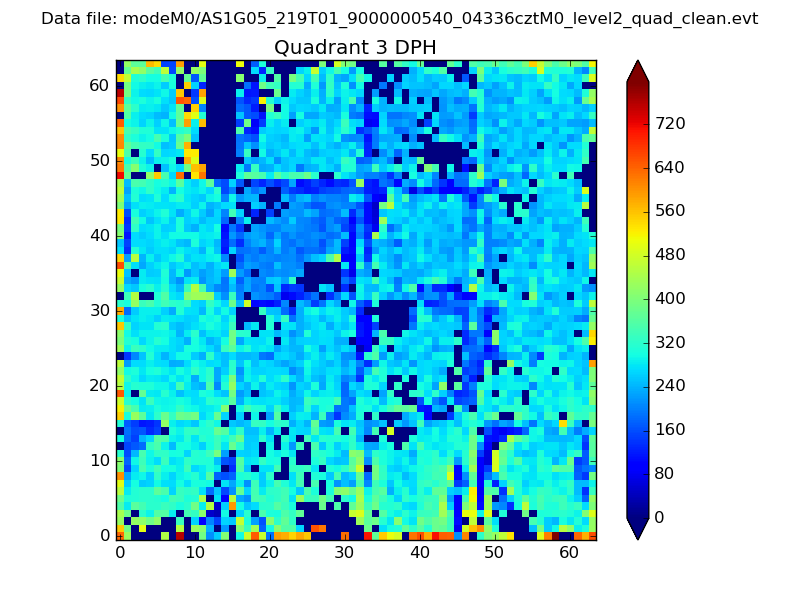 |
 |
Quadrant C |
| Plot type | Count rate plots | Images |
|---|---|---|
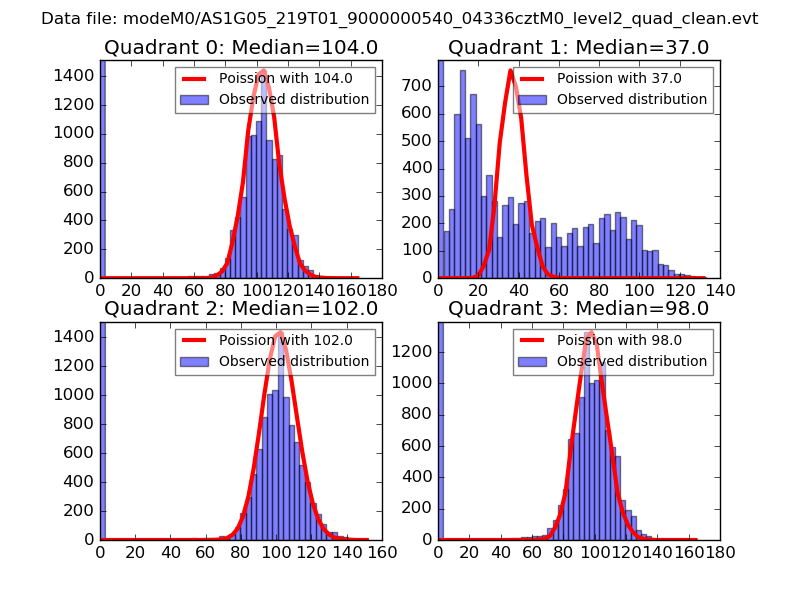
| Comparison with Poisson distribution Blue bars denote a histogram of data divided into 1 sec bins. Red curve is a Poisson curve with rate = median count rate of data. |
 |
 |
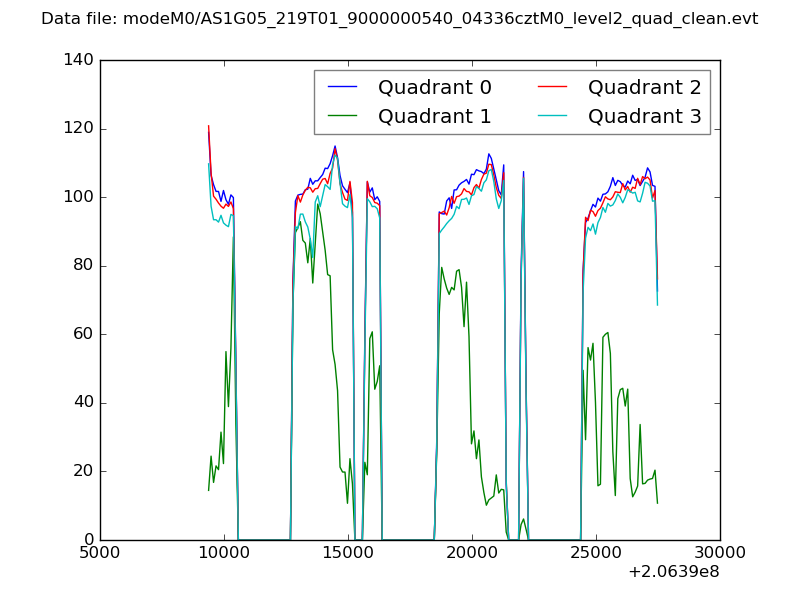
| Quadrant-wise count rates Data is divided into 100 sec bins |
 |
|
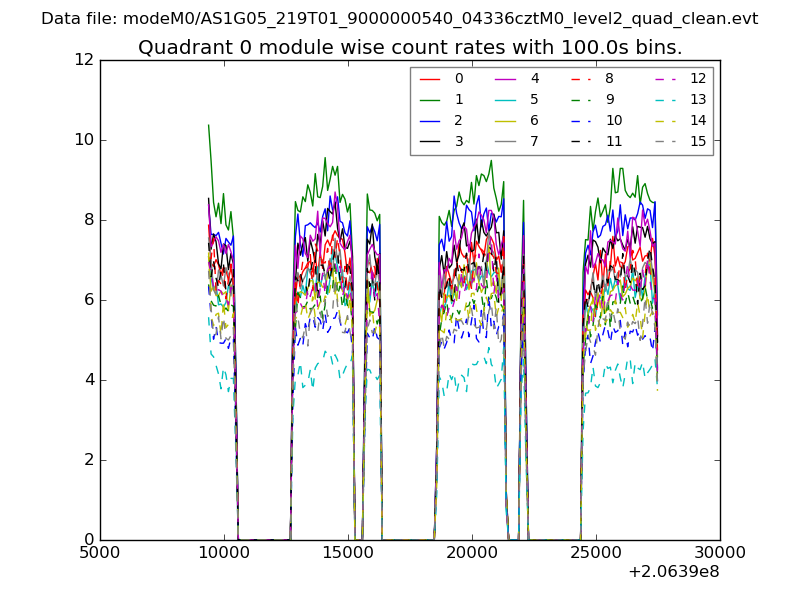
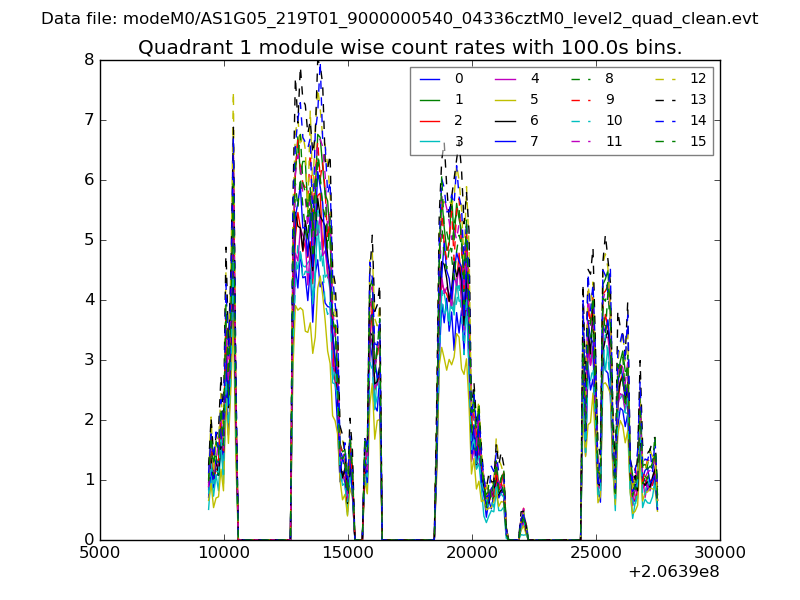
| Module-wise count rates for Quadrant A Data is divided into 100 sec bins |
 |
 |
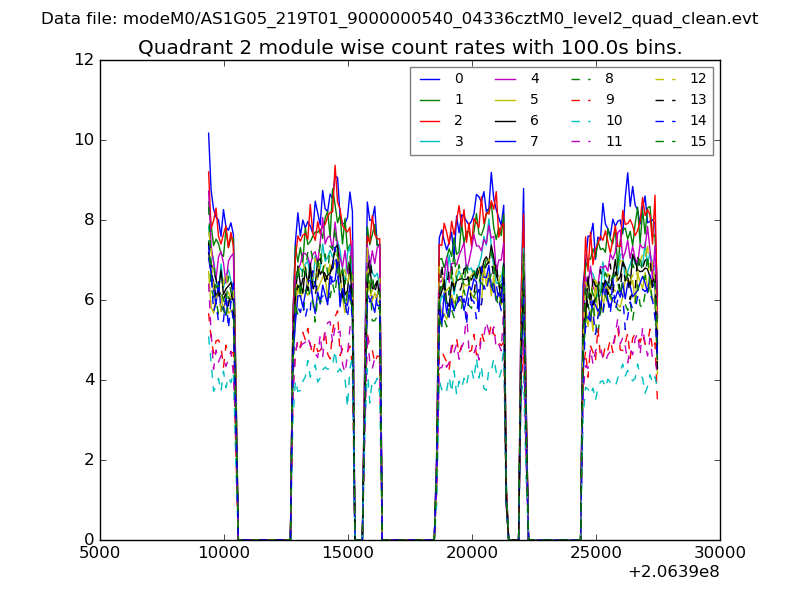
| Module-wise count rates for Quadrant B Data is divided into 100 sec bins |
 |
 |
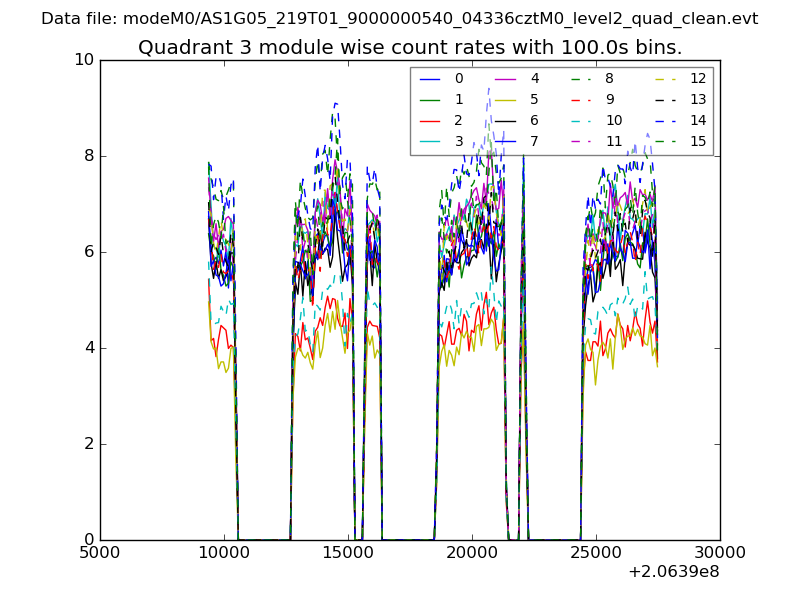
| Module-wise count rates for Quadrant C Data is divided into 100 sec bins |
 |
 |
| Module-wise count rates for Quadrant D Data is divided into 100 sec bins |
 |
 |
| Parameter | Plot |
|---|---|
| CZT HV Monitor | 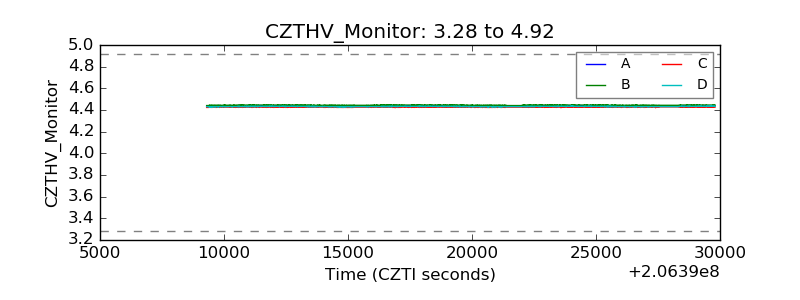 |
| D_VDD | 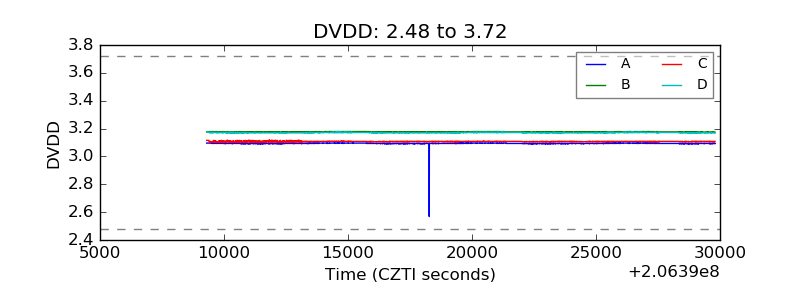 |
| Temperature 1 | 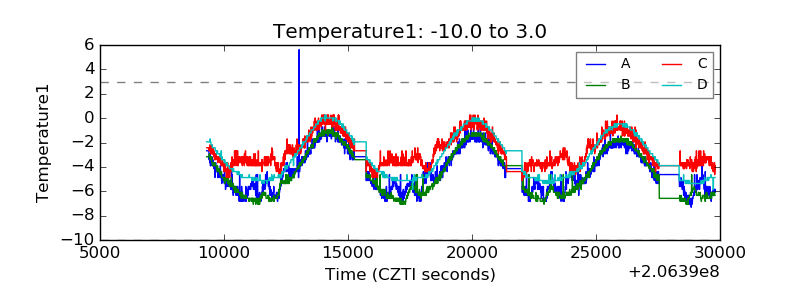 |
| Veto HV Monitor | 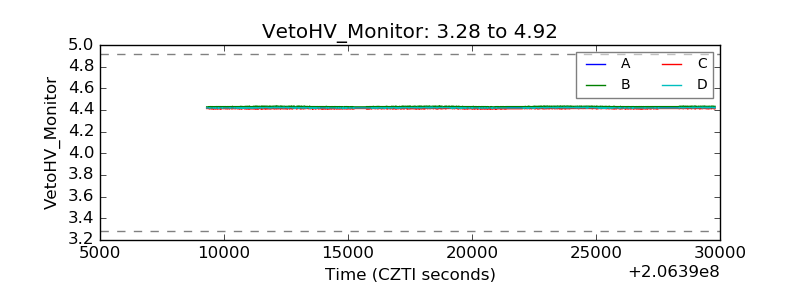 |
| Veto LLD | 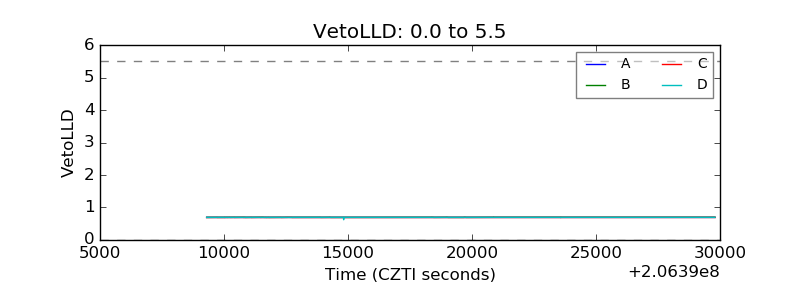 |
| Alpha Counter | 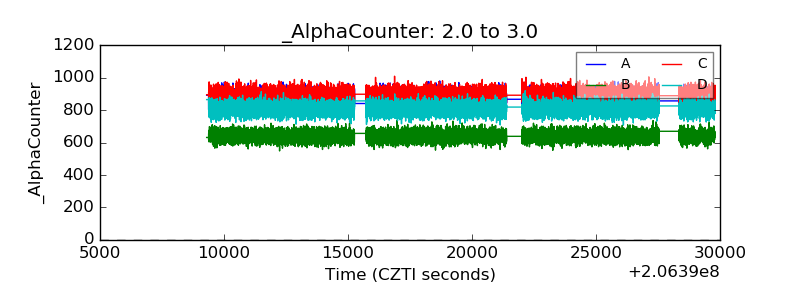 |
| _CPM_Rate |  |
| CZT Counter | 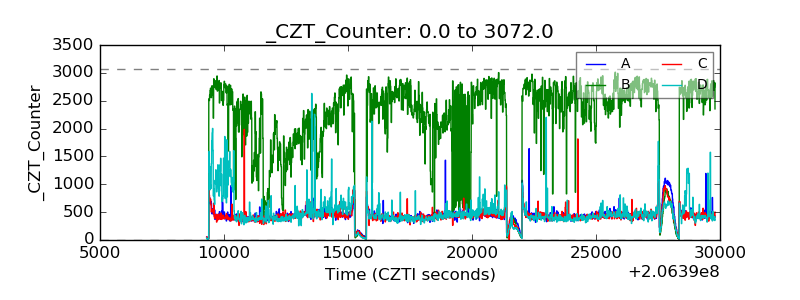 |
| +2.5 Volts monitor |  |
| +5 Volts monitor |  |
| _ROLL_ROT | 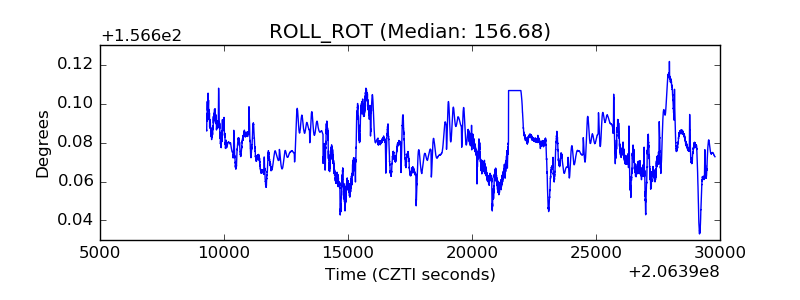 |
| _Roll_DEC | 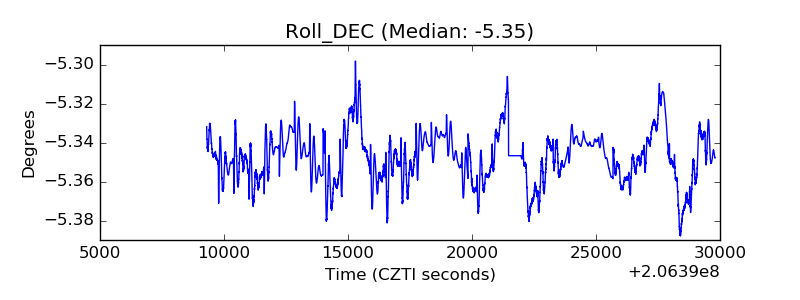 |
| _Roll_RA | 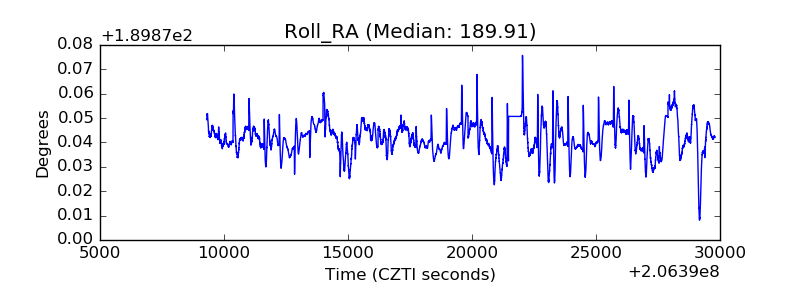 |
| Veto Counter | 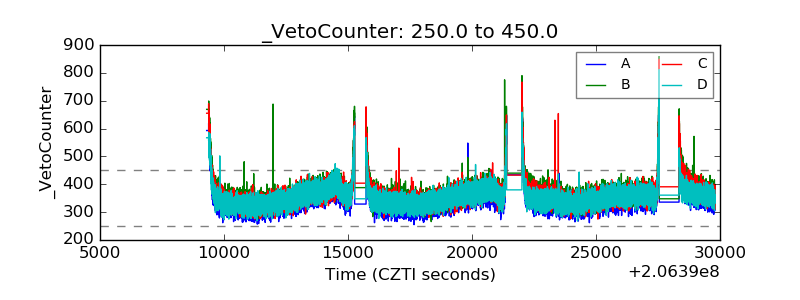 |