| Param | Original file | Final file |
|---|---|---|
| Filename | modeM0/AS1G05_219T01_9000000540_04340cztM0_level2.evt | modeM0/AS1G05_219T01_9000000540_04340cztM0_level2_quad_clean.evt |
| Size (bytes) | 788,834,880 | 64,978,560 |
| Size | 752.3 MB | 62.0 MB |
| Events in quadrant A | 3,147,328 | 459,272 |
| Events in quadrant B | 14,112,333 | 179,366 |
| Events in quadrant C | 2,993,052 | 450,409 |
| Events in quadrant D | 3,210,218 | 436,296 |
| Mode SS | |||
|---|---|---|---|
| Quadrant | BADHDUFLAG | Total packets | Discarded packets |
| A | 0 | 130 | 0 |
| B | 0 | 130 | 0 |
| C | 0 | 130 | 0 |
| D | 0 | 130 | 0 |
| Mode M9 | |||
|---|---|---|---|
| Quadrant | BADHDUFLAG | Total packets | Discarded packets |
| A | 0 | 11 | 0 |
| B | 0 | 11 | 0 |
| C | 0 | 11 | 0 |
| D | 0 | 11 | 0 |
| Mode M0 | |||
|---|---|---|---|
| Quadrant | BADHDUFLAG | Total packets | Discarded packets |
| A | 0 | 13363 | 2 |
| B | 0 | 46218 | 1 |
| C | 0 | 13062 | 1 |
| D | 0 | 13755 | 1 |
| Quadrant | Total seconds | Saturated seconds | Saturation percentage |
|---|---|---|---|
| A | 6300 | 81 | 1.285714% |
| B | 6300 | 4881 | 77.476190% |
| C | 6300 | 66 | 1.047619% |
| D | 6300 | 107 | 1.698413% |
Noise dominated data is calculated using 1-second bins in cleaned event files. If a bin has >2000 counts, and if more than 50% of those come from <1% of pixels, then it is considered to be noise-dominated and hence unusable.
| Quadrant | # 1 sec bins | Bins with >0 counts | Bins with >2000 counts | High rate bins dominated by noise | Noise dominated (total time) | Noise dominated (detector-on time) | Marked lightcurve |
|---|---|---|---|---|---|---|---|
| A | 7470 | 6300 | 6 | 6 | 0.08% | 0.10% | 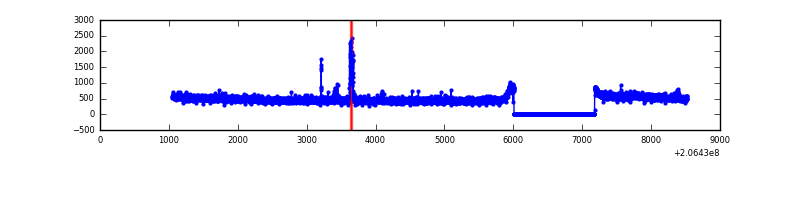 |
| B | 7469 | 6299 | 4511 | 4511 | 60.40% | 71.61% | 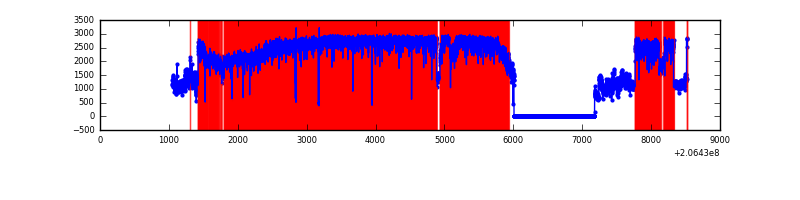 |
| C | 7470 | 6300 | 5 | 5 | 0.07% | 0.08% | 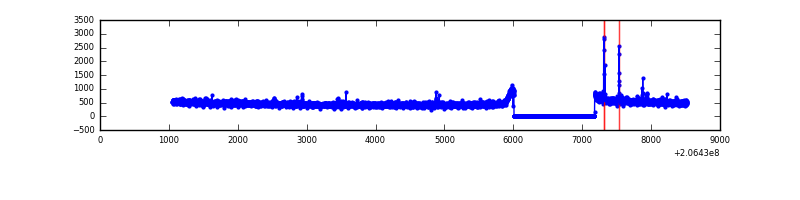 |
| D | 7470 | 6300 | 52 | 52 | 0.70% | 0.83% | 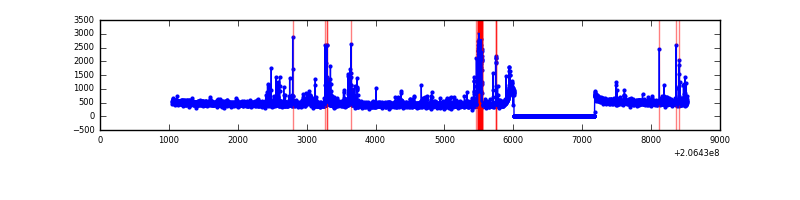 |
Top three noisy pixels from each quadrant. If the there are fewer than three noisy pixels in the level2.evt file, extra rows are filled as -1
| Pixel properties | Quadrant properties | ||||||
|---|---|---|---|---|---|---|---|
| Quadrant | DetID | PixID | Counts | Sigma | Mean | Median | Sigma |
| A | 14 | 111 | 51760 | 317.61 | 787 | 772 | 160.5 |
| A | 15 | 234 | 37052 | 225.99 | 787 | 772 | 160.5 |
| A | 13 | 14 | 13947 | 82.07 | 787 | 772 | 160.5 |
| B | 3 | 0 | 12163872 | 131572.17 | 483 | 474 | 92.4 |
| B | 14 | 167 | 27886 | 296.52 | 483 | 474 | 92.4 |
| B | 4 | 48 | 14470 | 151.4 | 483 | 474 | 92.4 |
| C | 9 | 247 | 27522 | 152.1 | 751 | 755 | 176.0 |
| C | 9 | 16 | 21445 | 117.57 | 751 | 755 | 176.0 |
| C | 8 | 128 | 6273 | 31.35 | 751 | 755 | 176.0 |
| D | 2 | 136 | 187166 | 1029.08 | 753 | 734 | 181.2 |
| D | 14 | 34 | 34065 | 183.98 | 753 | 734 | 181.2 |
| D | 9 | 35 | 31270 | 168.56 | 753 | 734 | 181.2 |
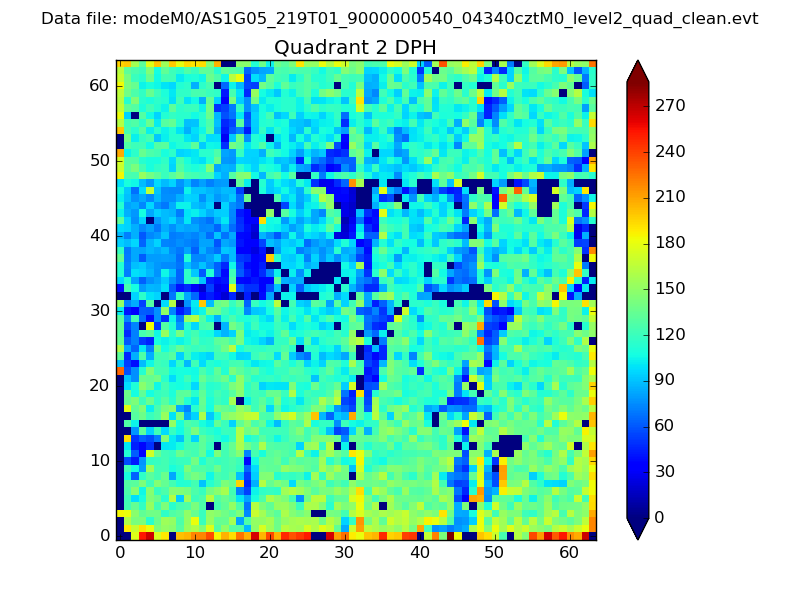
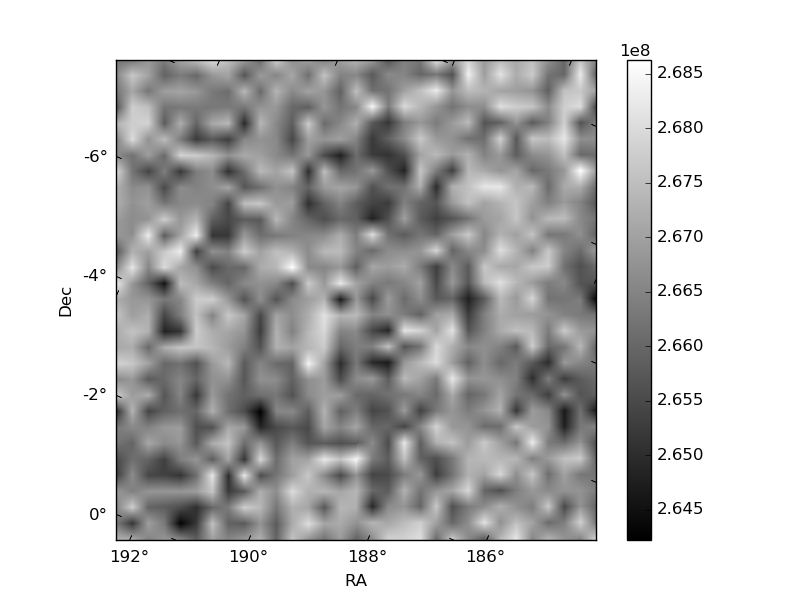
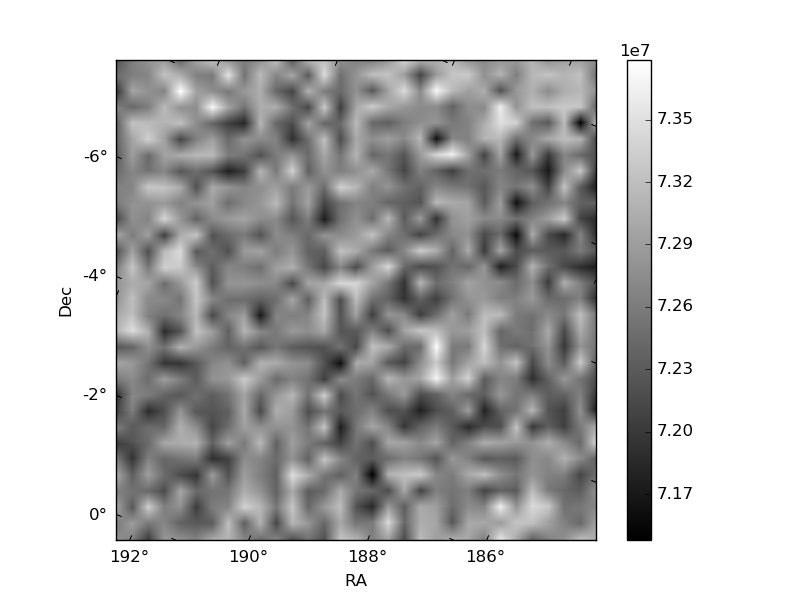
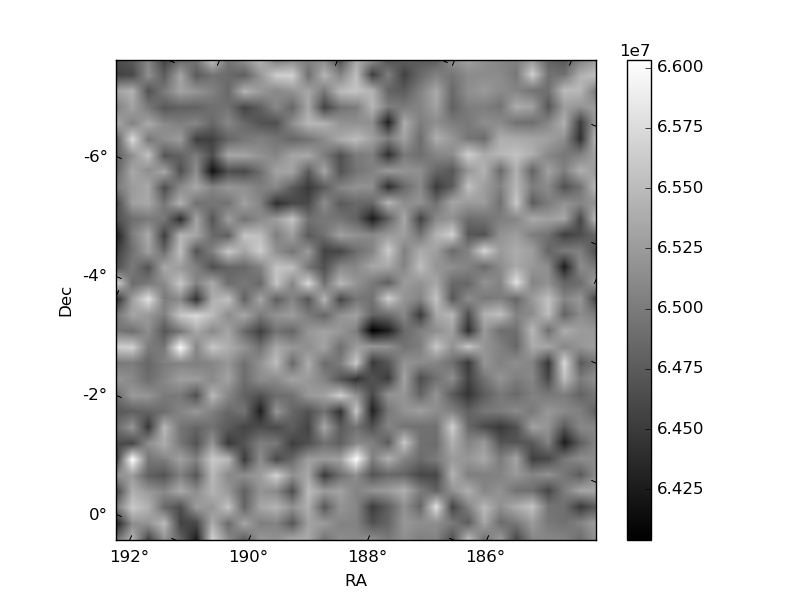
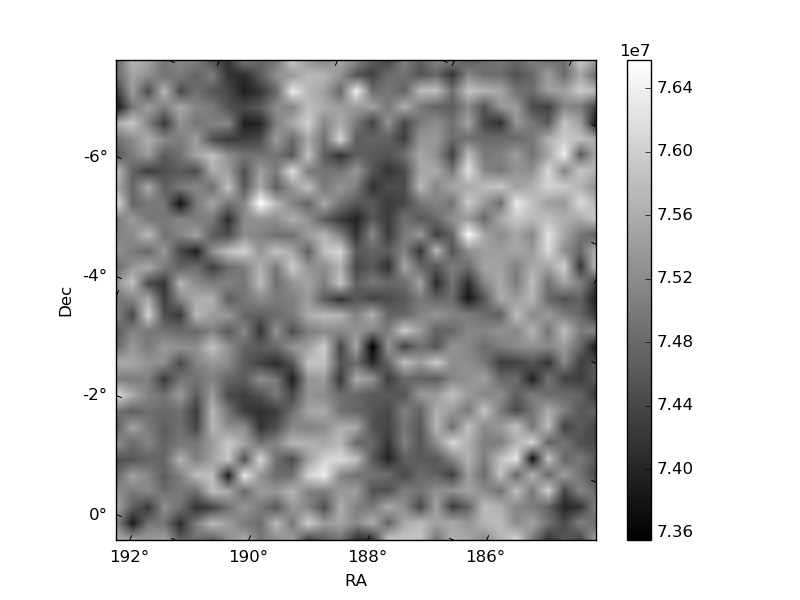
Histogram calculated using DETX and DETY for each event in the final _common_clean file
| Quadrant A | 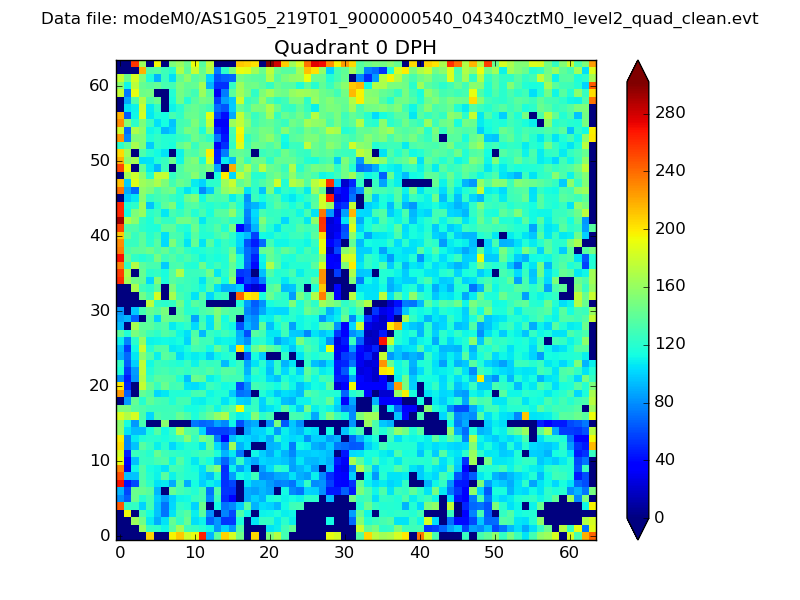 |
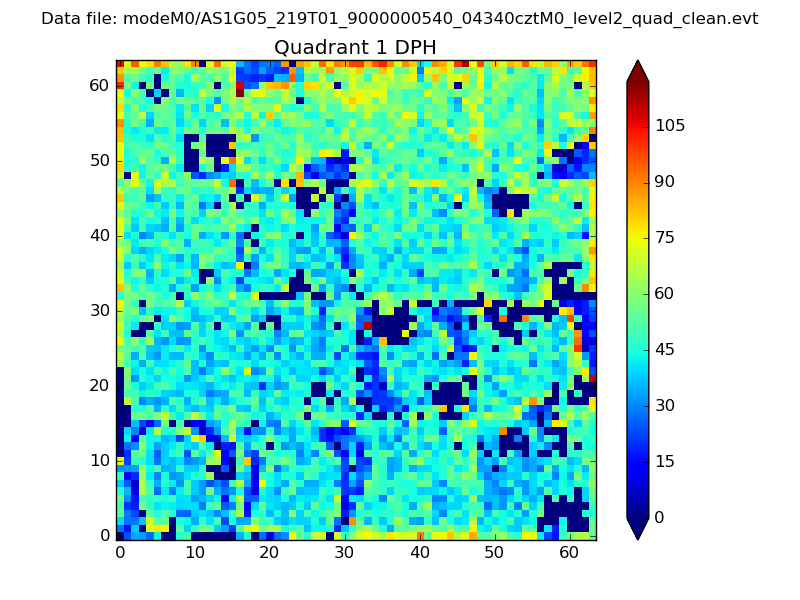 |
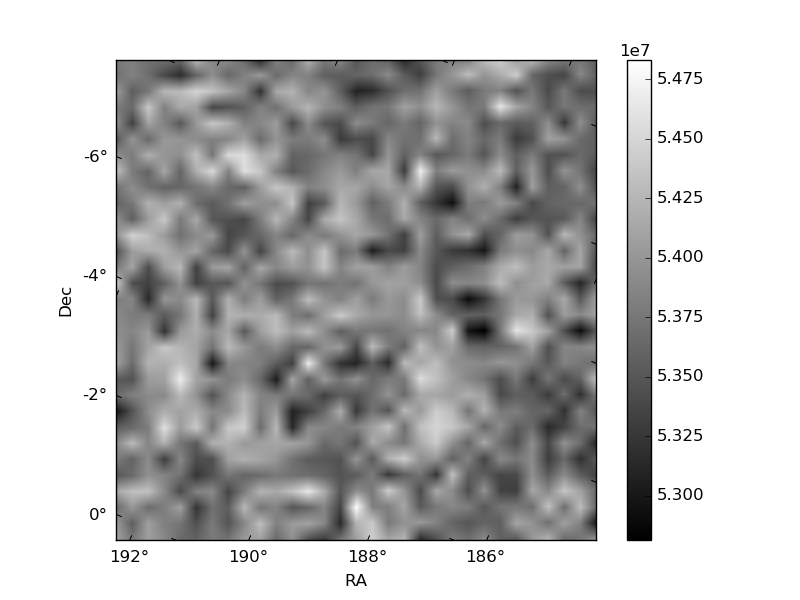
Quadrant B |
|---|---|---|---|
| Quadrant D | 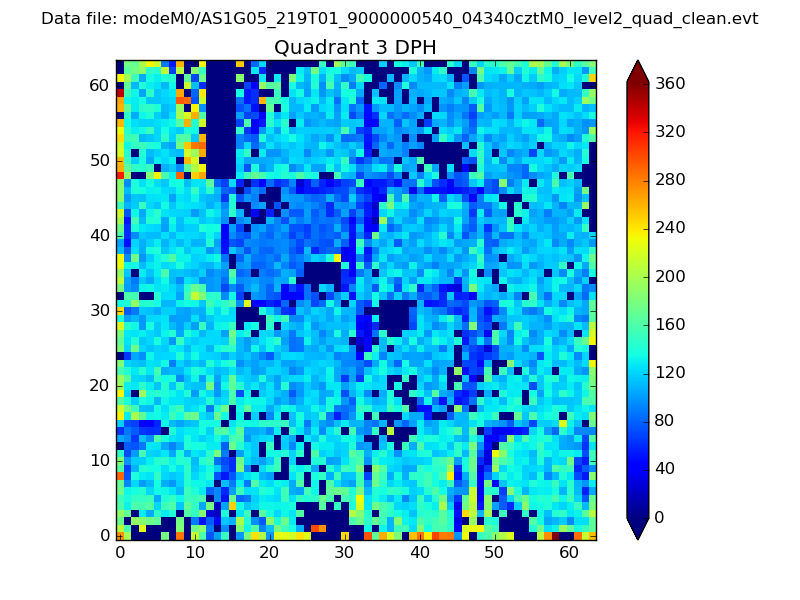 |
 |
Quadrant C |
| Plot type | Count rate plots | Images |
|---|---|---|
| Comparison with Poisson distribution Blue bars denote a histogram of data divided into 1 sec bins. Red curve is a Poisson curve with rate = median count rate of data. |
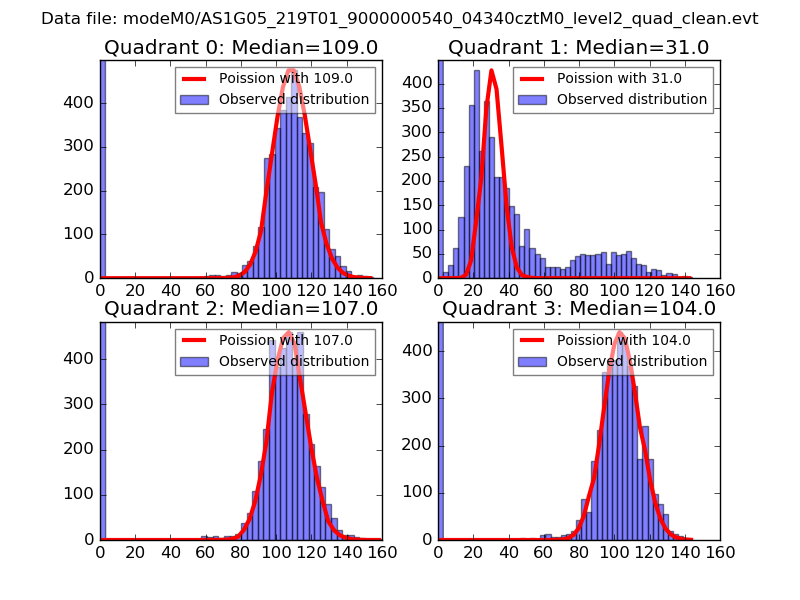 |
 |
| Quadrant-wise count rates Data is divided into 100 sec bins |
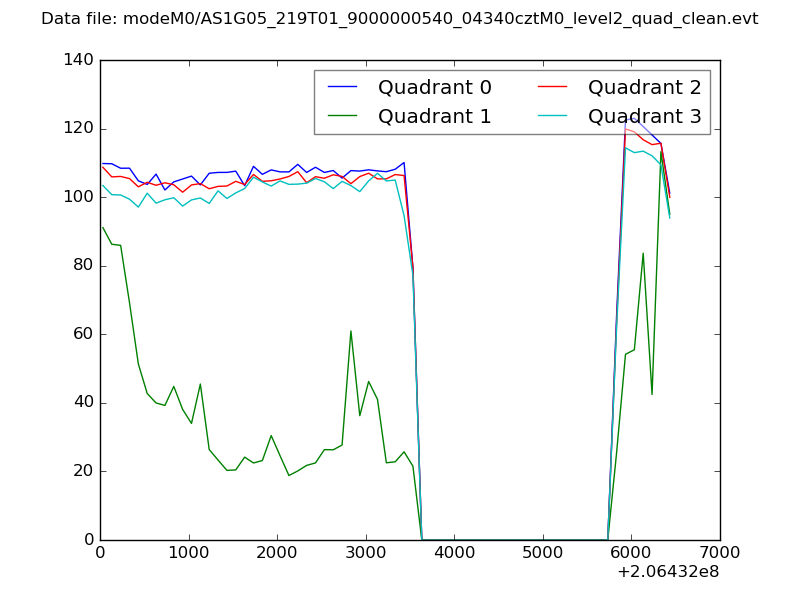 |
|
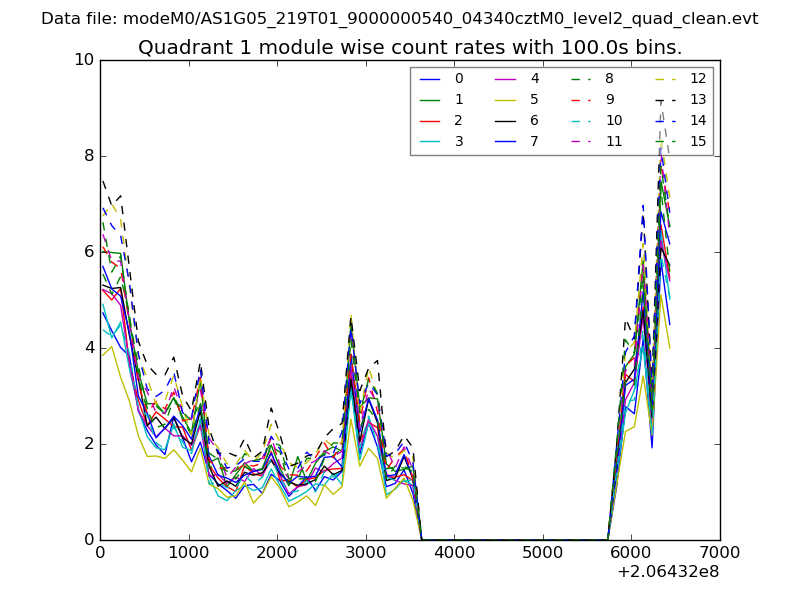
| Module-wise count rates for Quadrant A Data is divided into 100 sec bins |
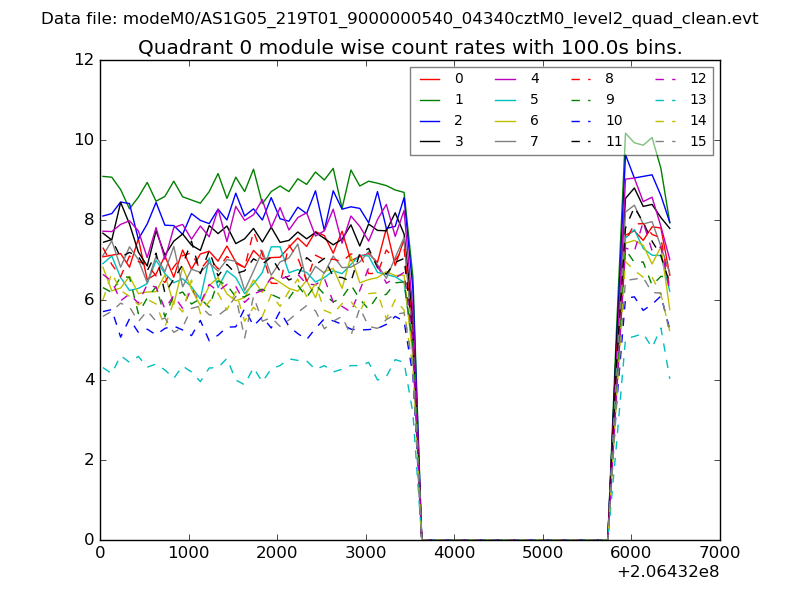 |
 |
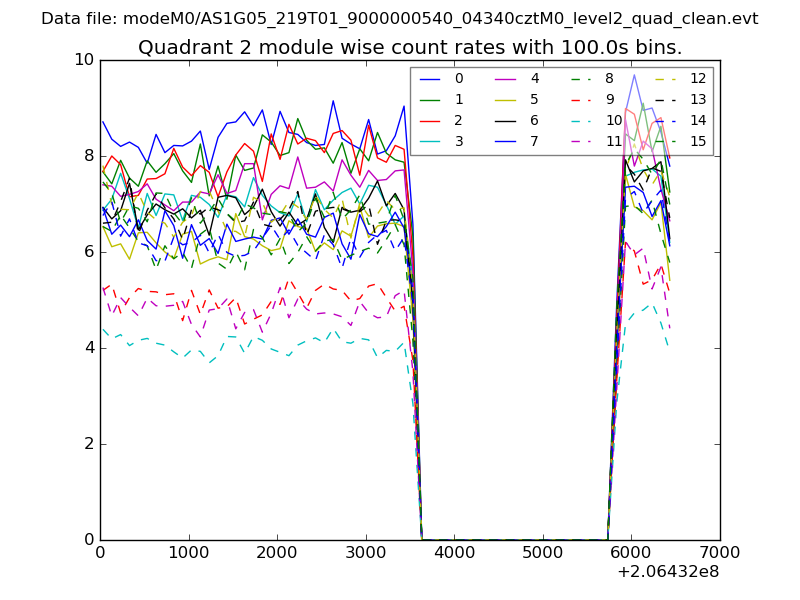
| Module-wise count rates for Quadrant B Data is divided into 100 sec bins |
 |
 |
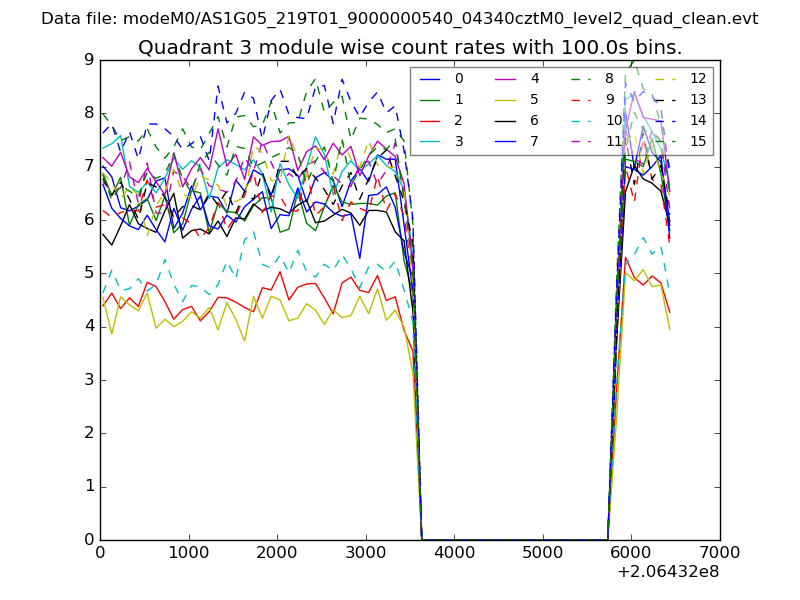
| Module-wise count rates for Quadrant C Data is divided into 100 sec bins |
 |
 |
| Module-wise count rates for Quadrant D Data is divided into 100 sec bins |
 |
 |
| Parameter | Plot |
|---|---|
| CZT HV Monitor | 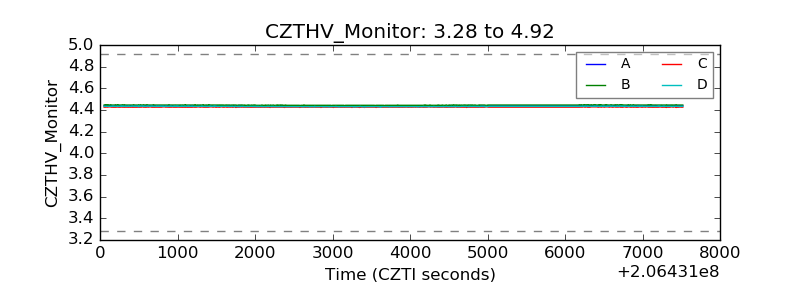 |
| D_VDD | 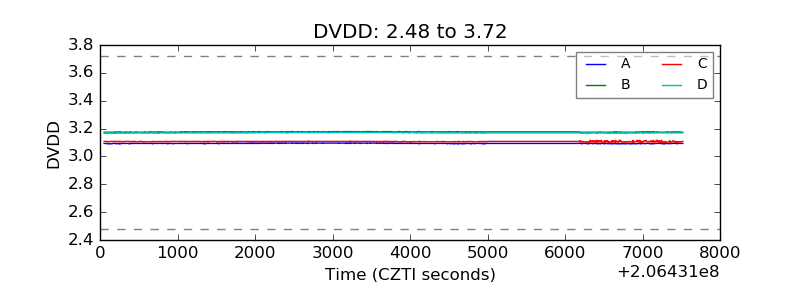 |
| Temperature 1 | 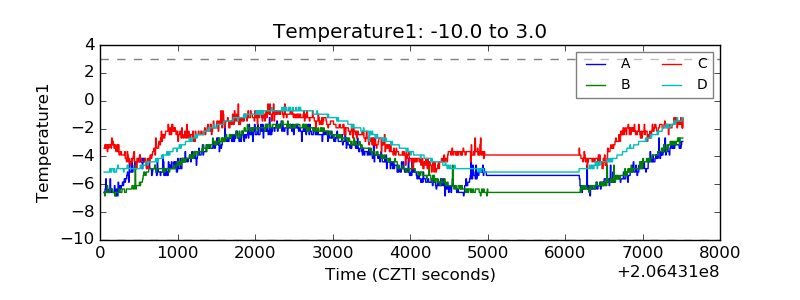 |
| Veto HV Monitor | 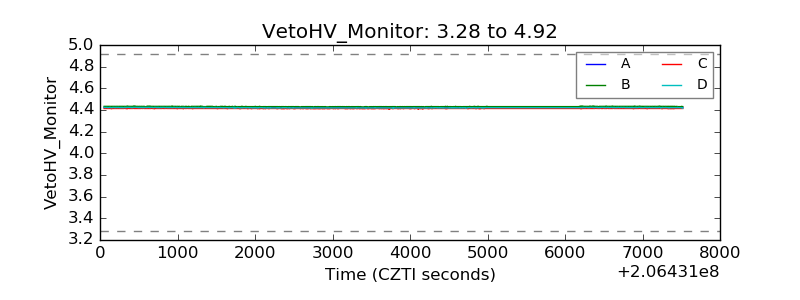 |
| Veto LLD | 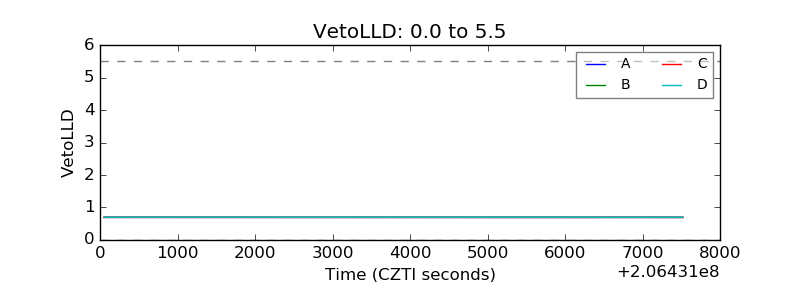 |
| Alpha Counter |  |
| _CPM_Rate |  |
| CZT Counter | 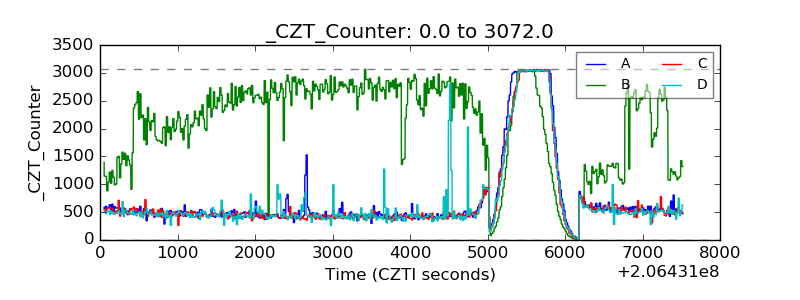 |
| +2.5 Volts monitor |  |
| +5 Volts monitor |  |
| _ROLL_ROT | 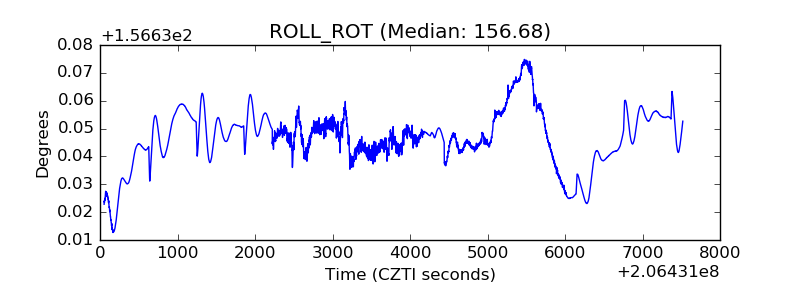 |
| _Roll_DEC | 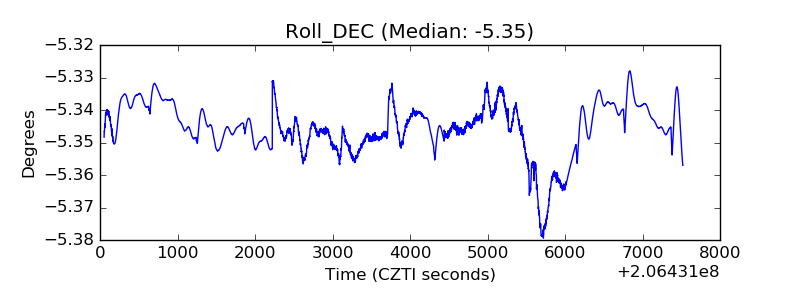 |
| _Roll_RA | 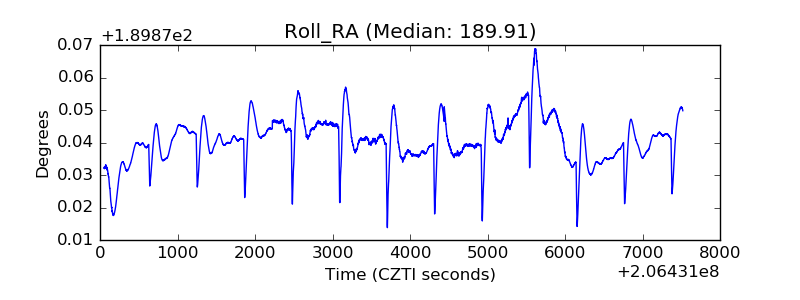 |
| Veto Counter | 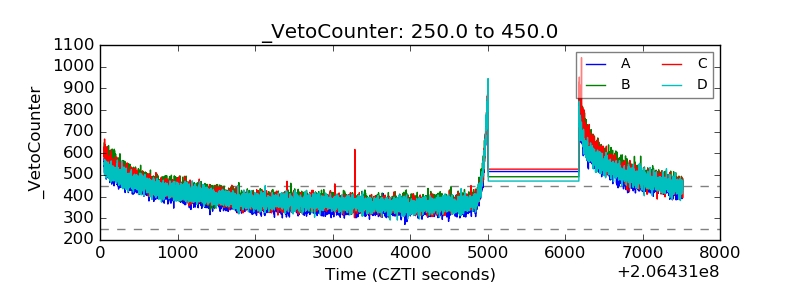 |