| Param | Original file | Final file |
|---|---|---|
| Filename | modeM0/AS1G05_219T01_9000000540_04341cztM0_level2.evt | modeM0/AS1G05_219T01_9000000540_04341cztM0_level2_quad_clean.evt |
| Size (bytes) | 820,258,560 | 73,990,080 |
| Size | 782.3 MB | 70.6 MB |
| Events in quadrant A | 3,276,727 | 538,497 |
| Events in quadrant B | 14,623,791 | 222,651 |
| Events in quadrant C | 3,211,028 | 523,512 |
| Events in quadrant D | 3,297,624 | 507,915 |
| Mode SS | |||
|---|---|---|---|
| Quadrant | BADHDUFLAG | Total packets | Discarded packets |
| A | 0 | 130 | 0 |
| B | 0 | 130 | 0 |
| C | 0 | 130 | 0 |
| D | 0 | 130 | 0 |
| Mode M9 | |||
|---|---|---|---|
| Quadrant | BADHDUFLAG | Total packets | Discarded packets |
| A | 0 | 16 | 0 |
| B | 0 | 16 | 0 |
| C | 0 | 16 | 0 |
| D | 0 | 17 | 0 |
| Mode M0 | |||
|---|---|---|---|
| Quadrant | BADHDUFLAG | Total packets | Discarded packets |
| A | 0 | 13845 | 3 |
| B | 0 | 47707 | 2 |
| C | 0 | 13668 | 2 |
| D | 0 | 13963 | 2 |
| Quadrant | Total seconds | Saturated seconds | Saturation percentage |
|---|---|---|---|
| A | 6389 | 106 | 1.659102% |
| B | 6389 | 5160 | 80.763813% |
| C | 6389 | 84 | 1.314760% |
| D | 6389 | 89 | 1.393019% |
Noise dominated data is calculated using 1-second bins in cleaned event files. If a bin has >2000 counts, and if more than 50% of those come from <1% of pixels, then it is considered to be noise-dominated and hence unusable.
| Quadrant | # 1 sec bins | Bins with >0 counts | Bins with >2000 counts | High rate bins dominated by noise | Noise dominated (total time) | Noise dominated (detector-on time) | Marked lightcurve |
|---|---|---|---|---|---|---|---|
| A | 7629 | 6389 | 13 | 13 | 0.17% | 0.20% | 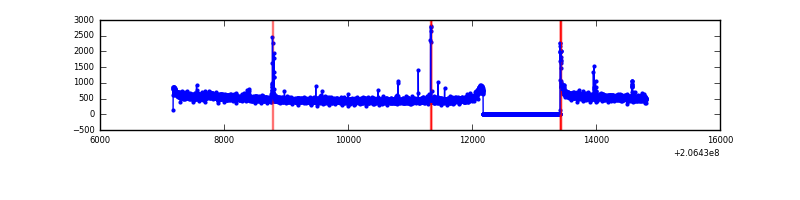 |
| B | 7628 | 6388 | 4898 | 4898 | 64.21% | 76.68% | 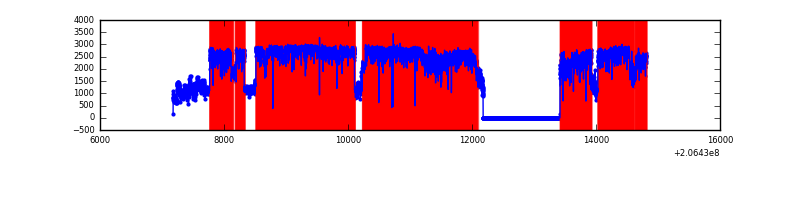 |
| C | 7629 | 6389 | 10 | 10 | 0.13% | 0.16% | 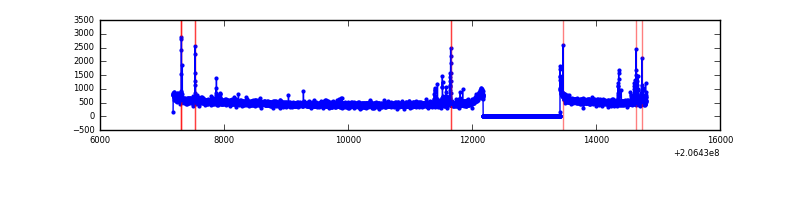 |
| D | 7629 | 6389 | 20 | 20 | 0.26% | 0.31% | 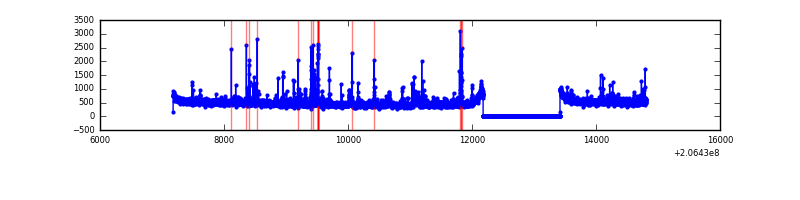 |
Top three noisy pixels from each quadrant. If the there are fewer than three noisy pixels in the level2.evt file, extra rows are filled as -1
| Pixel properties | Quadrant properties | ||||||
|---|---|---|---|---|---|---|---|
| Quadrant | DetID | PixID | Counts | Sigma | Mean | Median | Sigma |
| A | 15 | 234 | 62573 | 373.23 | 818 | 803 | 165.5 |
| A | 0 | 50 | 29649 | 174.3 | 818 | 803 | 165.5 |
| A | 8 | 15 | 14358 | 81.9 | 818 | 803 | 165.5 |
| B | 3 | 0 | 12651523 | 139900.57 | 472 | 463 | 90.4 |
| B | 10 | 16 | 68245 | 749.56 | 472 | 463 | 90.4 |
| B | 14 | 167 | 41107 | 449.46 | 472 | 463 | 90.4 |
| C | 9 | 247 | 85811 | 467.68 | 784 | 790 | 181.8 |
| C | 9 | 16 | 39404 | 212.41 | 784 | 790 | 181.8 |
| C | 8 | 128 | 14686 | 76.44 | 784 | 790 | 181.8 |
| D | 2 | 136 | 97434 | 511.03 | 792 | 772 | 189.2 |
| D | 14 | 34 | 54004 | 281.42 | 792 | 772 | 189.2 |
| D | 9 | 35 | 43824 | 227.61 | 792 | 772 | 189.2 |
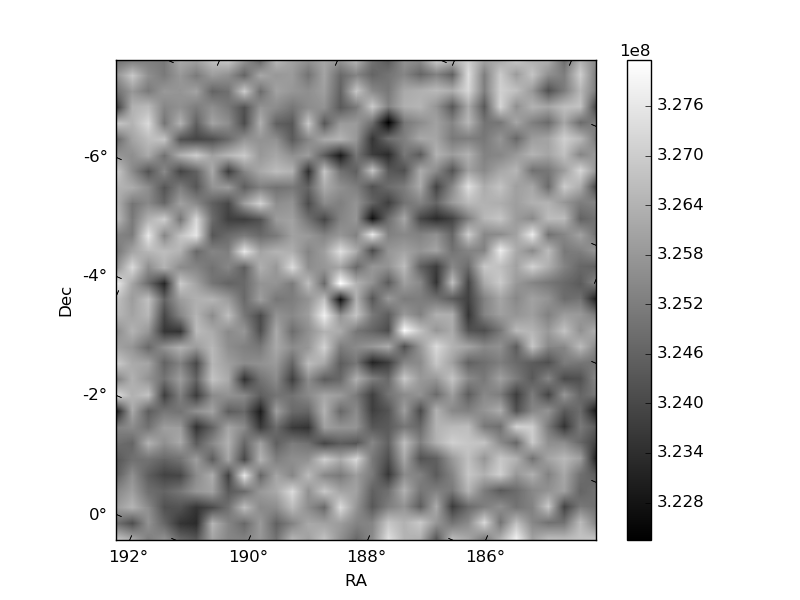
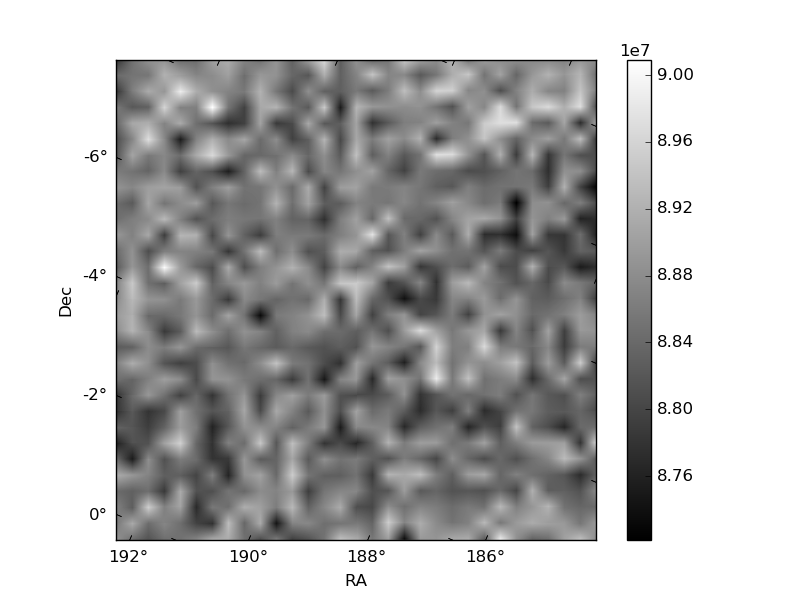
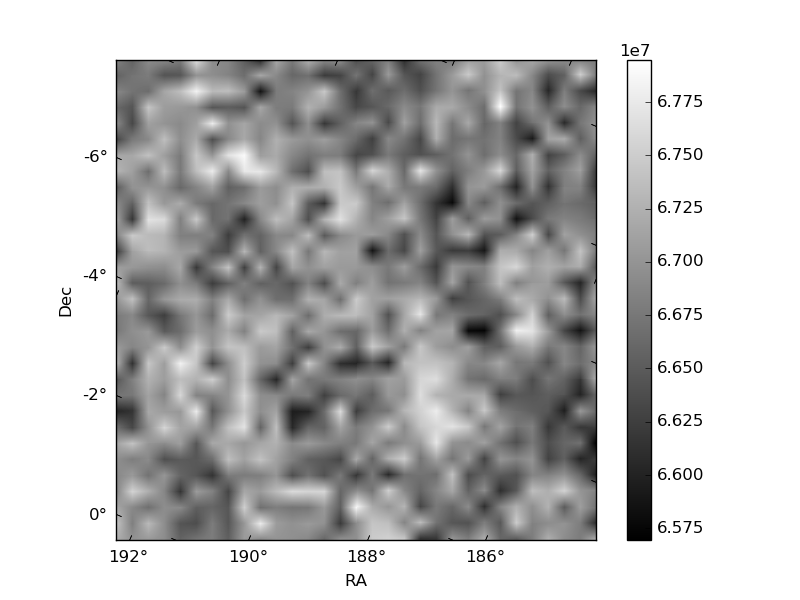
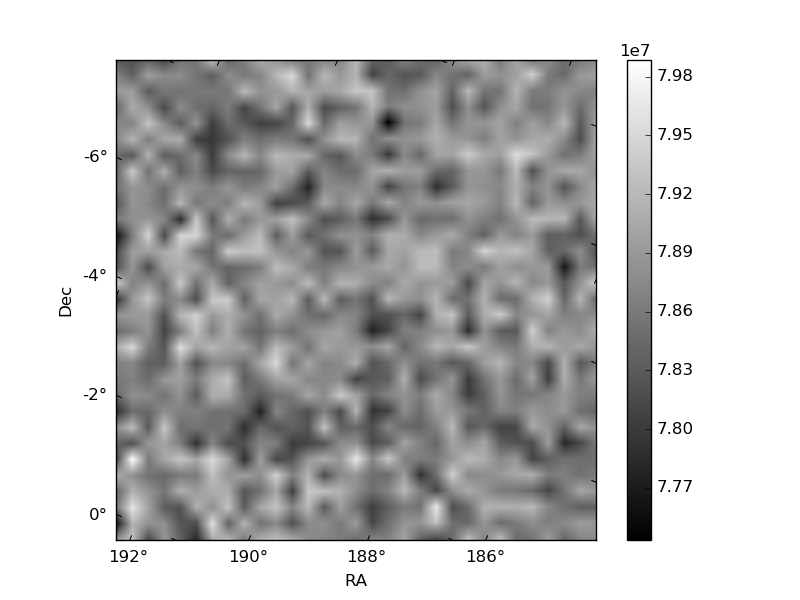
Histogram calculated using DETX and DETY for each event in the final _common_clean file
| Quadrant A | 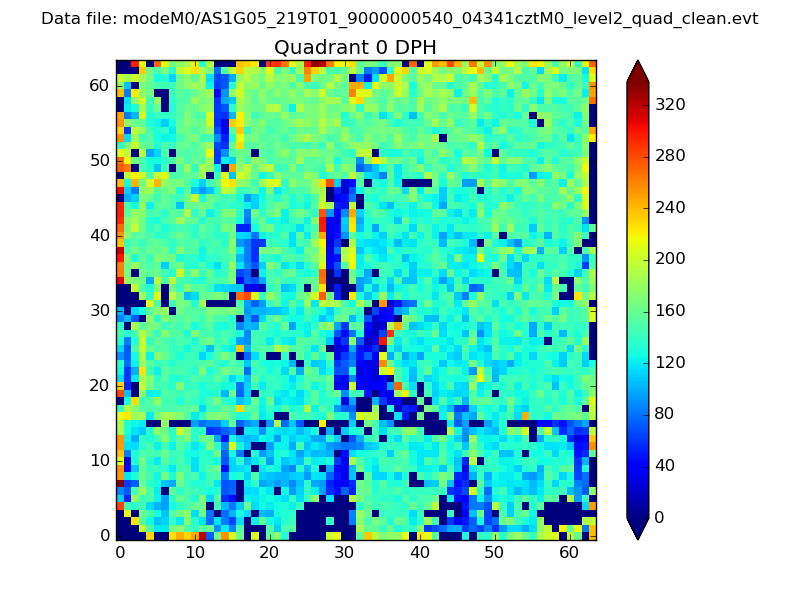 |
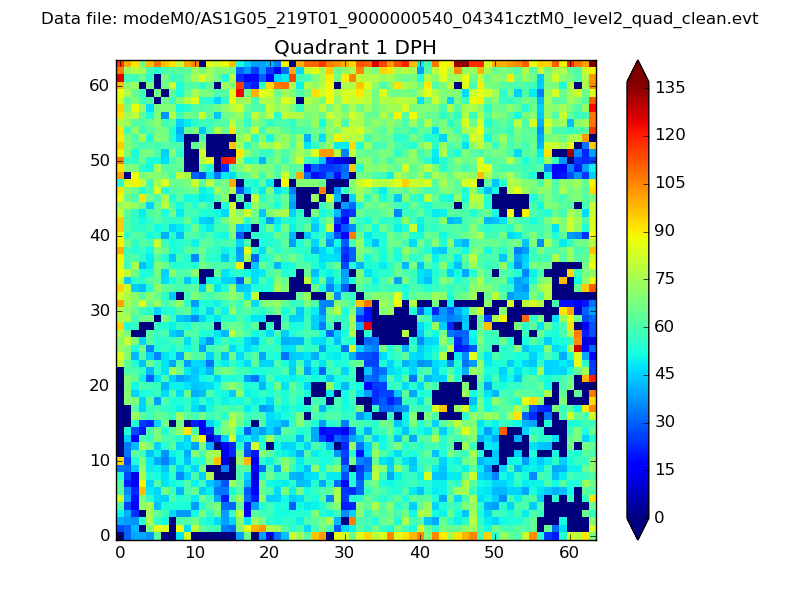 |
Quadrant B |
|---|---|---|---|
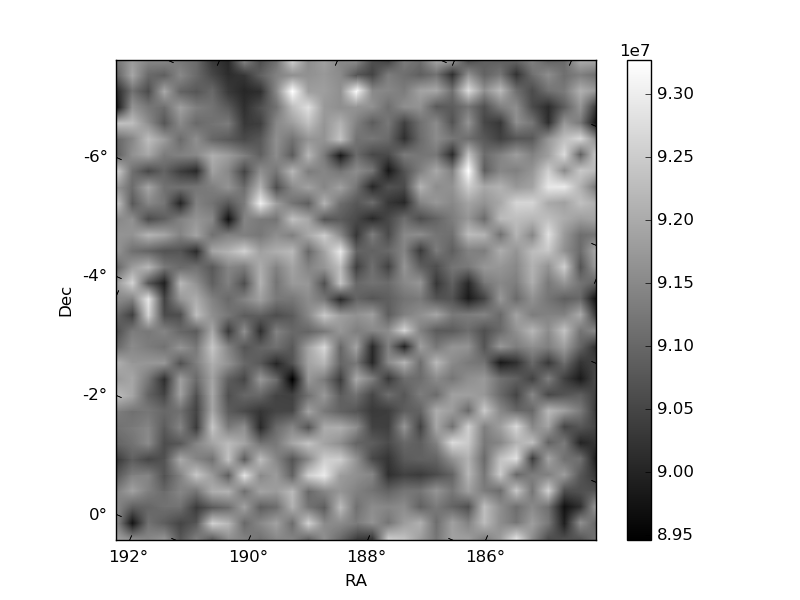
| Quadrant D | 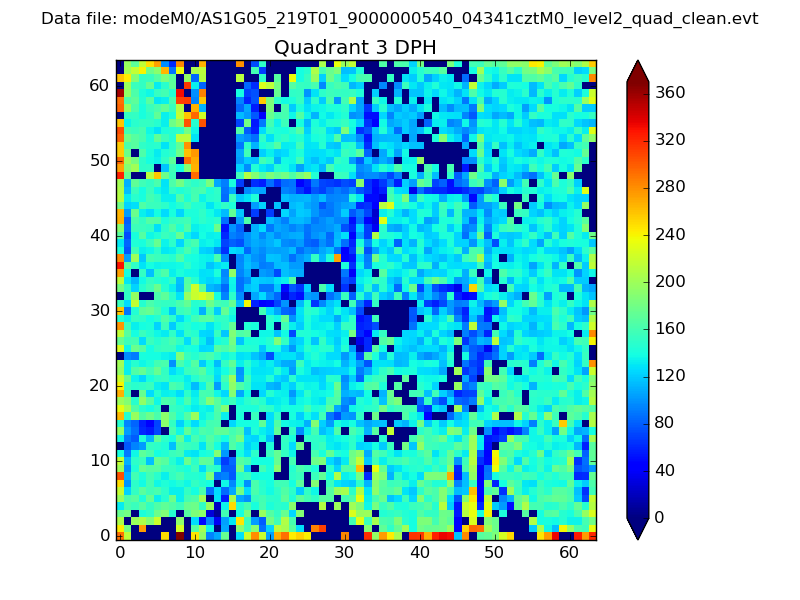 |
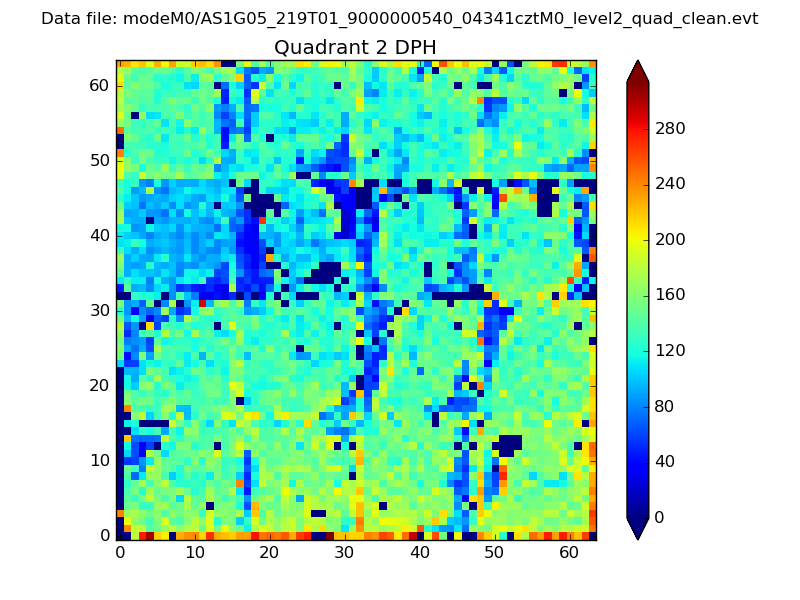 |
Quadrant C |
| Plot type | Count rate plots | Images |
|---|---|---|
| Comparison with Poisson distribution Blue bars denote a histogram of data divided into 1 sec bins. Red curve is a Poisson curve with rate = median count rate of data. |
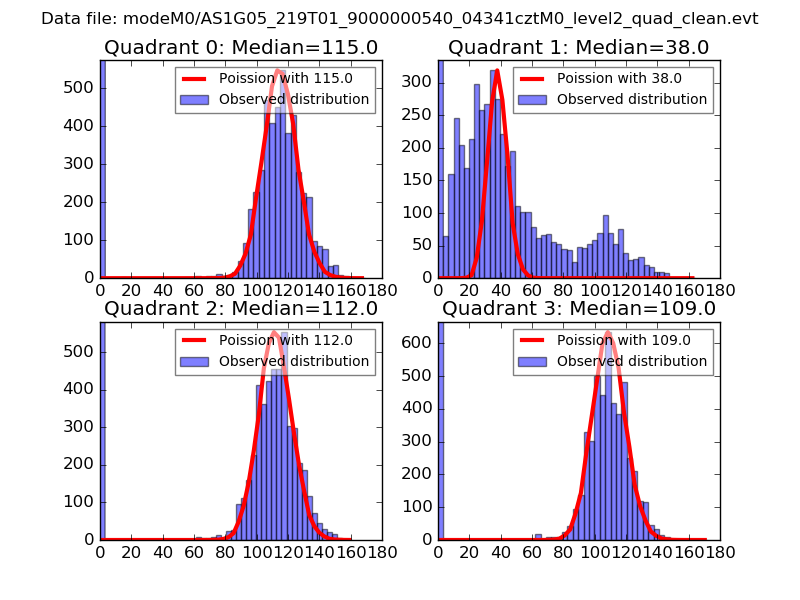 |
 |
| Quadrant-wise count rates Data is divided into 100 sec bins |
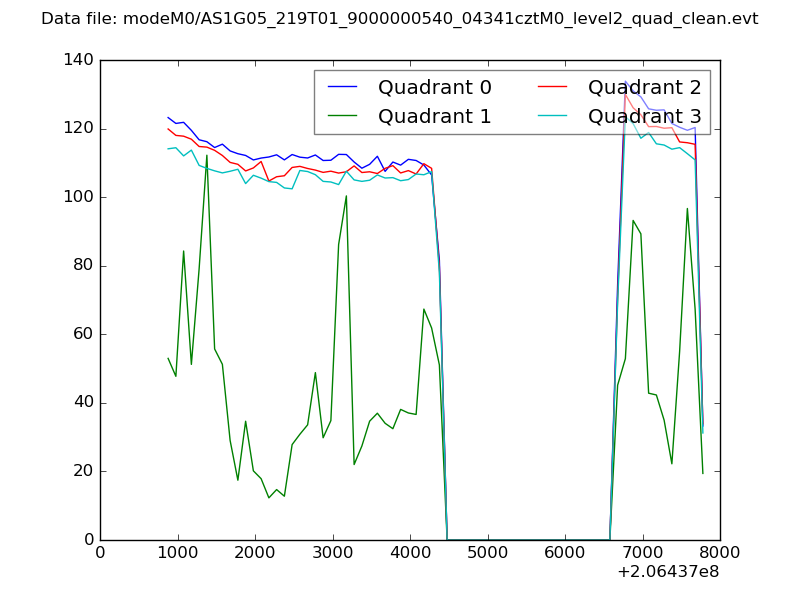 |
|
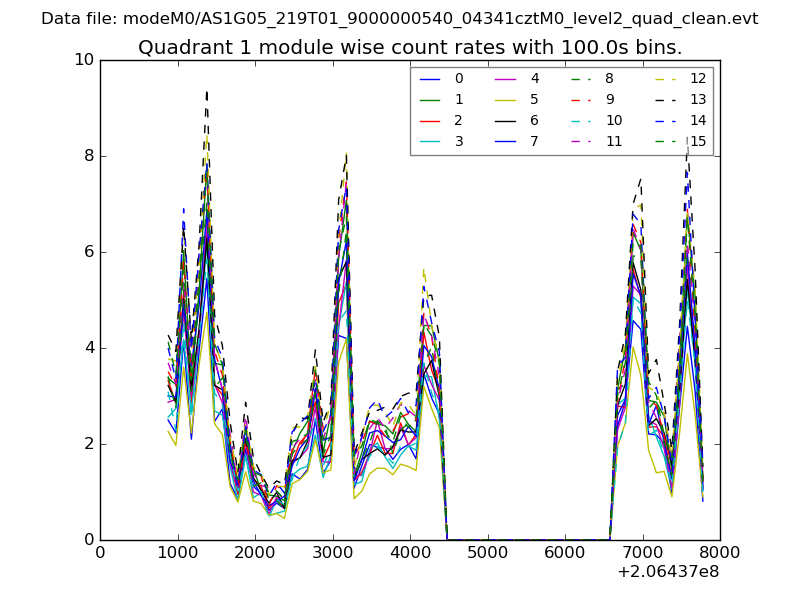
| Module-wise count rates for Quadrant A Data is divided into 100 sec bins |
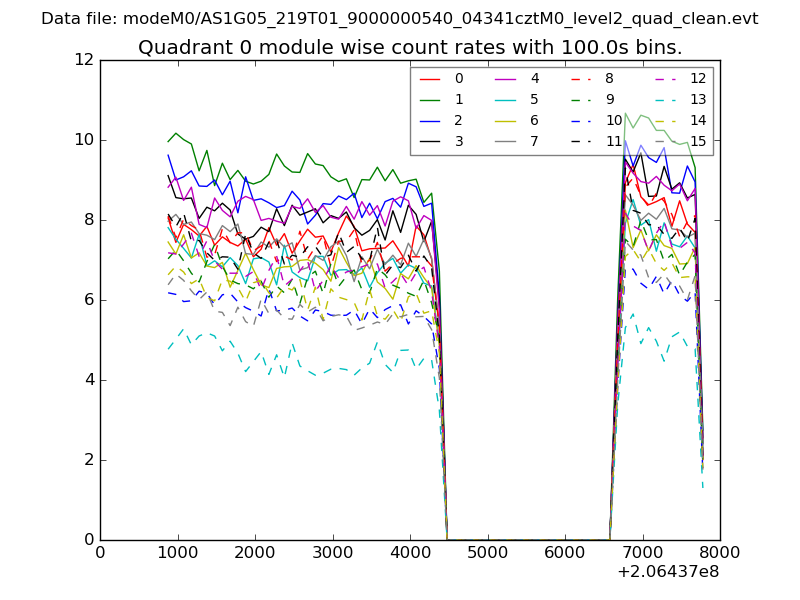 |
 |
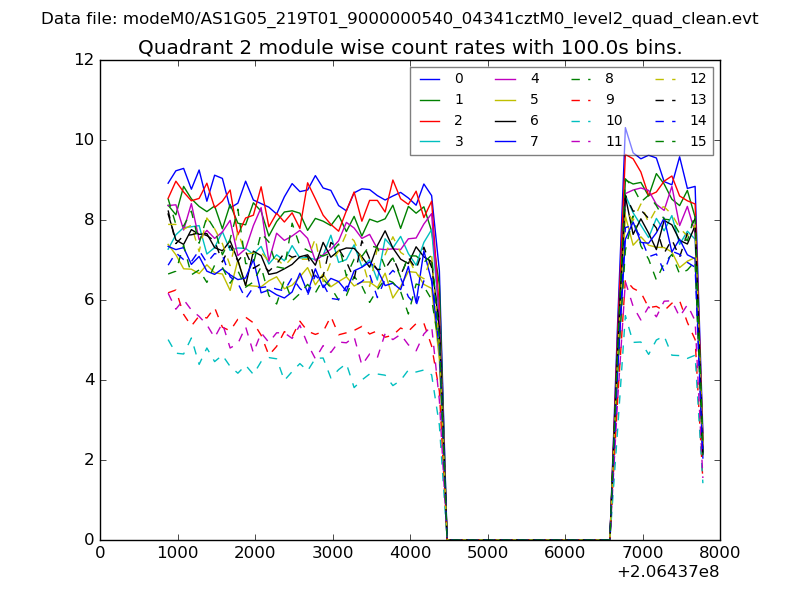
| Module-wise count rates for Quadrant B Data is divided into 100 sec bins |
 |
 |
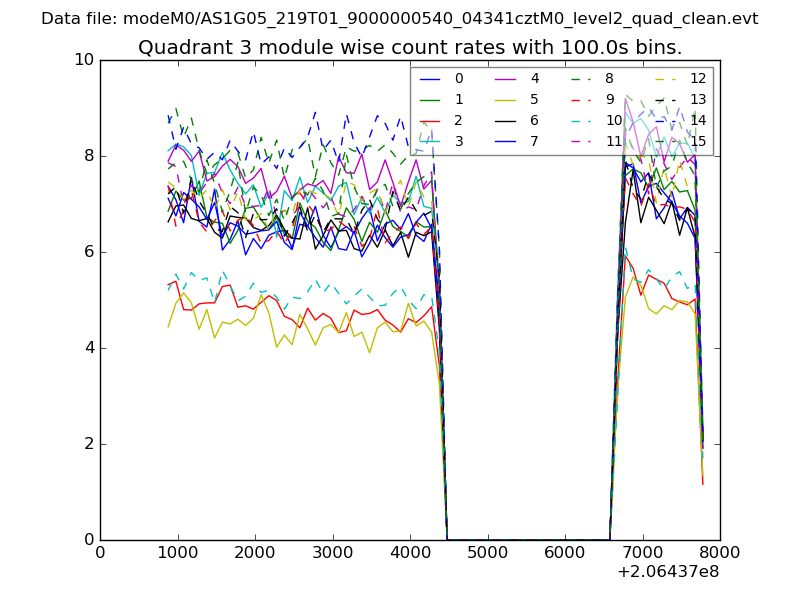
| Module-wise count rates for Quadrant C Data is divided into 100 sec bins |
 |
 |
| Module-wise count rates for Quadrant D Data is divided into 100 sec bins |
 |
 |
| Parameter | Plot |
|---|---|
| CZT HV Monitor | 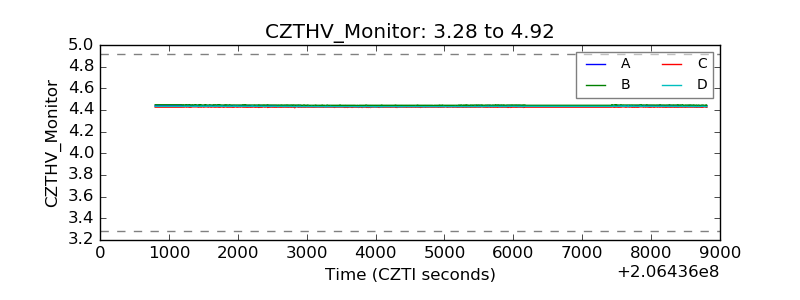 |
| D_VDD | 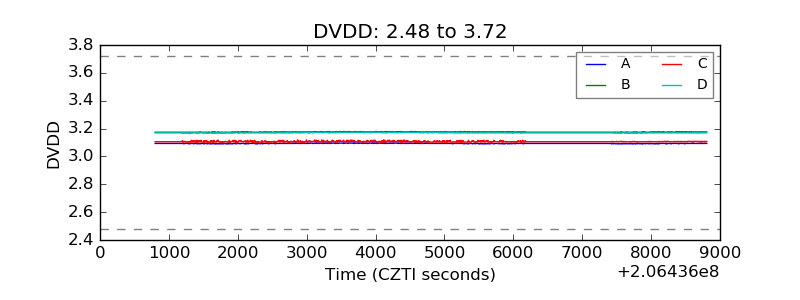 |
| Temperature 1 | 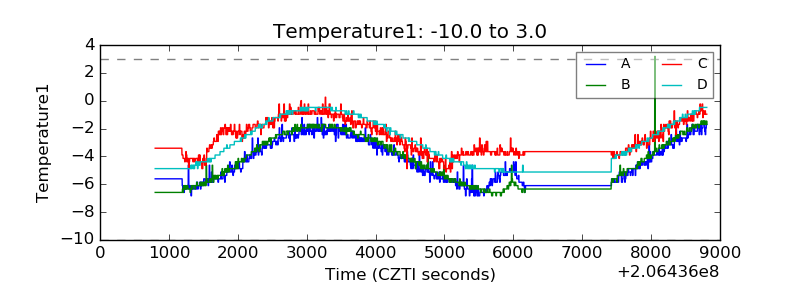 |
| Veto HV Monitor | 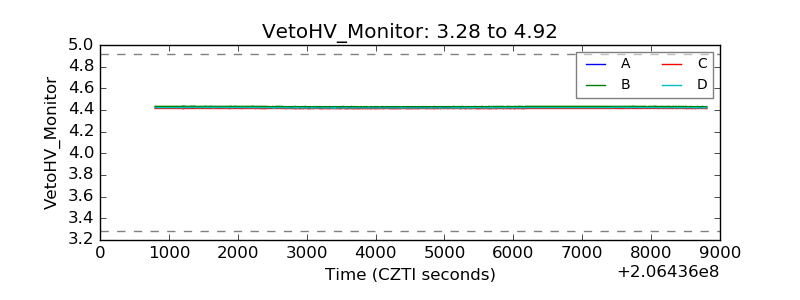 |
| Veto LLD | 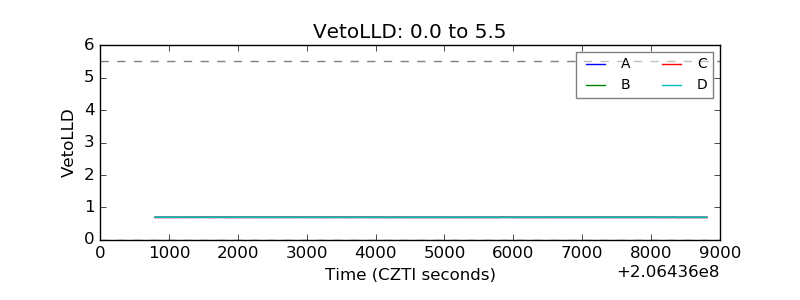 |
| Alpha Counter | 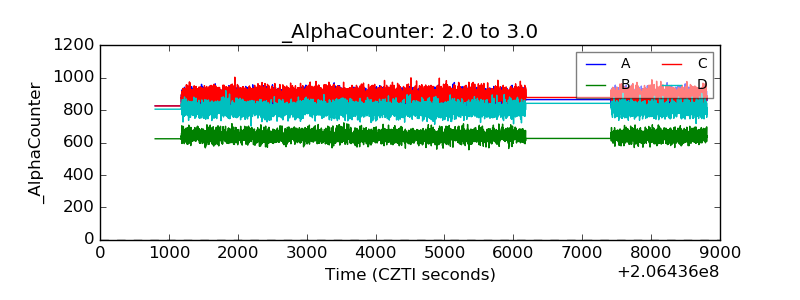 |
| _CPM_Rate | 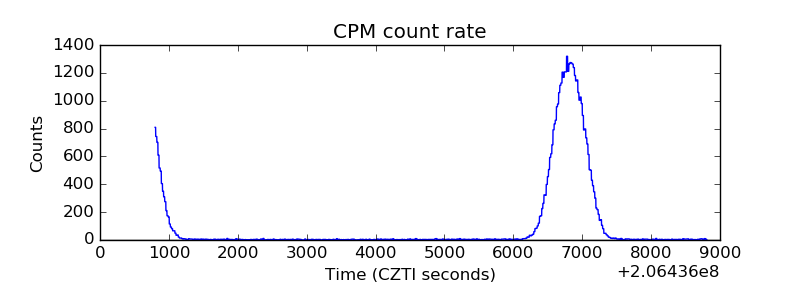 |
| CZT Counter | 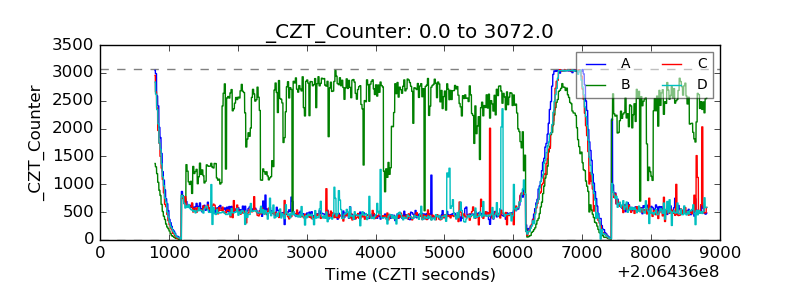 |
| +2.5 Volts monitor |  |
| +5 Volts monitor |  |
| _ROLL_ROT |  |
| _Roll_DEC | 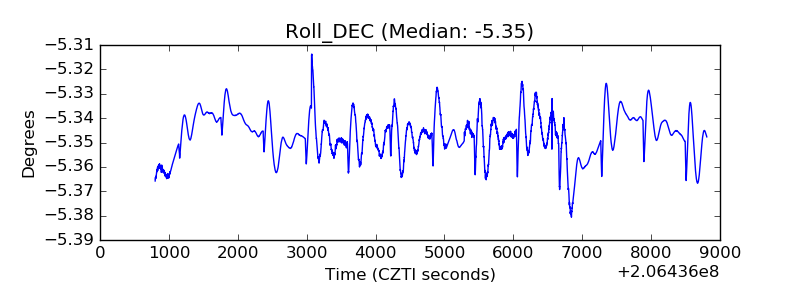 |
| _Roll_RA | 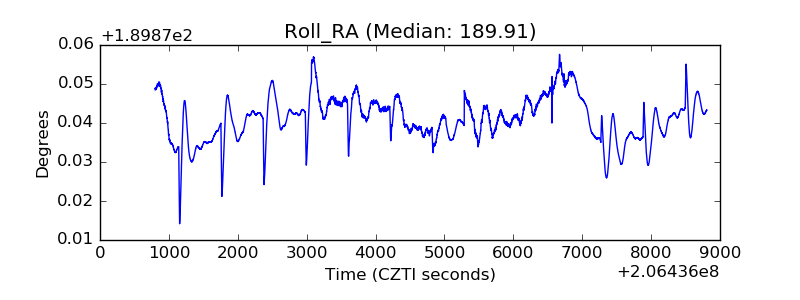 |
| Veto Counter | 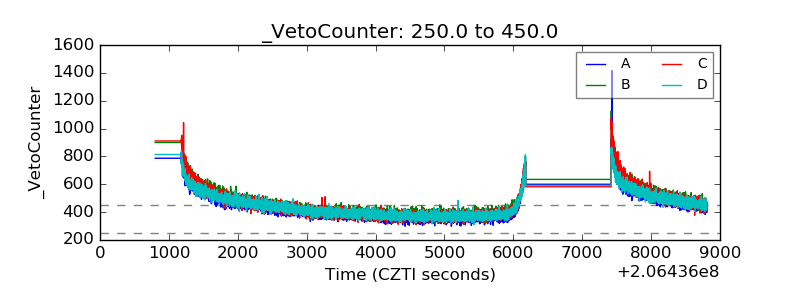 |