| Param | Original file | Final file |
|---|---|---|
| Filename | modeM0/AS1G05_219T01_9000000540_04343cztM0_level2.evt | modeM0/AS1G05_219T01_9000000540_04343cztM0_level2_quad_clean.evt |
| Size (bytes) | 857,180,160 | 70,188,480 |
| Size | 817.5 MB | 66.9 MB |
| Events in quadrant A | 3,254,735 | 523,418 |
| Events in quadrant B | 15,977,818 | 168,057 |
| Events in quadrant C | 2,952,784 | 510,058 |
| Events in quadrant D | 3,356,420 | 490,188 |
| Mode SS | |||
|---|---|---|---|
| Quadrant | BADHDUFLAG | Total packets | Discarded packets |
| A | 0 | 126 | 0 |
| B | 0 | 126 | 0 |
| C | 0 | 126 | 0 |
| D | 0 | 126 | 0 |
| Mode M9 | |||
|---|---|---|---|
| Quadrant | BADHDUFLAG | Total packets | Discarded packets |
| A | 0 | 12 | 0 |
| B | 0 | 12 | 0 |
| C | 0 | 12 | 0 |
| D | 0 | 12 | 0 |
| Mode M0 | |||
|---|---|---|---|
| Quadrant | BADHDUFLAG | Total packets | Discarded packets |
| A | 0 | 13623 | 2 |
| B | 0 | 51494 | 1 |
| C | 0 | 12993 | 1 |
| D | 0 | 14066 | 1 |
| Quadrant | Total seconds | Saturated seconds | Saturation percentage |
|---|---|---|---|
| A | 6169 | 103 | 1.669639% |
| B | 6169 | 6093 | 98.768034% |
| C | 6169 | 66 | 1.069865% |
| D | 6169 | 166 | 2.690874% |
Noise dominated data is calculated using 1-second bins in cleaned event files. If a bin has >2000 counts, and if more than 50% of those come from <1% of pixels, then it is considered to be noise-dominated and hence unusable.
| Quadrant | # 1 sec bins | Bins with >0 counts | Bins with >2000 counts | High rate bins dominated by noise | Noise dominated (total time) | Noise dominated (detector-on time) | Marked lightcurve |
|---|---|---|---|---|---|---|---|
| A | 7409 | 6169 | 17 | 17 | 0.23% | 0.28% | 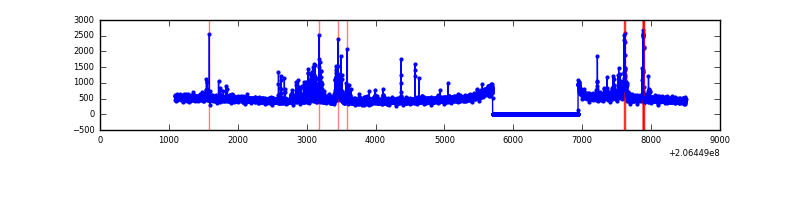 |
| B | 7408 | 6168 | 5947 | 5947 | 80.28% | 96.42% | 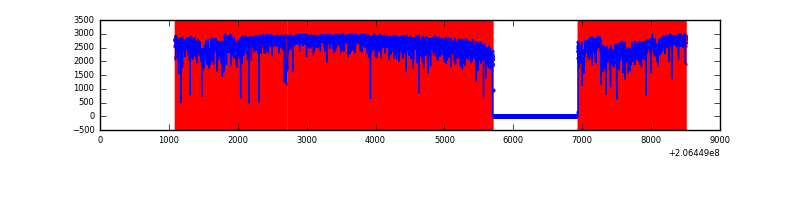 |
| C | 7409 | 6169 | 5 | 5 | 0.07% | 0.08% | 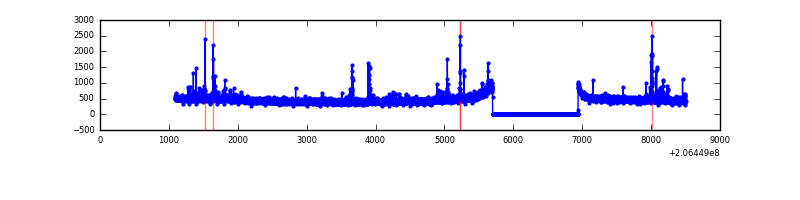 |
| D | 7409 | 6169 | 111 | 111 | 1.50% | 1.80% | 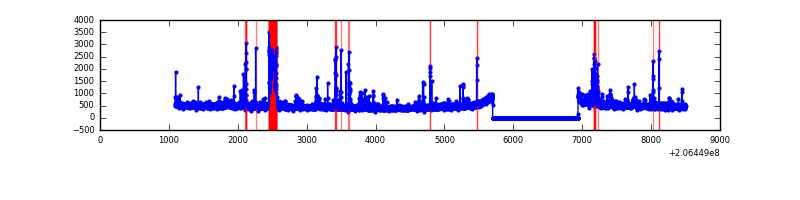 |
Top three noisy pixels from each quadrant. If the there are fewer than three noisy pixels in the level2.evt file, extra rows are filled as -1
| Pixel properties | Quadrant properties | ||||||
|---|---|---|---|---|---|---|---|
| Quadrant | DetID | PixID | Counts | Sigma | Mean | Median | Sigma |
| A | 13 | 251 | 167922 | 1076.21 | 755 | 738 | 155.3 |
| A | 7 | 16 | 70216 | 447.25 | 755 | 738 | 155.3 |
| A | 8 | 15 | 59817 | 380.31 | 755 | 738 | 155.3 |
| B | 3 | 0 | 14541759 | 239481.94 | 313 | 307 | 60.7 |
| B | 15 | 54 | 42816 | 700.08 | 313 | 307 | 60.7 |
| B | 15 | 204 | 42138 | 688.91 | 313 | 307 | 60.7 |
| C | 9 | 247 | 127952 | 747.01 | 722 | 726 | 170.3 |
| C | 13 | 61 | 5920 | 30.5 | 722 | 726 | 170.3 |
| C | 10 | 65 | 3782 | 17.94 | 722 | 726 | 170.3 |
| D | 2 | 37 | 236629 | 1350.52 | 725 | 706 | 174.7 |
| D | 2 | 136 | 134549 | 766.17 | 725 | 706 | 174.7 |
| D | 13 | 53 | 83639 | 474.74 | 725 | 706 | 174.7 |
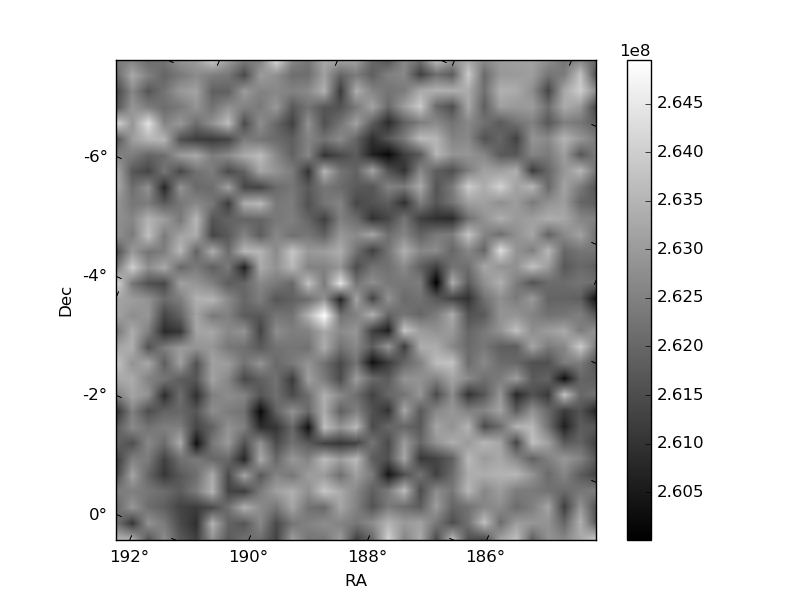
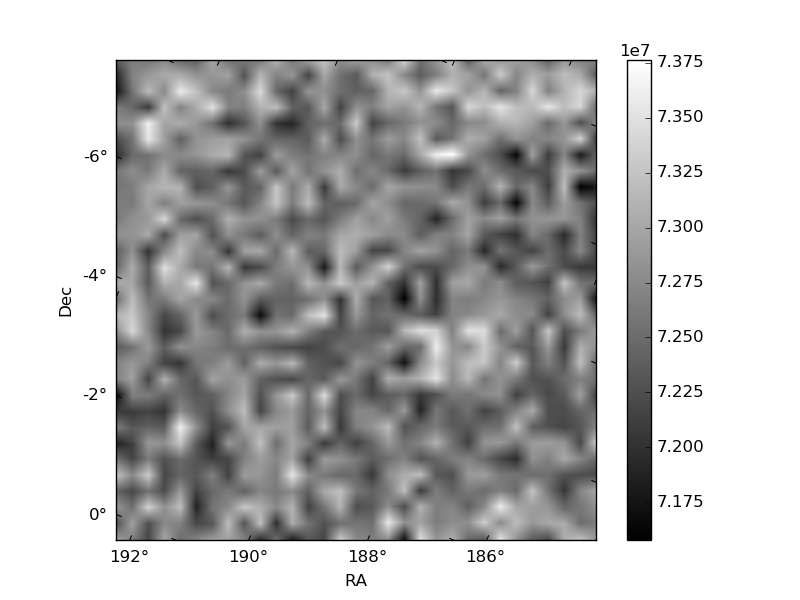
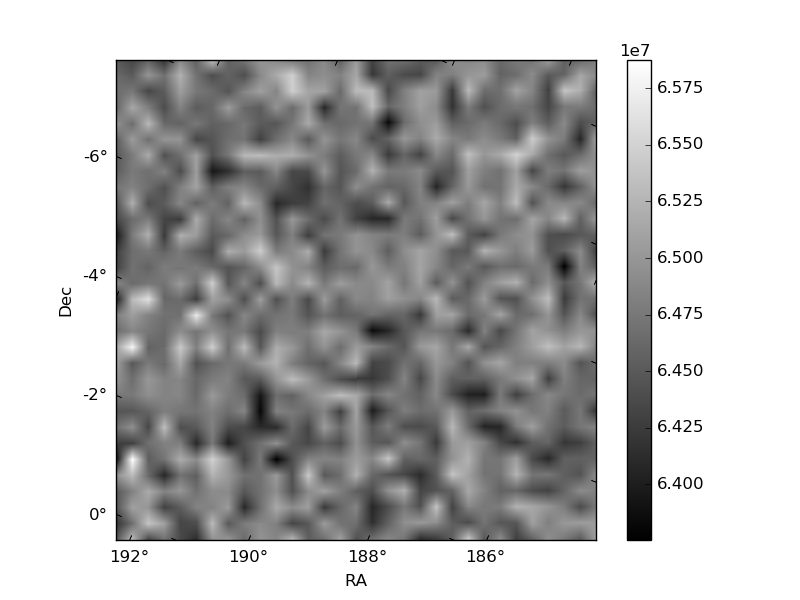
Histogram calculated using DETX and DETY for each event in the final _common_clean file
| Quadrant A | 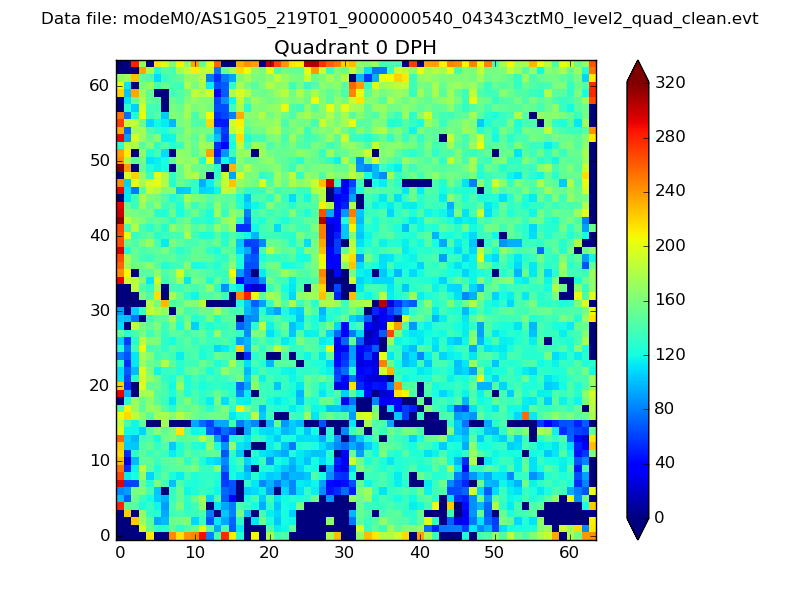 |
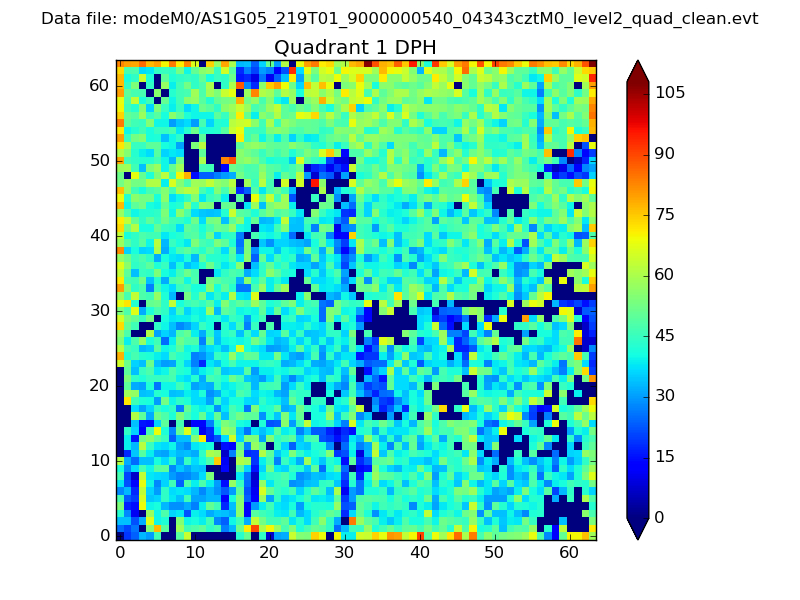 |
Quadrant B |
|---|---|---|---|
| Quadrant D | 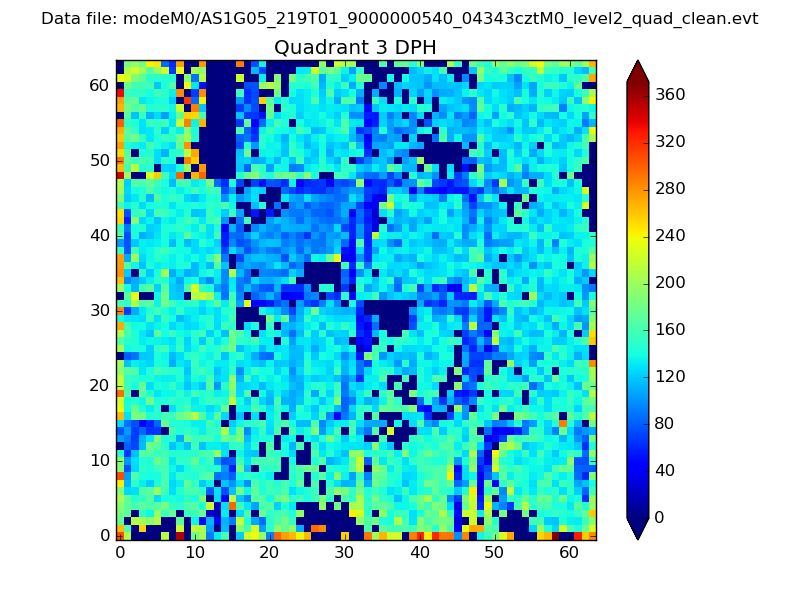 |
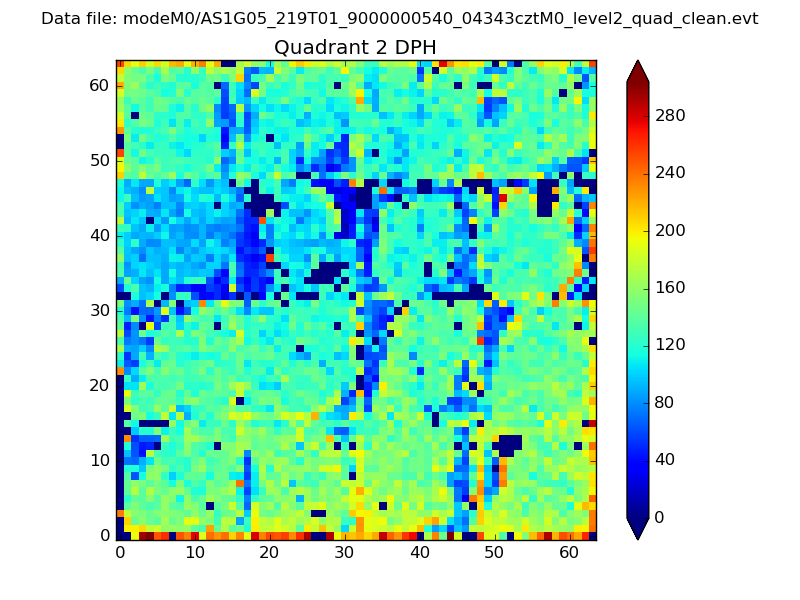 |
Quadrant C |
| Plot type | Count rate plots | Images |
|---|---|---|
| Comparison with Poisson distribution Blue bars denote a histogram of data divided into 1 sec bins. Red curve is a Poisson curve with rate = median count rate of data. |
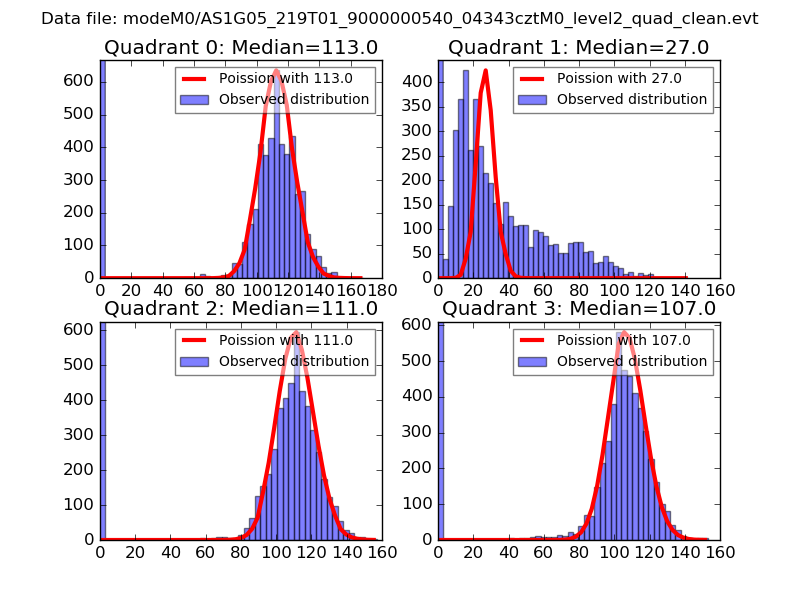 |
 |
| Quadrant-wise count rates Data is divided into 100 sec bins |
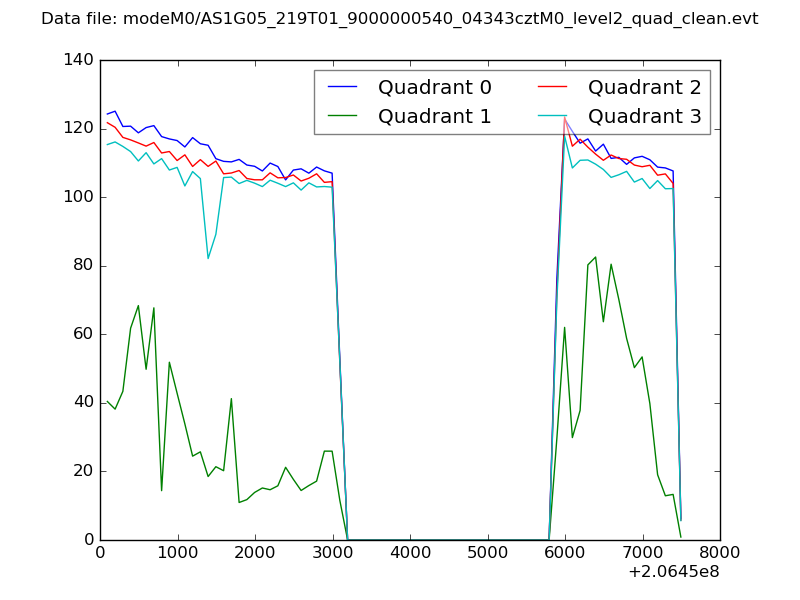 |
|
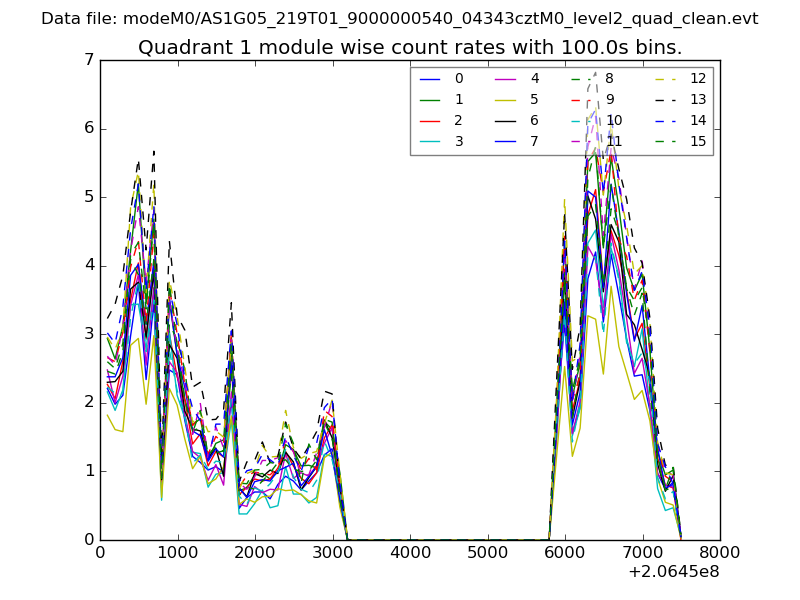
| Module-wise count rates for Quadrant A Data is divided into 100 sec bins |
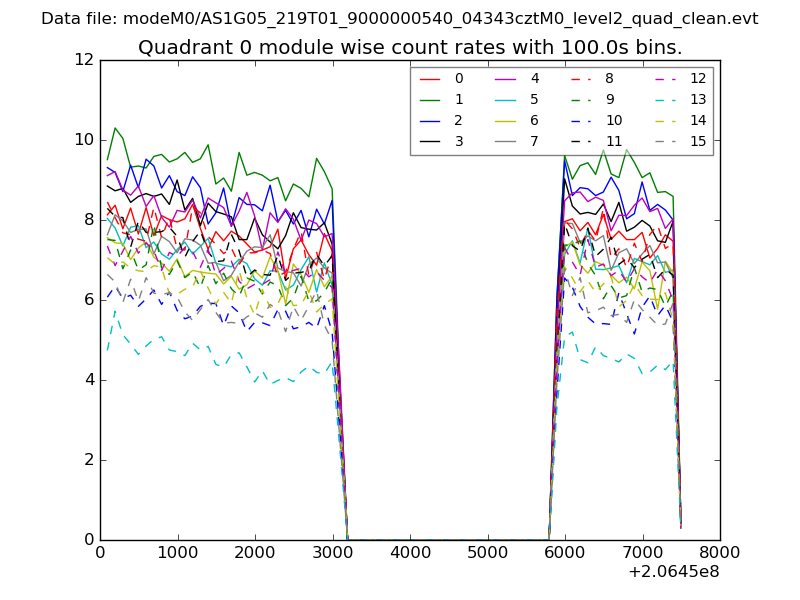 |
 |
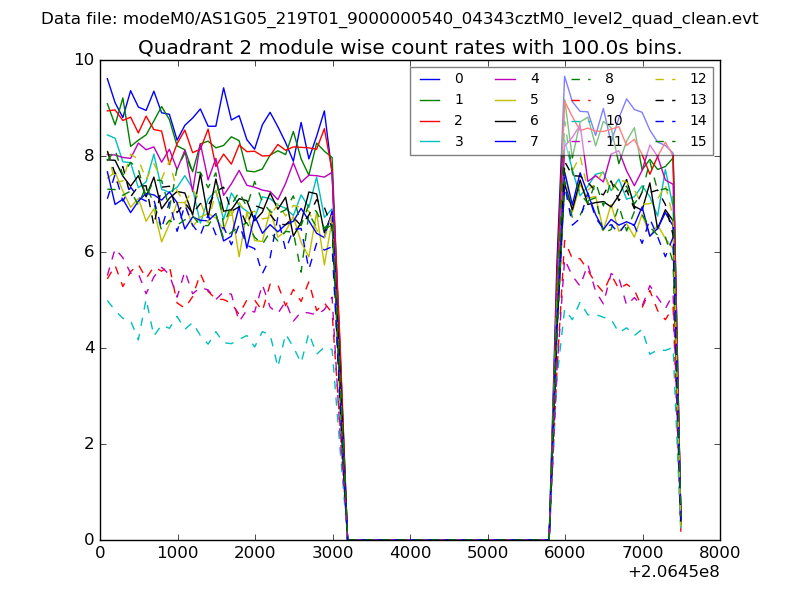
| Module-wise count rates for Quadrant B Data is divided into 100 sec bins |
 |
 |
| Module-wise count rates for Quadrant C Data is divided into 100 sec bins |
 |
 |
| Module-wise count rates for Quadrant D Data is divided into 100 sec bins |
 |
 |
| Parameter | Plot |
|---|---|
| CZT HV Monitor | 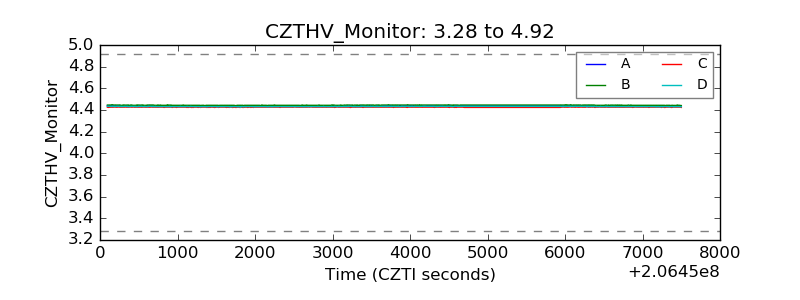 |
| D_VDD | 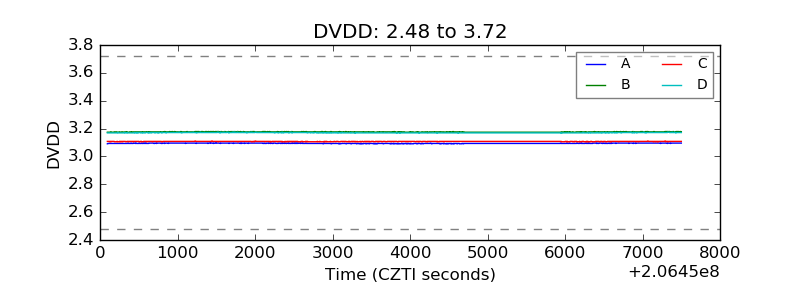 |
| Temperature 1 | 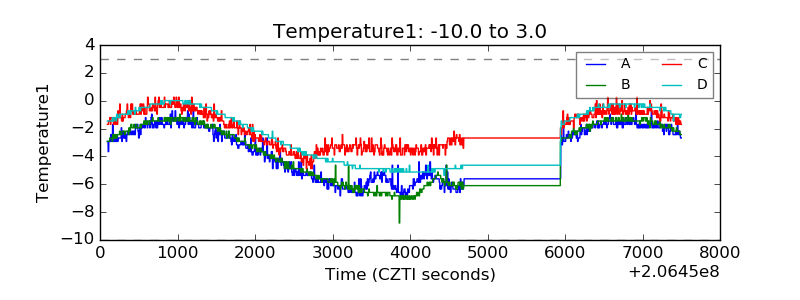 |
| Veto HV Monitor | 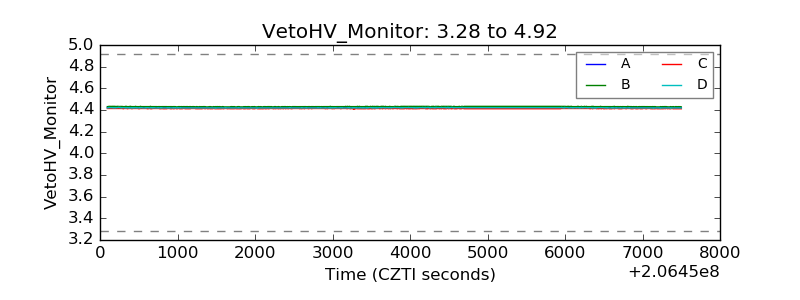 |
| Veto LLD | 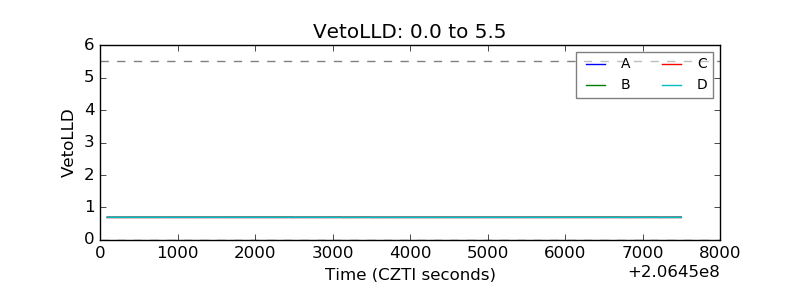 |
| Alpha Counter | 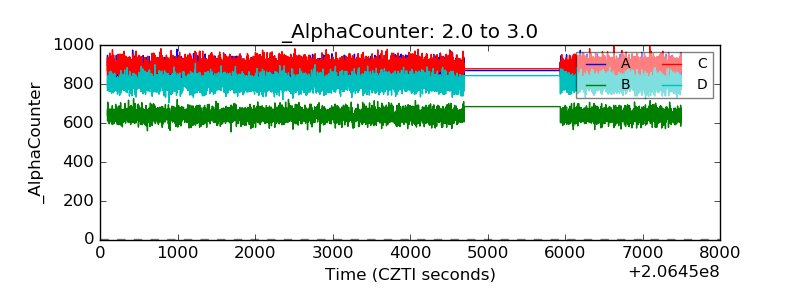 |
| _CPM_Rate | 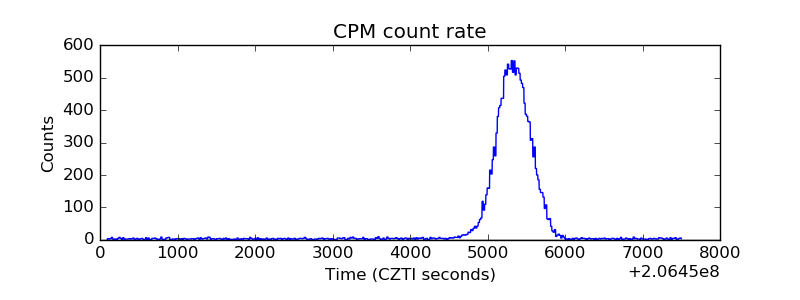 |
| CZT Counter | 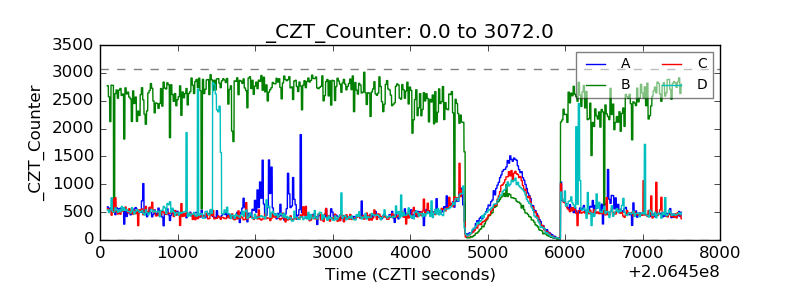 |
| +2.5 Volts monitor |  |
| +5 Volts monitor |  |
| _ROLL_ROT |  |
| _Roll_DEC | 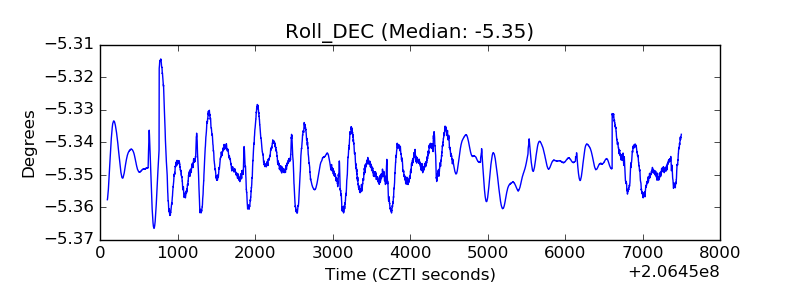 |
| _Roll_RA | 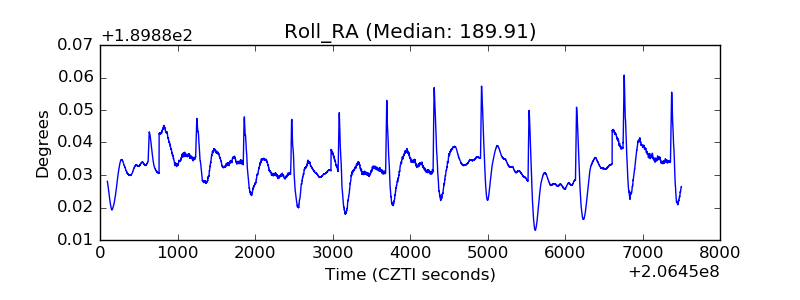 |
| Veto Counter | 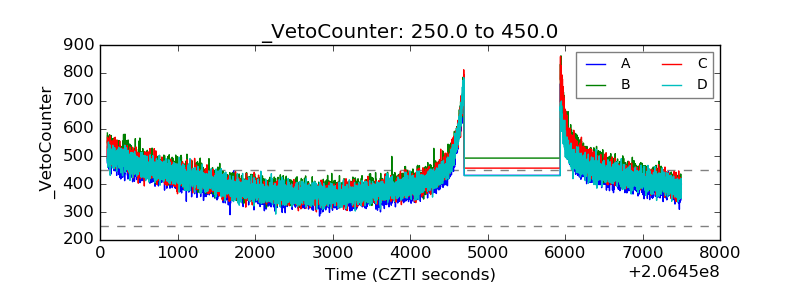 |